SystemTap is a powerful tool for investigating system issues, but for some SystemTap instrumentation scripts, the startup times are too long. This article is Part 1 of a series and describes how to analyze and reduce SystemTap's startup costs for scripts.
We can use SystemTap to investigate this problem and provide some hard data on the time required for each of the passes that SystemTap uses to convert a SystemTap script into instrumentation. SystemTap has a set of probe points marking the start and end of passes from 0 to 5:
- pass0: Parsing command-line arguments
- pass1: Parsing scripts
- pass2: Elaboration
- pass3: Translation to C
- pass4: Compilation of C code into kernel module
- pass5: Running the instrumentation
Articles in this series:
- Part 1: Analyzing and reducing SystemTap's startup cost for scripts
- Part 2: Reducing the startup overhead of SystemTap monitoring scripts with syscall_any tapset
Analyzing startup costs
Since we are interested in the time required to the point where the script is actually collecting data, we are not going to collect data on pass5. Each of the probe points for the start and end of a pass includes an argument to a C++ structure describing the session. The session structure includes information about the script name, which is useful for identifying which scripts have high startup overhead. The SystemTap example script stap_time.stp was developed to record this information. Because there are differences in how Red Hat Enterprise Linux (RHEL) 7 stores C++ strings, the script has been slightly modified to the following:
#! /usr/bin/env stap
# Copyright (C) 2018 Red Hat, Inc.
# Written by William Cohen <wcohen@redhat.com>
#
# Provide concise plottable information about phases 0-4 of systemtap

global start, pass0, pass1, pass2, pass3, pass4

function print_head() {printf("")}
function print_tail() {printf("")}

probe begin { print_head() }
probe end { print_tail() }

probe stap.pass0 { start[session] = gettimeofday_ms() }
probe stap.pass0.end { pass0[session] = gettimeofday_ms() }
probe stap.pass1.end { pass1[session] = gettimeofday_ms() }
probe stap.pass2.end { pass2[session] = gettimeofday_ms() }
probe stap.pass3.end { pass3[session] = gettimeofday_ms() }

probe stap.pass4.end {
pass4[session] = gettimeofday_ms()
// Dig through C++ string private fields to find the systemtap script name
cmdline_script = @cast(session, "struct systemtap_session")->cmdline_script->_M_dataplus->_M_p
if (strlen(user_string2(cmdline_script, "<unavailable>"))){
  script = "<cmdline_script>"
} else {
  script_file = @cast(session, "struct systemtap_session")->script_file->_M_dataplus->_M_p
  script = user_string2(script_file, "<unavailable>")
}

// print out data
printf("%s %d %d %d %d %d\n",
script,
pass0[session] - start[session],
pass1[session] - pass0[session],
pass2[session] - pass1[session],
pass3[session] - pass2[session],
pass4[session] - pass3[session])
// delete entries
delete pass0[session]
delete pass1[session]
delete pass2[session]
delete pass3[session]
delete pass4[session]
}
When the script is running, each time SystemTap runs and completes pass4, it prints out a line that shows the script name followed by the time required in milliseconds for each pass (0 through 4), similar to the following:
also_ran.stp 71 1721 1440 80 2245
Because the SystemTap scripts are part of SystemTap testsuite, it becomes very easy to collect data on all of the examples by running the following in a terminal window:
$ stap stap_time > syscall_any.dat
Then, in another terminal window, in /usr/share/systemtap/testsuite, run the following as root:
make installcheck RUNTESTFLAGS="--debug systemtap.examples/check.exp"
Once testsuite completes, the syscall_any.dat file contains data about how long each of the phases of the example scripts took to complete. A Gnuplot can be made of that data with the following syscall_any.gp:
set terminal png

set output 'syscall_any.png'
set key left top invert

set title 'Systemtap Examples Times with syscall\_any tapset'
set grid y
set style data histograms
set style histogram rowstacked
set ytics 10 nomirror
set style fill solid 1
set ylabel "Time (ms)"
set ytics 10000
set xlabel "Example script"
set xrange [0:]
set yrange [0:]

plot 'syscall_any.dat' using 2 t "Pass 0 (cmdline parsing)", '' using 3 t "Pass 1 (script parsing)", '' using 4 t "Pass 2 (elaboration)", '' using 5 t "Pass 3 (code generation)", '' using 6 t "Pass 4 (module compilation)",
Now we have a bar graph that summarizes how long SystemTap took to convert the various example scripts into actual instrumentation. The graph looks like the following:
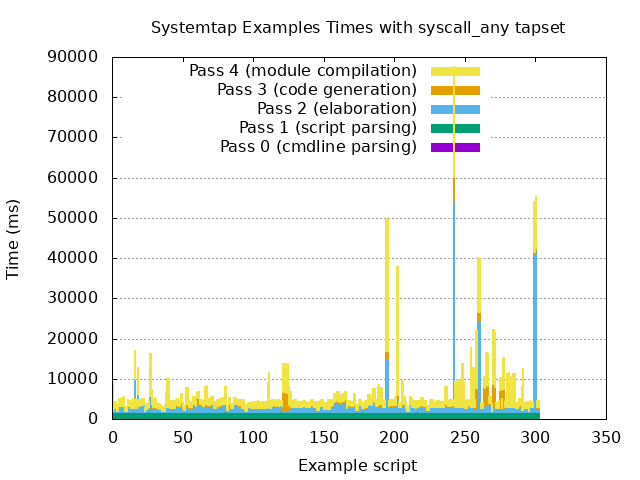
The first thing that stands out is the peak at 243 (strace.stp) is approaching 90 seconds of overhead to start. The strace.stp script instruments every syscall entry and exit, resulting in a large number of probes and associated code for those probes. The peak at 195–196 for errsnoop.stp also has the same cause.
The peak at 203 is due to ltrace.stp instrumenting many functions in the shared libraries used by the monitored user-space application. This creates instrumentation for 545 probe points.
The peaks toward the right of the graph at 300 and 301 are for qemu_count.stp and are caused by using SystemTap wildcards to instrument all the QEMU probe points. On the x86_64 RHEL machine that the measurements were being made on, there were over 10,000 probe points being instrumented because of QEMU emulation for many different processors installed on the machine, such as SPARC, MIPS, and PowerPC processors.
The peaks at 122 to 125 for hw_watch_addr.stp and hw_watch_sym.stp and at 264 to 267 for ioctl_handler.stp and latencytap.stp are unusual, as they spent more time in code generation (pass3) than most scripts. This is because these scripts are being generated with the SystemTap --all-modules option, which pulls more debugging information into the instrumentation to allow the script to map addresses for modules back to function names.
Reducing startup costs
Reducing the startup overhead for the example scripts is a work in progress, but there have been some improvements over the past month for several of the scripts that instrument each syscall. The syscall_any and syscall_any.return probe points are available in the newly released SystemTap 4.0, which will be discussed in an upcoming Red Hat Developer article.
Below is a graph of the example script times with the patches implementing syscall_any removed. There are peaks in the graph below at 17 (eventcount.stp), 40 (stopwatches.stp), 111 (syscallbypid-nd.stp), 250 (thread-business.stp), 255 (container_check.stp), and 256 (errno.stp) that are not in the graph above, which used the syscall_any tapset.

This simple graphing of the example script startup times gives us a quick indication of the overhead for the various example scripts and some visual clues of what phases of the instrumentation generation are more costly.
Additional resources
See my other articles on Red Hat Developers:
- Making the Operation of Code More Transparent and Obvious with SystemTap
- Use the dynamic tracing tools, Luke
- Find what capabilities an application requires to successfully run in a container
- How to avoid wasting megabytes of memory a few bytes at a time
- Instruction-level Multithreading to improve processor utilization
- “Don’t cross the streams”: Thread safety and memory accesses at the speed of light
Red Hat Developer has many other articles on SystemTap and performance.
Last updated: October 25, 2021