Cloud based technology offers the ability to build, deploy and scale applications with ease; however, deploying to the cloud is only half of the battle. How cloud applications are monitored becomes a paramount concern with operations teams.
When issues arise, teams and their monitoring systems must be able to detect, react, and rectify the situation. CPU, system memory, and disk space are three common indicators used to monitor applications, and are typically reported by the operating system.
However, for Java applications - which we'll be focusing on in this article - most solutions tap into JMX (Java Monitoring eXtensions) to monitor the Java Virtual Machine (JVM). For applications leveraging Java xPaaS middleware services on OpenShift, they have built-in functionality to provide the capabilities to monitor and manage their operation.
Communicating with applications
Communication with applications - or in the case of xPaaS, an application server - is typically performed using JMX technology, and is generally accomplished using RMI (Remote Method Invocation). RMI technology is not well suited for cloud based technologies, neither is it suited for microservices architectures that focus on lightweight communication over HTTP; therefore, OpenShift xPaaS applications expose JMX operations through an HTTP bridge provided by the Jolokia project, where simple REST based methods and JSON based payloads provide a simplified and lightweight approach to remote application monitoring and management.
The Jolokia package is embedded within each xPaaS Docker image as a JVM agent for instrumenting the running application server. Clients can communicate with the agent using port 8778, which is exposed by default from the docker image, and can be seen by inspecting the JBoss EAP xPaaS image using the following command:
docker inspect registry.access.redhat.com/jboss-eap-6/eap64-openshift
In the response, the list of exposed ports can be seen as shown below:
...
 "ExposedPorts": {
   "8080/tcp": {},
   "8443/tcp": {},
   "8778/tcp": {}
 },
...
In order to provide load balanced communication between multiple containers on OpenShift, exposed ports are typically mapped as service entries and can be further exposed through a route to provide access outside of the cluster. Most templates used with JBoss EAP only expose ports 8080 and 8443 as services to serve HTTP/HTTPS traffic.
Since Jolokia provides a method to manage and monitor a single JVM, it would be impractical to load balance across multiple containers with the goal of targeting a single instance, and without a service and a corresponding route it would typically be impossible to access a resource that is only exposed to the internal pod network.
OpenShift, however, provides the ability to proxy through the API server in order to access a pod inside the cluster (via underlying Kubernetes). The API server is the lifeblood of OpenShift. Everything - from nodes bringing themselves into the desired state to conform to etcd, to clients communicating with either the web console, or the command line tool - leverages the API server via RESTful invocations.
Using this same method, access to (typically non-exposed) internal resources can be obtained through application routes. The following diagram demonstrates the paths and components involved with proxying traffic to the pod network through the API server:
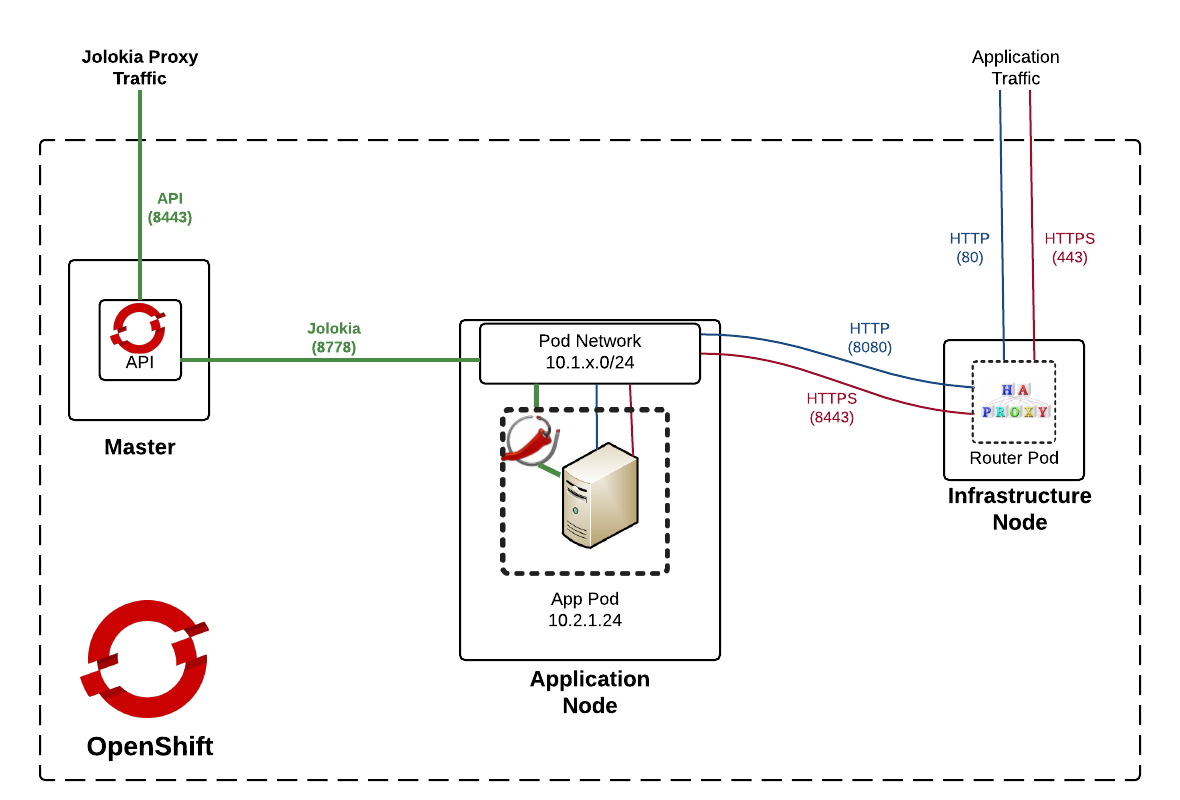
As the diagram depicts (on the left hand side), traffic signified as Jolokia Proxy Traffic path will be the focus of the upcoming discussion.
The right hand side of the diagram on the other hand, is the typical flow for application traffic - destined for externally exposed HTTP/HTTPS pod resources. This traffic is initially served by an integrated HAProxy router listening on ports 80 and 443. A service lookup is performed to determine an available endpoint on the pod network signifying a listening application container. The request is then finally routed to the address and port on the pod network. The majority of the application transport process is abstracted from the end user.
For traffic destined for Jolokia via the API proxy (left hand side), the flow begins by initiating a request to the OpenShift API on the master instance using port 8443. Based on input parameters, the request sent from the API to the pod network and ultimately to the destination pod and port. Let’s walk through each of these approaches.
Spinning up an example on OpenShift
To demonstrate accessing resources through the application traffic path and then finally using the API proxy path (as depicted in the diagram above), we'll implement the following via a provided application example template:
- A deployment of the JBoss Ticket Monster application
- A JBoss EAP 6.4 image for the running container
- A Jolokia configuration
The following two OpenShift CLI commands can be executed to spin up this environment:
oc new-project jolokia
oc new-app --template=eap64-basic-s2i -p=APPLICATION_NAME=ticketmonster,SOURCE_REPOSITORY_URL=https://github.com/jboss-developer/ticket-monster,SOURCE_REPOSITORY_REF=2.7.0.Final,CONTEXT_DIR=demo
The template automatically creates the necessary objects in OpenShift, triggers an application build, and deploys the resulting image. Also included is the creation of a route for application traffic from resources outside the OpenShift cluster. This can all be validated by logging into the OpenShift web console at https://master_host:8443 and select the Jolokia project.
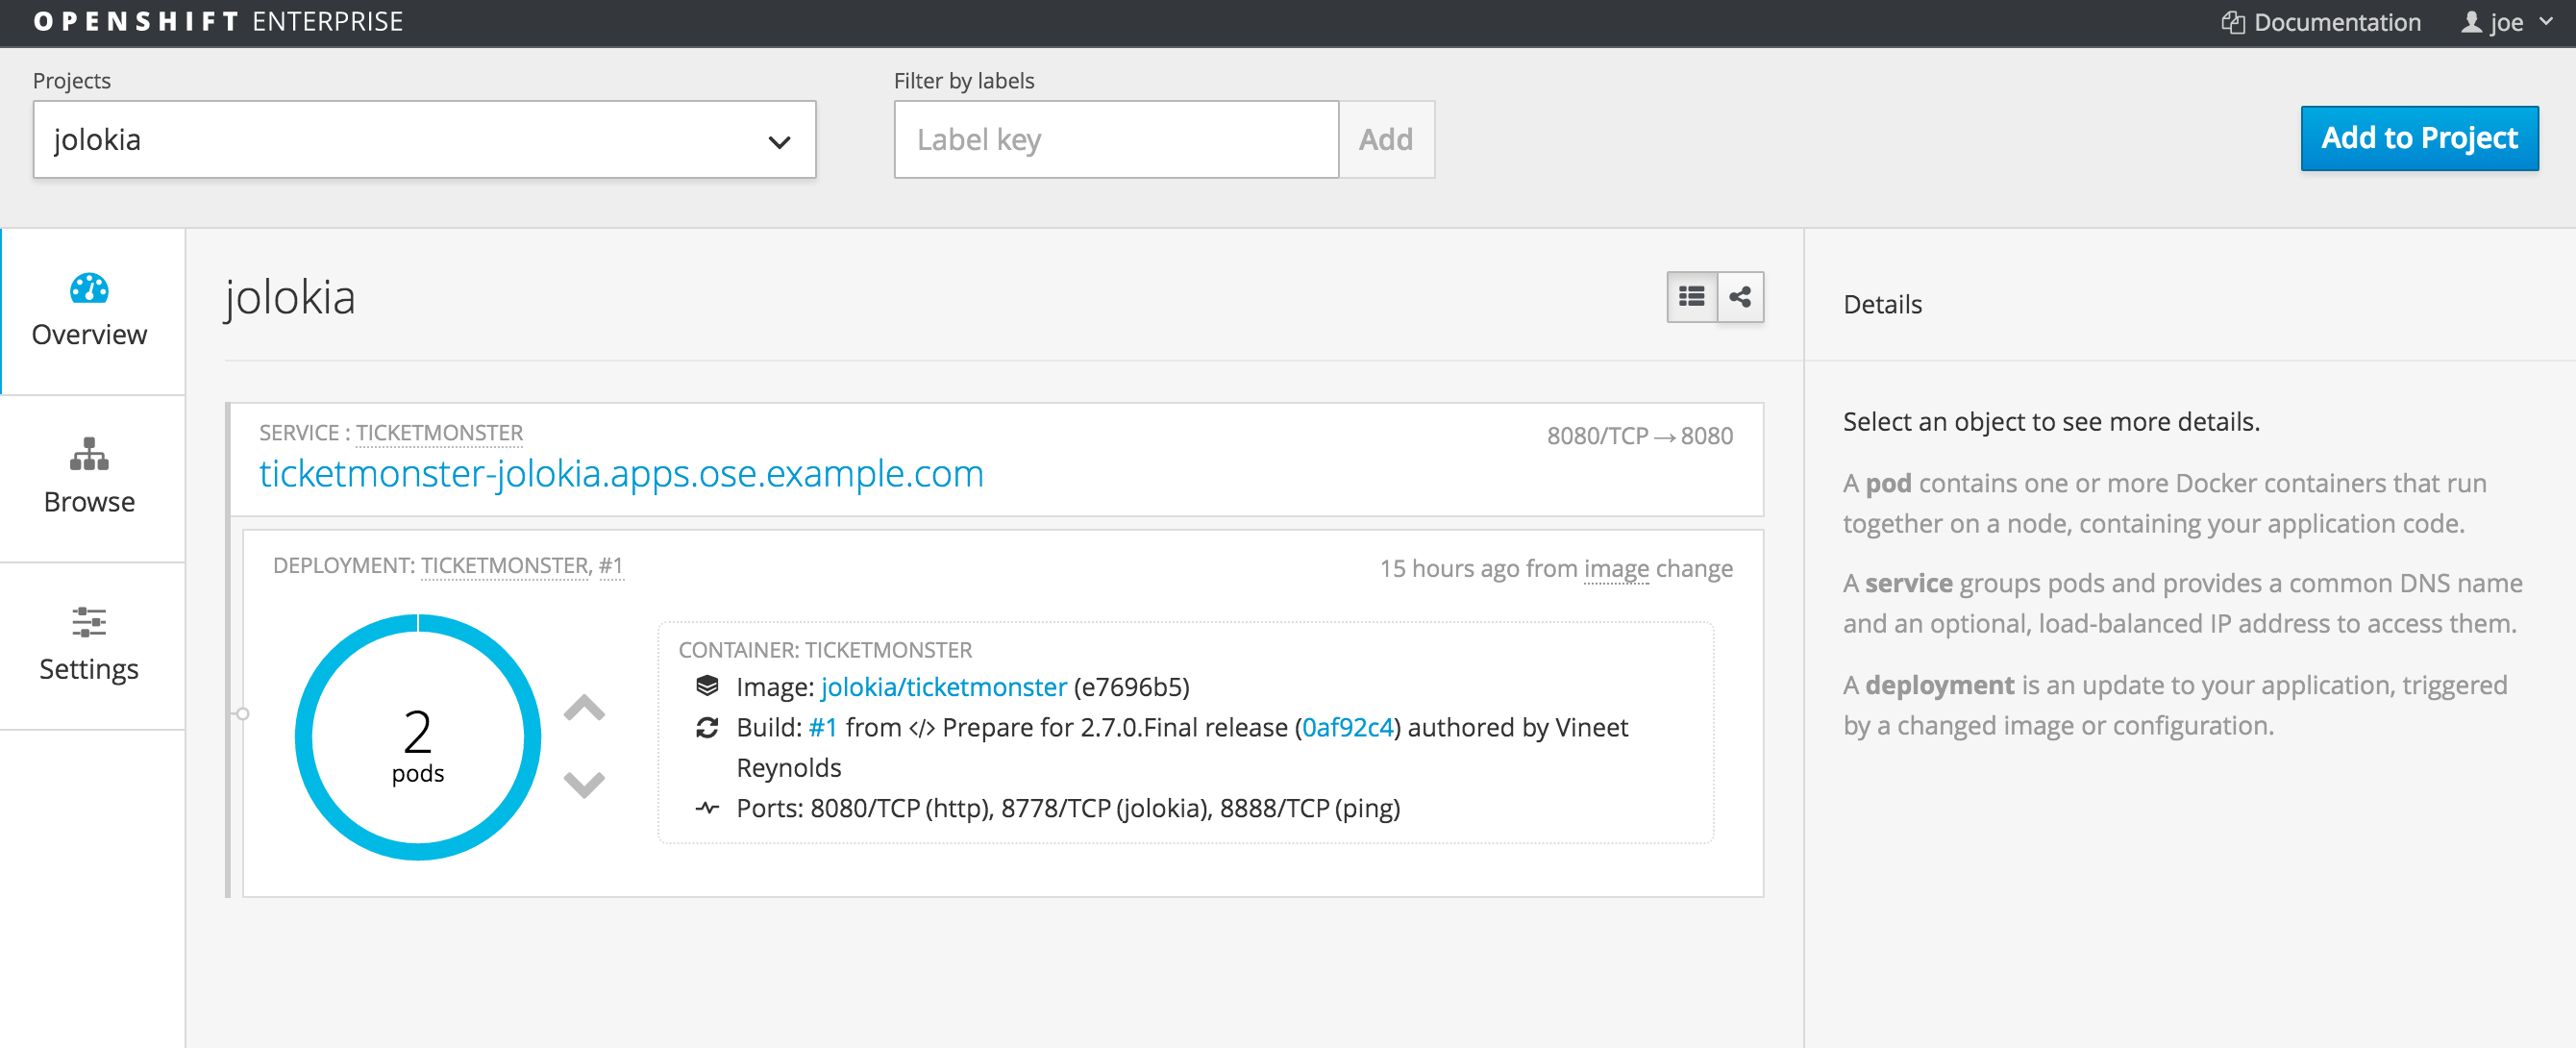
OpenShift automatically generates a "master host" name based on application name, project name and default subdomain - this can be seen at the top of the page. Select the URL to open the Ticket Monster application in the browser; a successful response validates the application traffic path.
With the application traffic path functional, focus can be shifted toward the true goal of obtaining information about the JVM resources from Jolokia through the API proxy.
The first step is to target the OpenShift REST API that is exposed on the master OpenShift instance at http://master_host:8443/api. The next step is to determine and obtain the necessary parameters required by the proxy resource including the following:
- Project (namespace) name
- Pod name
- Port exposed on the pod
- Whether communication will be facilitated over https
Fortunately, these can be determined easily given the deployed application:
- The application is deployed in the project named "jolokia".
- To obtain the name of the running pod containing the application, run the `oc get pods` OpenShift CLI command (Example result: ticketmonster-1-op5j0)
- As discussed previously, Jolokia exposes port 8778 for Java xPaaS images.
- Finally, Jolokia does utilize https communication, but the implementation is abstracted from the end user as it is only applicable for communication between API proxy and Jolokia. The end user needs to be concerned only with communicating to the API.
For pod based API proxy requests, they take on the following URL format:
https://<master_host>:8443/api/v1/namespaces/<project_name>/pods/<secure_scheme>:<pod_name>:<pod_port>/proxy
So for an application running in a pod called ticketmonster-1-op5j0 in the jolokia project, the URL to communicate with the Jolokia port would be formatted as:
https://<master_host>:8443/api/v1/namespaces/jolokia/pods/https:ticketmonster-1-op5j0:8778/proxy
This URL provides access to the resources listening on the port in the pod. However, Jolokia exposes itself on the /jolokia context path, so it would need to be added to the end of the URL as shown below:
https://<master_host>:8443/api/v1/namespaces/<project_name>/pods/https:<pod_name>:8778/proxy/jolokia
The final step that is needed prior to invoking the API is to add the OAuth token for authentication. It can be obtained from the OpenShift CLI by running the <em>oc whoami –t command.
Now combine each of the data points into the following request:
curl -k -H "Authorization: Bearer <api_token>" https://<master_host>:8443/api/v1/namespaces/<projcet_name>/pods/https:<pod_name>:8778/proxy/jolokia/
Note: The –k flag is passed into the curl command as this specific OpenShift environment is using self signed certificates.
The request results in the following response:
{"request":{"type":"version"},"value":{"agent":"1.3.2","protocol":"7.2","config":{"maxDepth":"15","discoveryEnabled":"false","maxCollectionSize":"0","agentId":"10.1.0.8-154-5cad8086-jvm","debug":"false","agentType":"jvm","historyMaxEntries":"10","agentContext":"\/jolokia","maxObjects":"0","debugMaxEntries":"100"},"info":{"product":"jboss","vendor":"RedHat","version":"7.5.4.Final-redhat-4"}},"timestamp":1458702143,"status":200}
To access useful JVM metrics, such as the amount of memory usage, the following URL can be used.
curl -k -H "Authorization: Bearer <api_token>" https://<master_host>:8443/api/v1/namespaces/<project_name>/pods/https:<pod_name>:8778/proxy/jolokia/read/java.lang:type=Memory/HeapMemoryUsage
Which results in the following response:
{"request":{"mbean":"java.lang:type=Memory","attribute":"HeapMemoryUsage","type":"read"},"value":{"init":1367343104,"committed":1364721664,"max":1364721664,"used":167167296},"timestamp":1458703005,"status":200}
The full set of requests and responses that can be sent to Jolokia can be found in the Jolokia product documentation.
JVM Monitoring in Action
Given the ability to instantly access JVM metrics from running containers within OpenShift, the floodgates of opportunity are open to all the ways this data can be used. Everything from monitoring and reporting to alerting is on the table.
While it has been demonstrated that resources from Jolokia can be queried, a visual example always provides substance for these types of concepts. An html/javascript application has been developed to provide a demonstration of querying and displaying metrics obtained from Jolokia exposed containers running on OpenShift.
The code for the application is found on GitHub and can be cloned to a local machine by running the following command:
git clone https://github.com/sabre1041/ose-jolokia-demo
Communication in the demo between the client and the OpenShift API is facilitated using a combination of jQuery and the Jolokia JavaScript client. Since the application is running locally and not hosted on the same instance as the API, Cross-Origin Resource Sharing (CORS) will come into play and deny requests by default. OpenShift can be configured to effectively disable the restrictions imposed by CORS. To disable CORS restrictions, edit the OpenShift master configuration file located at /etc/origin/master/master-config.yaml. You'll need to add <strong>- .* in new line under the corsAllowedOrigins section as follows:
corsAllowedOrigins:
- 10.0.2.15:8443
- 127.0.0.1
- localhost
- .*
Once you've updatead the file, you'll need to restart the OpenShift master:
systemctl restart atomic-openshift-master
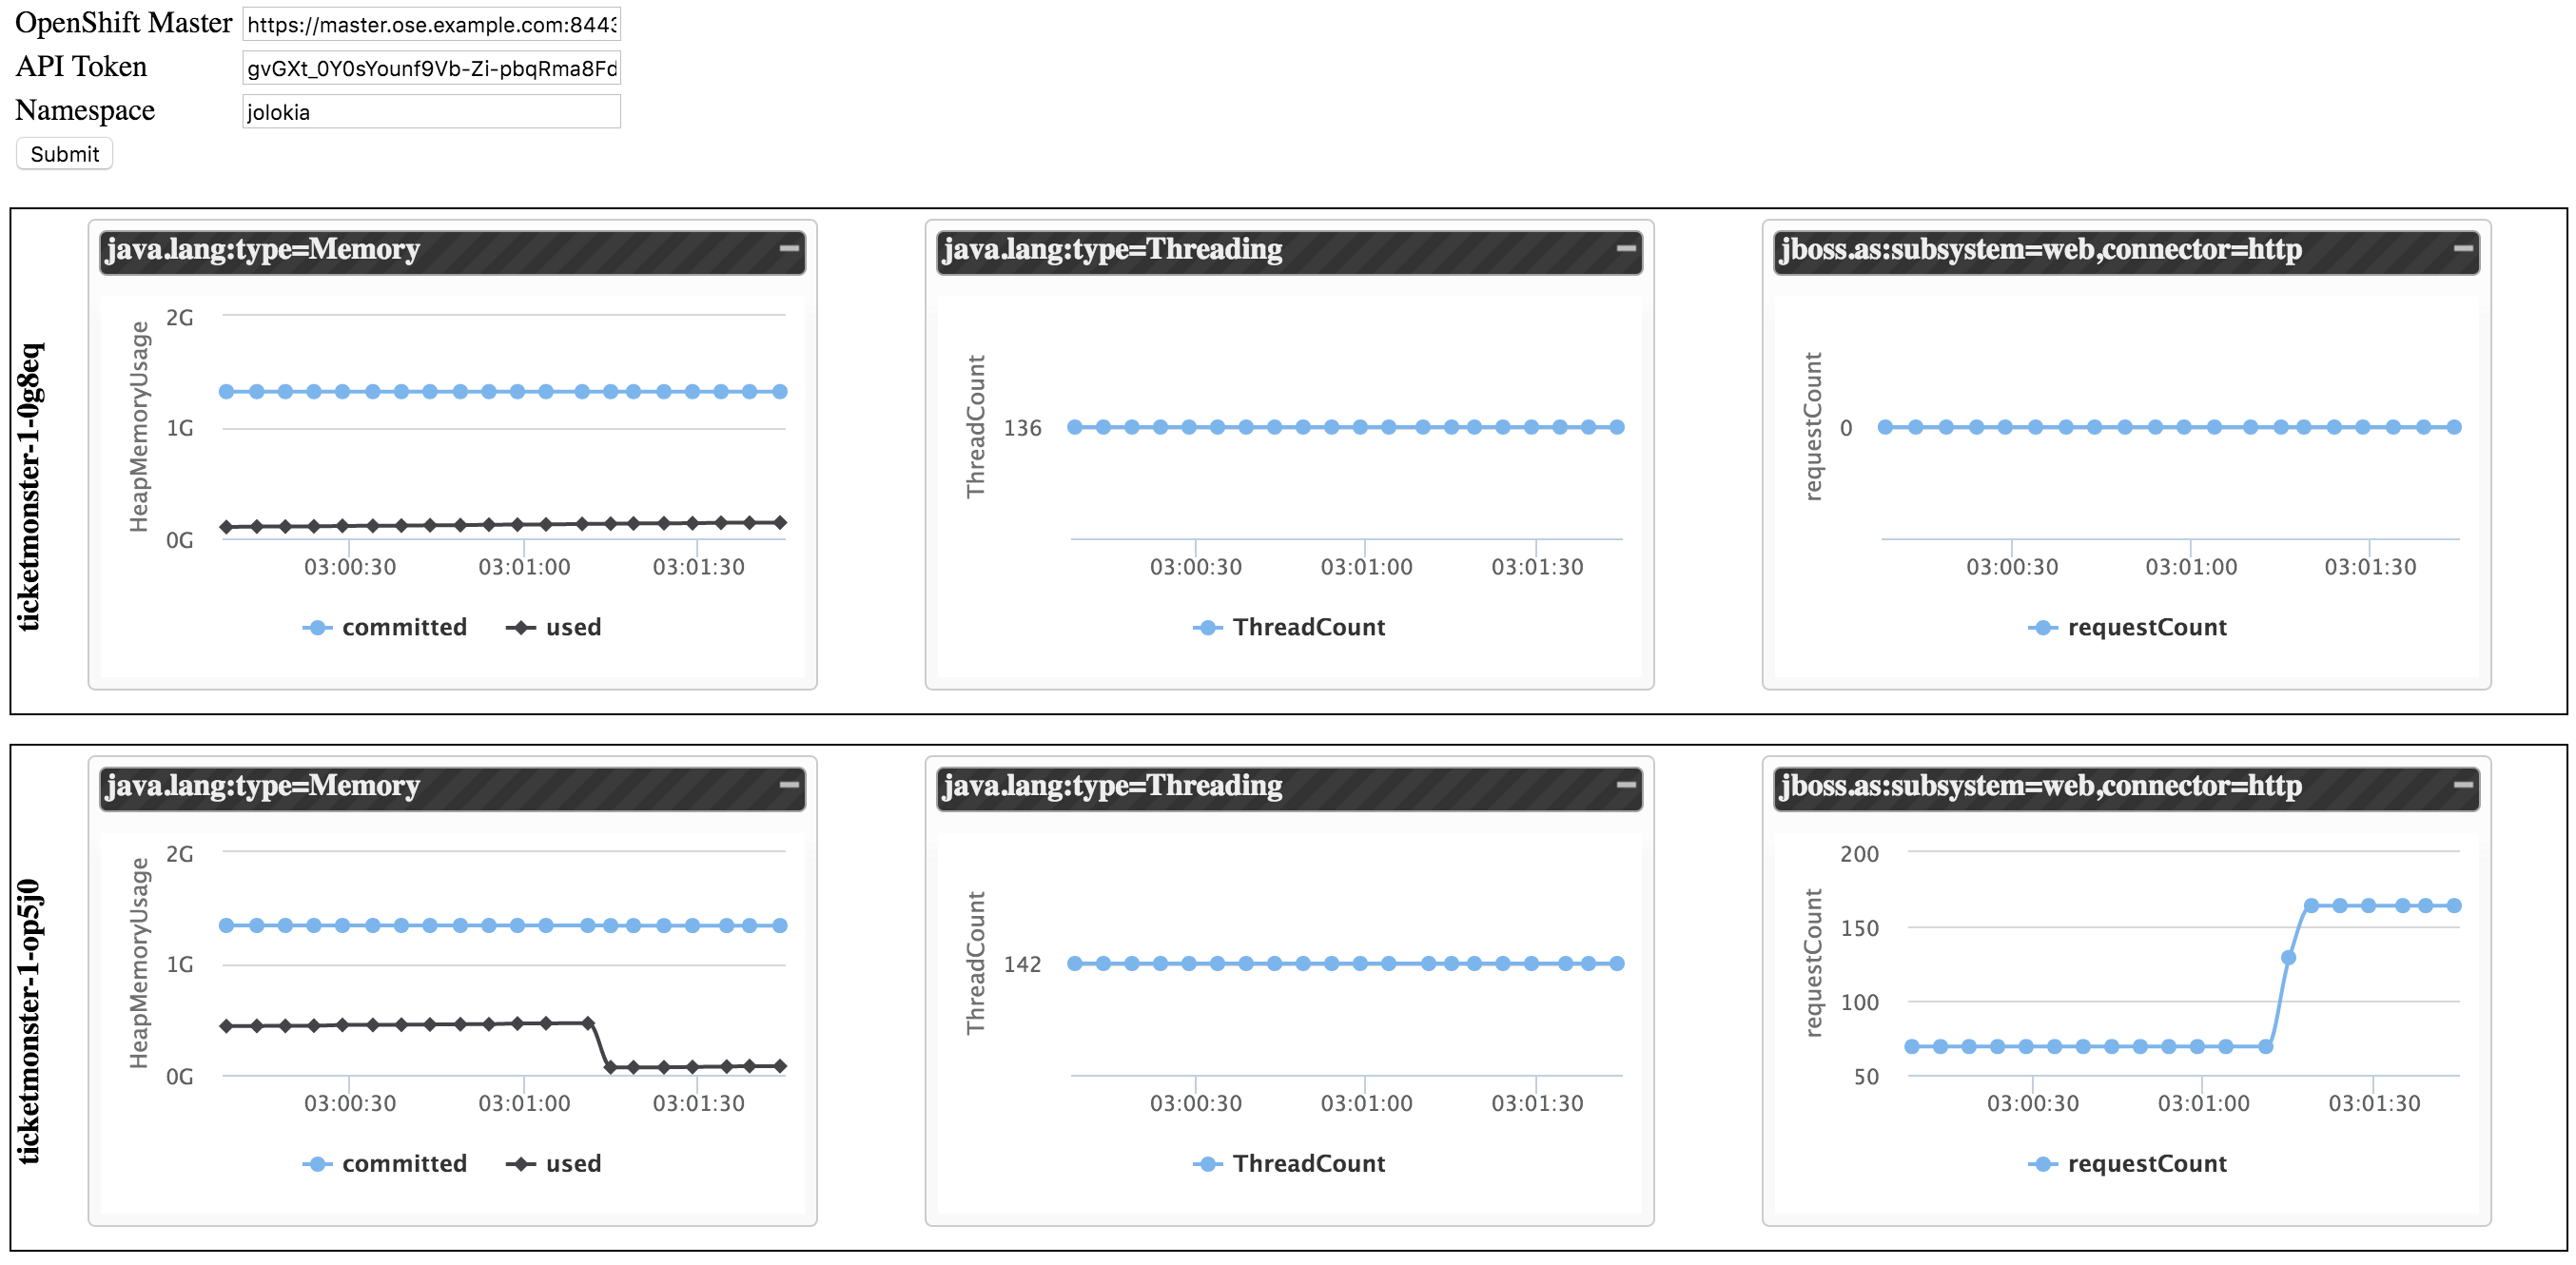
Now that OpenShift is properly configured, navigate to the location containing the cloned project resources. In this directory, locate and open the index.html file (in a web browser). This file contains the application, which will attempt to communicate with all pods in a given project that expose Jolokia resources. Based on the located resources, it will display graphs of the current memory consumption, thread count, and HTTP web requests.
On the webpage, three textboxes are presented:
- The location of the OpenShift API
- The token used to communicate with the API
- The namespace (project) to search for resources.
Using the material previously retrieved, enter the information into the input textboxes and press submit. Data will be returned from the pods on a 5 second interval to populate the graphs.

In a separate browser tab or window, navigate once again to the ticketmonster application. Hit the refresh or the F5 key to simulate several requests. Return to the demo application to visualize the increase in the number of requests received.
Conclusion
By being able to query JVM metrics from running Java applications in OpenShift, doors are opened to the potential ways that applications can be monitored and managed in a cloud environment.
As we've seen in this article, Jolokia is a JMX-HTTP bridge giving an alternative to JSR-160 connectors, and it is useful for exposing JVM monitoring APIs via non-traditional protocols.
Last updated: June 22, 2023
