Recently I was asked to look into an issue related to QEMU's I/O subsystem performance - specifically, I was looking for differences in performance between glibc's malloc and other malloc implementations'. After a good deal of benchmarking I was unable to see a clear difference between our malloc (glibc) and others, not because the implementations were similar, but because there was too much noise in the system; the benchmarks were being polluted by other things, not just in QEMU, but elsewhere in the operating system. I really just wanted to see how much time malloc was using, but it was a small signal in a large noisy system.
To get to the results I needed, I had to isolate malloc's activity so I could measure it more accurately. In this blog, I'll document how I extracted the malloc workload, and how to isolate that workload from other system activity so it can be measured more effectively.
(Note, of course, that benchmarks are statistical things, and not all of the methods that worked for me may show statistically significant results for you. YMMV - "your metrics may vary" - but I am hopeful these techniques will prove useful in your own scenario.)
Step One - ltrace
The first step was to analyze the target workload to see what it was doing. If you're benchmarking your own function, you can add 'printf()' statements or other trace functionality to record every call, but in this case - benchmarking a system library - we don't have that option.
(Ok, it's open source, we have that option, but it's not practical).
The ltrace utility is designed to capture calls to system libraries, so it's a good fit for our situation. The syntax we'll use lets us connect to a running process, and store the output to a file. You'll need your process ID (pid) and the name of a file (filename) in which to place the ltrace output:
ltrace -p <pid> -f -o <filename> -e malloc+free
If we run QEMU in one window, and this command in another window, we can start ltrace right before starting the test case within QEMU, then CTRL-C'ing ltrace once the test case is done in order to capture only the relevant data. Your output should look something like this:
15671 exe->malloc(144)                    = 0x7fa9f6e82eb0 <0.000356>
15671 exe->malloc(128)                    = 0x7fa9f1513580 <0.000318>
15662 exe->malloc(40)                     = 0x7fa9f2338f90 <0.000365>
15662 exe->free(0x7fa9f79e0000)           = <void> <0.000366>
15662 exe->free(0x7fa9f6c3d100)           = <void> <0.000363>
The actual results are not relevant to this blog, but I observed that malloc was called many times with only a few different sizes requested, so if I benchmarked calls of those sizes I'd get a general idea of how our malloc compares to others. A simple sed/awk/grep/sort/uniq/pr script (ok, not so simple) gives us a histogram of malloc calls. Alternatively, you can just read the logs and interpret them yourself. ;)
Step 2 - The Microbenchmark
If you want to time something that takes minutes, you can use a stopwatch. If it only takes seconds, gettimeofday() is sufficient; however, a single call to malloc might only take microseconds or even nanoseconds.
Despite the wide range of system performance tools available, we'll choose an old simple solution - ReaD Time Stamp Counter (RDTSC) - which tells us how many CPU clock cycles (or the equivalent) have passed. Since we're comparing malloc implementations, a relative time is sufficient and we don't need to know (or even worry about) converting clock cycles to microseconds. The RDTSC instruction is cpu-dependent, but it's available on the one I'm using (x86-64) and is typically used like this:
static __inline__ int64_t rdtsc(void)
{
  unsigned a, d;
  asm volatile("rdtsc" : "=a" (a), "=d" (d));
  return ((unsigned long)a) | (((unsigned long)d) << 32);
}

. . .

int64_t clocks_before, clocks_after, clocks_per_malloc;

clocks_before = rdtsc ();
p = malloc (i); /* Test goes here */
clocks_after = rdtsc ();
clocks_per_malloc = clocks_after - clocks_before;
Now we just run that code a few thousand times and we should get some nice clean results, and since there are only a small number of paths that the code can follow through malloc we should see only a few different times reported... or not?
A graph of how long two malloc() implementations take for the same workload, sorted by duration, showing percentile of malloc calls and average time for that percentile.
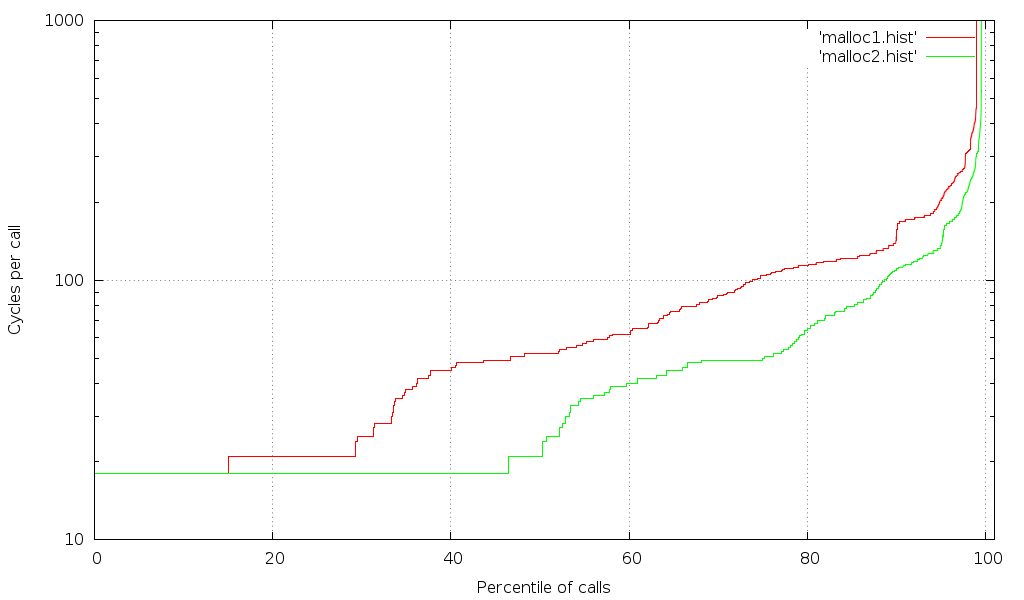
One drawback of the RDTSC instruction is that the CPU is allowed to reorder it relative to other instructions, which causes noise in our results. Fortunately, Intel has provided an RDTSCP instruction that's more deterministic. We'll pair that with a CPUID instruction which acts as a memory barrier, resulting in this:
static __inline__ int64_t rdtsc_s(void)
{
  unsigned a, d;
  asm volatile("cpuid" ::: "%rax", "%rbx", "%rcx", "%rdx");
  asm volatile("rdtsc" : "=a" (a), "=d" (d));
  return ((unsigned long)a) | (((unsigned long)d) << 32);
}

static __inline__ int64_t rdtsc_e(void)
{
  unsigned a, d;
  asm volatile("rdtscp" : "=a" (a), "=d" (d));
  asm volatile("cpuid" ::: "%rax", "%rbx", "%rcx", "%rdx");
  return ((unsigned long)a) | (((unsigned long)d) << 32);
}

. . .

clocks_before = rdtsc_s ();
p = malloc (i); /* Test goes here */
clocks_after = rdtsc_e ();
clocks_per_malloc = clocks_after - clocks_before;
Results after switching to cpuid/rdtsc barriers
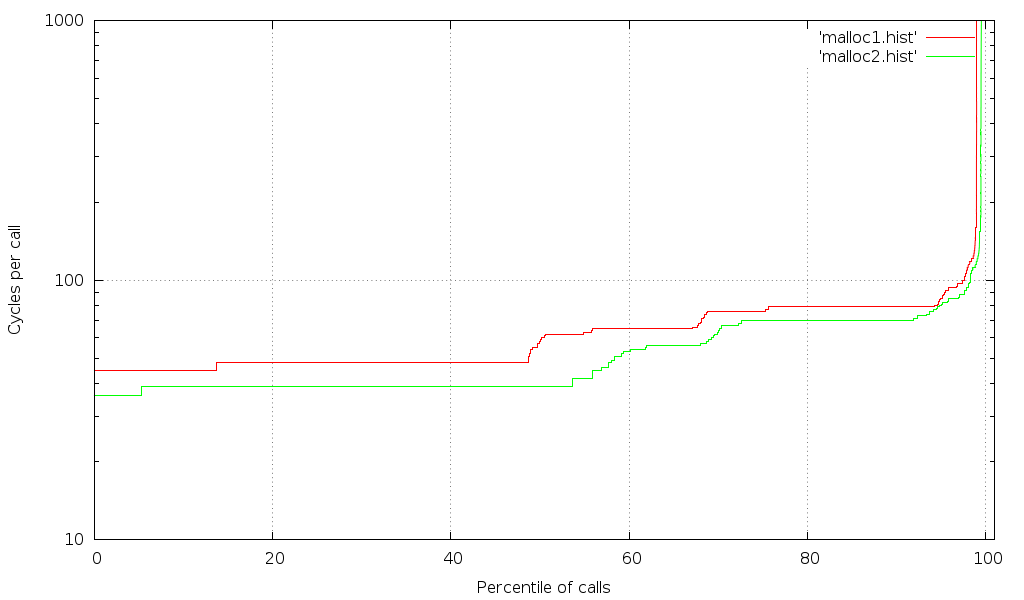
This is much better. Still, given that malloc is a relatively small function, you'd expect a discrete number of elapsed times, but the graph shows a much wider range of times (one for each possible code path - not counting the cases where the kernel is called and the graph goes off the chart on the upper right). Even among the "fast" calls there are smooth transitions. Clearly, other things are interfering with our measurement. There is still hope, however, because we can use the kernel's scheduling API to reduce interference.
Since the test case itself is multi-threaded, the first thing we need to do is make sure each thread is assigned to a specific CPU to avoid our test interfering with itself. We can read /proc/cpuinfo to see how many CPUs exist, and use sched to assign each thread to its own CPU:
cpu_set_t my_cpu;
/* Skip CPU0 - let the OS run on that one */
int my_cpu_num = (tid % (num_cpus-1))+1;

CPU_ZERO (&my_cpu);
CPU_SET (my_cpu_num, &my_cpu);
if (sched_setaffinity (0, sizeof(my_cpu), &my_cpu) == -1)
  perror ("setaffinity failed");
Next we need to make sure the kernel doesn't schedule anything else to the CPUs we're using, and there happens to be a kernel command line option to "isolate" CPUs from the system so that other, outside tasks won't get scheduled to them. We have 8 CPUs, and as the comment above notes, we let the OS use CPU #0. It's time to reboot and add this to the boot-loader kernel command line:
linux . . . isolcpus=1,2,3,4,5,6,7
Go ahead and boot using this additional configuration, and once the system is back up and running, you can confirm which CPUs are in use via the taskset command. You can check the PID of your shell, for example. Notice the "affinity mask" will be set when isolcpus is enabled:
[without isolcpus]
$ taskset -p $$
pid 26993's current affinity mask: ff
[with isolcpus]
$ taskset -p $$
pid 26993's current affinity mask: 01
What else could be interrupting our tests? Interrupts! They're not tasks and are not governed by the task scheduler. Interrupt affinity is controlled separately, by /proc/irq/*/smp_affinity. If you look at those files, you'll see a mask similar to what taskset uses, and most of them are still ff despite using CPU isolation. You can assign interrupts to CPU0 like this (it will probably take several tries to get them all):
cd /proc/irq
for i in */smp_affinity; do echo 1 > $i; done
You probably don't want to run your machine like this for long, as it's effectively a single-core machine; however, the results are now almost as clean as we can get them:
Results after isolating the tests
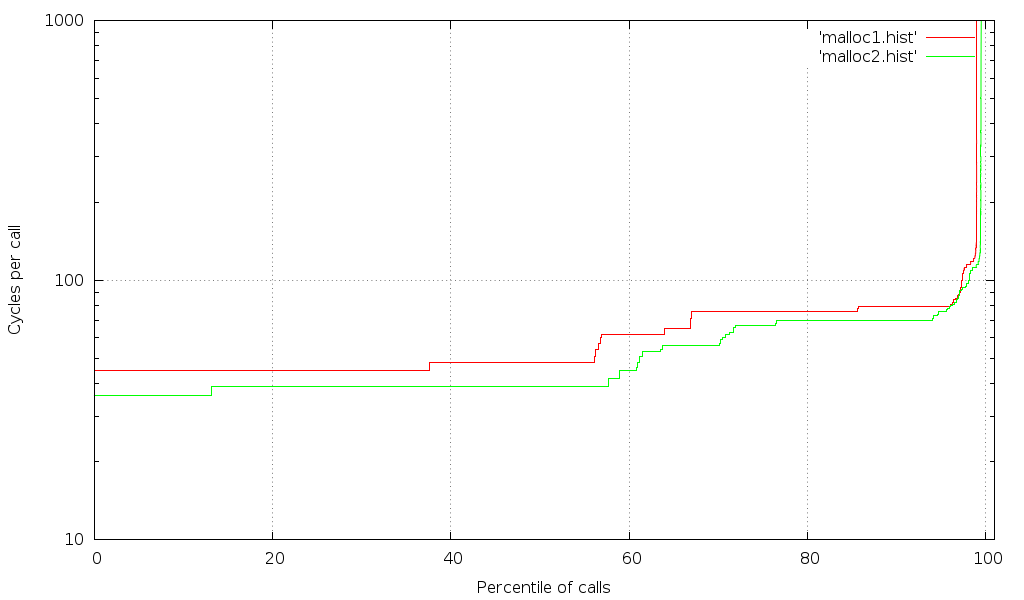
Note that a larger percentile of the calls show the shortest time (i.e. transitions have shifted right), and the transition to calls taking more cycles is sharper. This indicates that fewer of the fast calls are getting interrupted by scheduling or hardware issues.
This is starting to look pretty good, but there's one more thing we can do to clean it up more. If you happen to have access to a machine with a lot of CPU cores and RAM, you'll discover that there's still room for improvement (could be tasks that can't be moved off the relevant CPUs, or hardware contention). An example of those results can be seen below:
Results on a many-cpu machine

(For the record, no, I can't afford a machine like that :-)
Conclusion
In summary, you can see a huge difference between the first and last graph, but that improvement is based on many steps, and there's still some room for improvement (an Intel paper uses a kernel module to isolate their tests even further, but that's beyond the scope of what I need to test). As we run more benchmarks and clean up the results, we learn more about what we're benchmarking. We learn what "noise" needs to be removed (like we've done above) and what "noise" is actually part of the result we're looking for.
For now, this is good enough for my purposes. Look forward to a blog post about changes in malloc!
1How to Benchmark Code Execution Times on Intel® IA-32 and IA-64 Instruction Set Architectures, Gabriele Paoloni, Linux Kernel/Embedded Software Engineer, Intel Corporation, September 2010
Last updated: March 16, 2018