Redhat Developers  Logo
  • Products

    Platforms

    • Red Hat Enterprise Linux
      Red Hat Enterprise Linux Icon
    • Red Hat AI
      Red Hat AI
    • Red Hat OpenShift
      Openshift icon
    • Red Hat Ansible Automation Platform
      Ansible icon
    • See all Red Hat products

    Featured

    • Red Hat build of OpenJDK
    • Red Hat Developer Hub
    • Red Hat JBoss Enterprise Application Platform
    • Red Hat OpenShift Dev Spaces
    • Red Hat OpenShift Local
    • Red Hat Developer Sandbox

      Try Red Hat products and technologies without setup or configuration fees for 30 days with this shared Red Hat OpenShift and Kubernetes cluster.
    • Try at no cost
  • Technologies

    Featured

    • AI/ML
      AI/ML Icon
    • Linux
      Linux Icon
    • Kubernetes
      Cloud icon
    • Automation
      Automation Icon showing arrows moving in a circle around a gear
    • See all technologies
    • Programming languages & frameworks

      • Java
      • Python
      • JavaScript
    • System design & architecture

      • Red Hat architecture and design patterns
      • Microservices
      • Event-Driven Architecture
      • Databases
    • Developer experience

      • Productivity
      • Tools
      • GitOps
    • Automated data processing

      • AI/ML
      • Data science
      • Apache Kafka on Kubernetes
    • Platform engineering

      • DevOps
      • DevSecOps
      • Red Hat Ansible Automation Platform for applications and services
    • Secure development & architectures

      • Security
      • Secure coding
  • Learn

    Featured

    • Kubernetes & cloud native
      Openshift icon
    • Linux
      Rhel icon
    • Automation
      Ansible cloud icon
    • AI/ML
      AI/ML Icon
    • See all learning resources

    E-books

    • GitOps cookbook
    • Podman in action
    • Kubernetes operators
    • The path to GitOps
    • See all e-books

    Cheat sheets

    • Linux commands
    • Bash commands
    • Git
    • systemd commands
    • See all cheat sheets

    Documentation

    • Product documentation
    • API catalog
    • Legacy documentation
  • Developer Sandbox

    Developer Sandbox

    • Access Red Hat’s products and technologies without setup or configuration, and start developing quicker than ever before with our new, no-cost sandbox environments.
    • Explore the Developer Sandbox

    Featured Developer Sandbox activities

    • Get started with your Developer Sandbox
    • OpenShift virtualization and application modernization using the Developer Sandbox
    • Explore all Developer Sandbox activities

    Ready to start developing apps?

    • Try at no cost
  • Blog
  • Events
  • Videos

Monitoring OpenStack and OpenShift together

The path to unified observability

January 22, 2026
Victoria Martinez de la Cruz Simon Herlofsson
Related topics:
KubernetesObservabilityOperators
Related products:
Red Hat OpenShift

    Observability is more than just reactive monitoring of failing systems; it's a culture of understanding your application and platform environment. It's about making informed, data-driven decisions to build a stable and reliable foundation for your business. In any high-performing organization, observability should be at the core of its operations. The latest Red Hat OpenStack Services on OpenShift release leverages the reliability, security, and velocity of Red Hat OpenShift to address one of the major pain points of OpenStack: day-2 operations. This article introduces the Telemetry Operator, a tool for customizing observability in OpenStack Services on OpenShift.

    Unified observability

    This new foundation presents an opportunity to rethink our observability offering and build a better experience. As a first step, we are tailoring OpenShift monitoring capabilities through the Telemetry Operator to begin presenting data in unified observability dashboards (Figure 1). Our goal is to continue this effort with other tools and telemetry, providing a single, comprehensive view of your entire environment.

    We will explore how to configure these features with a special focus on the metrics you can collect. We will also explore other capabilities like logging and autoscaling in upcoming blogs.
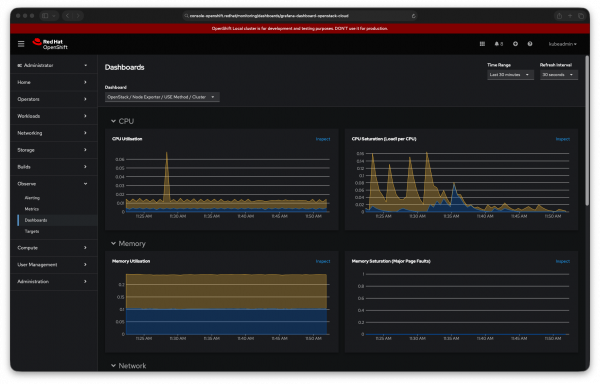
    The OpenShift console dashboard shows OpenStack Services on OpenShift cluster data.
    Figure 1: Unified observability shows OpenStack Services on OpenShift cluster data in the OpenShift console.

    Monitoring OpenStack services with the Telemetry Operator

    The OpenStack Operator automatically installs and enables the Telemetry Operator. You configure it when deploying the OpenStack Control Plane (see a sample configuration in Chapter 4. Creating the control plane | Deploying Red Hat OpenStack Services on OpenShift).

    While the Telemetry Operator offers features like alerts, logging, autoscaling, and power monitoring, it only enables metrics collection by default. This default configuration gathers three types of metrics:

    • OpenStack infrastructure metrics leveraging kube-state-metrics (OpenStack Services on OpenShift services running on OCP metrics).
    • OpenStack control plane metrics  through OpenStack Ceilometer (OpenStack services metrics), mysqld-exporter (control plane database metrics) and RabbitMQ (control plane shared queue metrics).
    • OpenStack data plane metrics with the use of node exporter (individual node system metrics), KEPLER (power monitoring metrics), openstack-network-exporter (OVS networking metrics) and Podman exporter (containers in the dataplane metrics).

    Some of these metrics are opt-in. Database metrics via mysqld-exporter are opt-in. Power monitoring via KEPLER is opt-in and currently in Technology Preview.

    Telemetry operator metrics

    The easiest way to access to the metrics collected by the Telemetry Operator is by leveraging the openstackclient.

    $ oc exec openstackclient -- openstack metric list --disable-rbac
    +-------------------------------------------------------------------------+
    | metric_name                                                             |
    +-------------------------------------------------------------------------+
    | ceilometer_cpu                                                          |
    | ceilometer_disk_device_allocation                                       |
    | ceilometer_disk_device_capacity                                         |
    | ceilometer_disk_device_read_bytes                                       |
    | ceilometer_disk_device_read_latency                                     |
    | (...)                                         |
    +-------------------------------------------------------------------------+

    List all the metrics collected by Telemetry Operator.

    The openstackclient is deployed conveniently by default and it can be used to get a quick view of your OpenStack Services on OpenShift services, including of course, Telemetry Operator.

    Telemetry operator queries

    The openstackclient can also be used to issue PromQL queries and retrieve information from your OpenStack Services on OpenShift deployment.

    For example, before your hypervisors start swapping or triggering the OOM killer, this query shows you which nodes have less than 15% of their total memory available:

    $ oc exec openstackclient -- openstack metric query '((node_memory_MemAvailable_bytes / node_memory_MemTotal_bytes) * 100) < 15'
    +--------------------+-------------------------------+-------------------+
    | instance           | fqdn                          | value             |
    +--------------------+-------------------------------+-------------------+
    | 172.20.250.18:9100 | compute2.ctlplane.localdomain | 76.79894520097449 |
    +--------------------+-------------------------------+-------------------+

    Issue PromQL queries through the OpenStack CLI.

    Telemetry operator dashboards

    The Telemetry Operator includes a set of pre-built dashboards that are disabled by default and can be enabled with just the flick of a switch.

    These dashboards can be easily accessed from the Observe > Dashboard panel, right with other dashboards used for OpenShift administration.

    Currently, the set of provided dashboards include:

    • OpenStack Ceilometer VMs easily observe the resource utilisation of Nova VMs.
    • OpenStack Utilization Saturation and Errors (USE) method per cluster and per node. USE panels for the cluster and per each dataplane node.
    • OpenStack Network allows quick access to OVS/OVN metrics from your deployment.
    • RabbitMQ provides deep insights into the state of RabbitMQ nodes used in the OpenStack Services on OpenShift deployment.
    • OpenStack VMs network traffic: Get all the details of inbound and outbound traffic for all your VMs.

    Try them out here.

    The future of OpenStack observability

    The Telemetry Operator, with its powerful metrics collection, PromQL querying capabilities, and pre-built dashboards, marks the first step forward on the road to a significantly better OpenStack observability. By integrating seamlessly with OpenShift's robust monitoring ecosystem, OpenStack Services on OpenShift provides a unified and comprehensive view of your entire environment. This is just the beginning. You can expect further enhancements and capabilities in upcoming releases and articles, as we continue to refine and expand the observability offering for OpenStack.

    Related Posts

    • Effective observability with Red Hat build of OpenTelemetry

    • How Quarkus works with OpenTelemetry on OpenShift

    • What's new in network observability 1.10

    • Improve efficiency with OpenStack Services on OpenShift

    Recent Posts

    • Camel integration quarterly digest: Q4 2025

    • Monitoring OpenStack and OpenShift together

    • Simplifying transit router deployment in Open Virtual Network

    • Selective network hosting with BGP router in OpenShift

    • Troubleshooting with fault tree analysis and PIOSEE

    What’s up next?

    Learning Path LPAR_learning_path__feature_image

    Implement a multi-architecture OpenShift cluster with s390x LPAR

    Learn how to integrate s390x workers into your OpenShift cluster in order to...
    Red Hat Developers logo LinkedIn YouTube Twitter Facebook

    Platforms

    • Red Hat AI
    • Red Hat Enterprise Linux
    • Red Hat OpenShift
    • Red Hat Ansible Automation Platform
    • See all products

    Build

    • Developer Sandbox
    • Developer tools
    • Interactive tutorials
    • API catalog

    Quicklinks

    • Learning resources
    • E-books
    • Cheat sheets
    • Blog
    • Events
    • Newsletter

    Communicate

    • About us
    • Contact sales
    • Find a partner
    • Report a website issue
    • Site status dashboard
    • Report a security problem

    RED HAT DEVELOPER

    Build here. Go anywhere.

    We serve the builders. The problem solvers who create careers with code.

    Join us if you’re a developer, software engineer, web designer, front-end designer, UX designer, computer scientist, architect, tester, product manager, project manager or team lead.

    Sign me up

    Red Hat legal and privacy links

    • About Red Hat
    • Jobs
    • Events
    • Locations
    • Contact Red Hat
    • Red Hat Blog
    • Inclusion at Red Hat
    • Cool Stuff Store
    • Red Hat Summit
    © 2025 Red Hat

    Red Hat legal and privacy links

    • Privacy statement
    • Terms of use
    • All policies and guidelines
    • Digital accessibility

    Report a website issue