With Llama Stack being released earlier this year, we decided to look at how to implement key aspects of an AI application with Node.js and Llama Stack. This post covers observability with OpenTelemetry.
This article is the latest in a series exploring how to use large language models with Node.js and Llama Stack. Catch up on the previous posts:
- Part 1: A practical guide to Llama Stack for Node.js developers
- Part 2: Retrieval-augmented generation with Llama Stack and Node.js
- Part 3: Implement AI safeguards with Node.js and Llama Stack
What is observability?
When your application is running in production it is important to be able to figure out what is going on when things are not working properly. Three key components of observability include:
- Logging
- Metrics
- Distributed tracing
For Node.js applications, the Node.js reference architecture provides recommendations on components you can integrate into your application in order to generate logging, metrics, and distributed tracing information.
For a deeper dive on observability with Node.js overall read Observability for Node.js applications in OpenShift and Essential Node.js Observability Resources.
In this post we will dive into distributed tracing when using Llama Stack and Node.js.
What is OpenTelemetry?
OpenTelemetry is quickly becoming the de facto standard for observability. It includes support for a number of languages including JavaScript and Node.js. It provides a set of APIs that you can use to instrument your application. While you may want to add additional instrumentation to your application the good news is that there are already packages that will auto-instrument existing libraries so you might not need to instrument your application in order to get the information needed.
OpenTelemetry is not specific to the AI and large language model ecosystem, but like in other domains, it is being adopted as the standard for capturing traces. Auto instrumentation or support has already been added to a number of the libraries used to interact with large language models and Llama Stack is no different.
OpenTelemetry provides a way to instrument your application and generate traces, but it does not provide the mechanism needed to receive, store, and visualize those traces. One of the tools commonly used for that is Jaeger.
Setting up Jaeger
For experimentation we can easily set up a Jaeger instance using Podman or Docker. This is the script that we used:
podman run --pull always --rm --name jaeger \
 -p 16686:16686 -p 4318:4318 \
 jaegertracing/jaeger:2.1.0
This starts a Jaeger instance where the UI is available on port 16686 and traces can be sent to be captured and stored on port 4318.
Once you start the container, you can verify that you can access the Jaeger UI, as shown in Figure 1.

Both our Llama Stack instance and our Jaeger instance were running on a Fedora machine with IP 10.1.2.128.
Setting up Llama Stack
We wanted to get a running Llama Stack instance with tracing enabled that we could experiment with. The Llama Stack quick start shows how to spin up a container running Llama Stack, which uses Ollama to serve the large language model. Because we already had a working Ollama install, we decided that was the path of least resistance.
We followed the Llama Stack quick start using a container to run the stack with it pointing to an existing Ollama server. Following the instructions, we put together this short script that allowed us to easily start and stop the Llama Stack instance:
export INFERENCE_MODEL="meta-llama/Llama-3.1-8B-Instruct"
export LLAMA_STACK_PORT=8321
export OLLAMA_HOST=10.1.2.46
export OTEL_SERVICE_NAME=LlamaStack
export TELEMETRY_SINKS=otel_trace,otel_metric
podman run -it \
  --user 1000 \
  -p $LLAMA_STACK_PORT:$LLAMA_STACK_PORT \
  -v ./run-otel-new.yaml:/app/run.yaml:z \
  llamastack/distribution-ollama:0.2.8 \
  --port $LLAMA_STACK_PORT \
  --env INFERENCE_MODEL=$INFERENCE_MODEL \
  --env OLLAMA_URL=http://$OLLAMA_HOST:11434 \
  --env OTEL_SERVICE_NAME=$OTEL_SERVICE_NAME \
  --env TELEMETRY_SINKS=$TELEMETRY_SINKS \
  --yaml-config run.yaml \
Note that it is different from what we used in our earlier post in the series, in that the Llama Stack version has been updated to 0.2.8 and we use a modified run.yaml that we extracted from the Docker container. The update to 0.2.8 was needed as some of the trace propagation that we will cover later was recently fixed.
The first difference you might notice is that we set some additional environment variables and pass them with --env command line options when we start the container.
export OTEL_SERVICE_NAME=LlamaStack
export TELEMETRY_SINKS=otel_trace,otel_metric
These set the service name that is used for traces sent to Jaeger and enables trace and metric generation within the Llama Stack server.
The next difference is in the updated run.yaml. We started the default 0.2.8 llama stack container and extracted the run.yaml template for Ollama (./usr/local/lib/python3.10/site-packages/llama_stack/templates/ollama/run.yaml) from it. We then added the pointers to our Jaeger instance in the telemetry section using the otel_metric_endpoint and otel_trace_endpoint configuration options. After our changes, the telemetry section looked like the following:
 telemetry:
  - provider_id: meta-reference
    provider_type: inline::meta-reference
    config:
      service_name: ${env.OTEL_SERVICE_NAME:}
      sinks: ${env.TELEMETRY_SINKS:console,sqlite}
      otel_metric_endpoint: "http://10.1.2.128:4318/v1/metrics"
      otel_trace_endpoint: "http://10.1.2.128:4318/v1/traces"
      sqlite_db_path: ${env.SQLITE_STORE_DIR:~/.llama/distributions/ollama}/trace_store.db
We ran the container on a Fedora virtual machine with IP 10.1.2.128, so you will see us using http://10.1.2.128:8321 as the endpoint for the Llama Stack instance in our code examples as 8321 is the default port for Llama Stack.
At this point, we had a running Llama Stack instance that we could use to start to experiment with distributed tracing.
A first run
Having enabled tracing in Llama Stack, we wanted to see what would be captured with one of the programs we had used in earlier experimentations. We chose llama-stack-agent-rag.mjs. If you want to learn more about the application, read Retrieval-augmented generation with Llama Stack and Node.js.
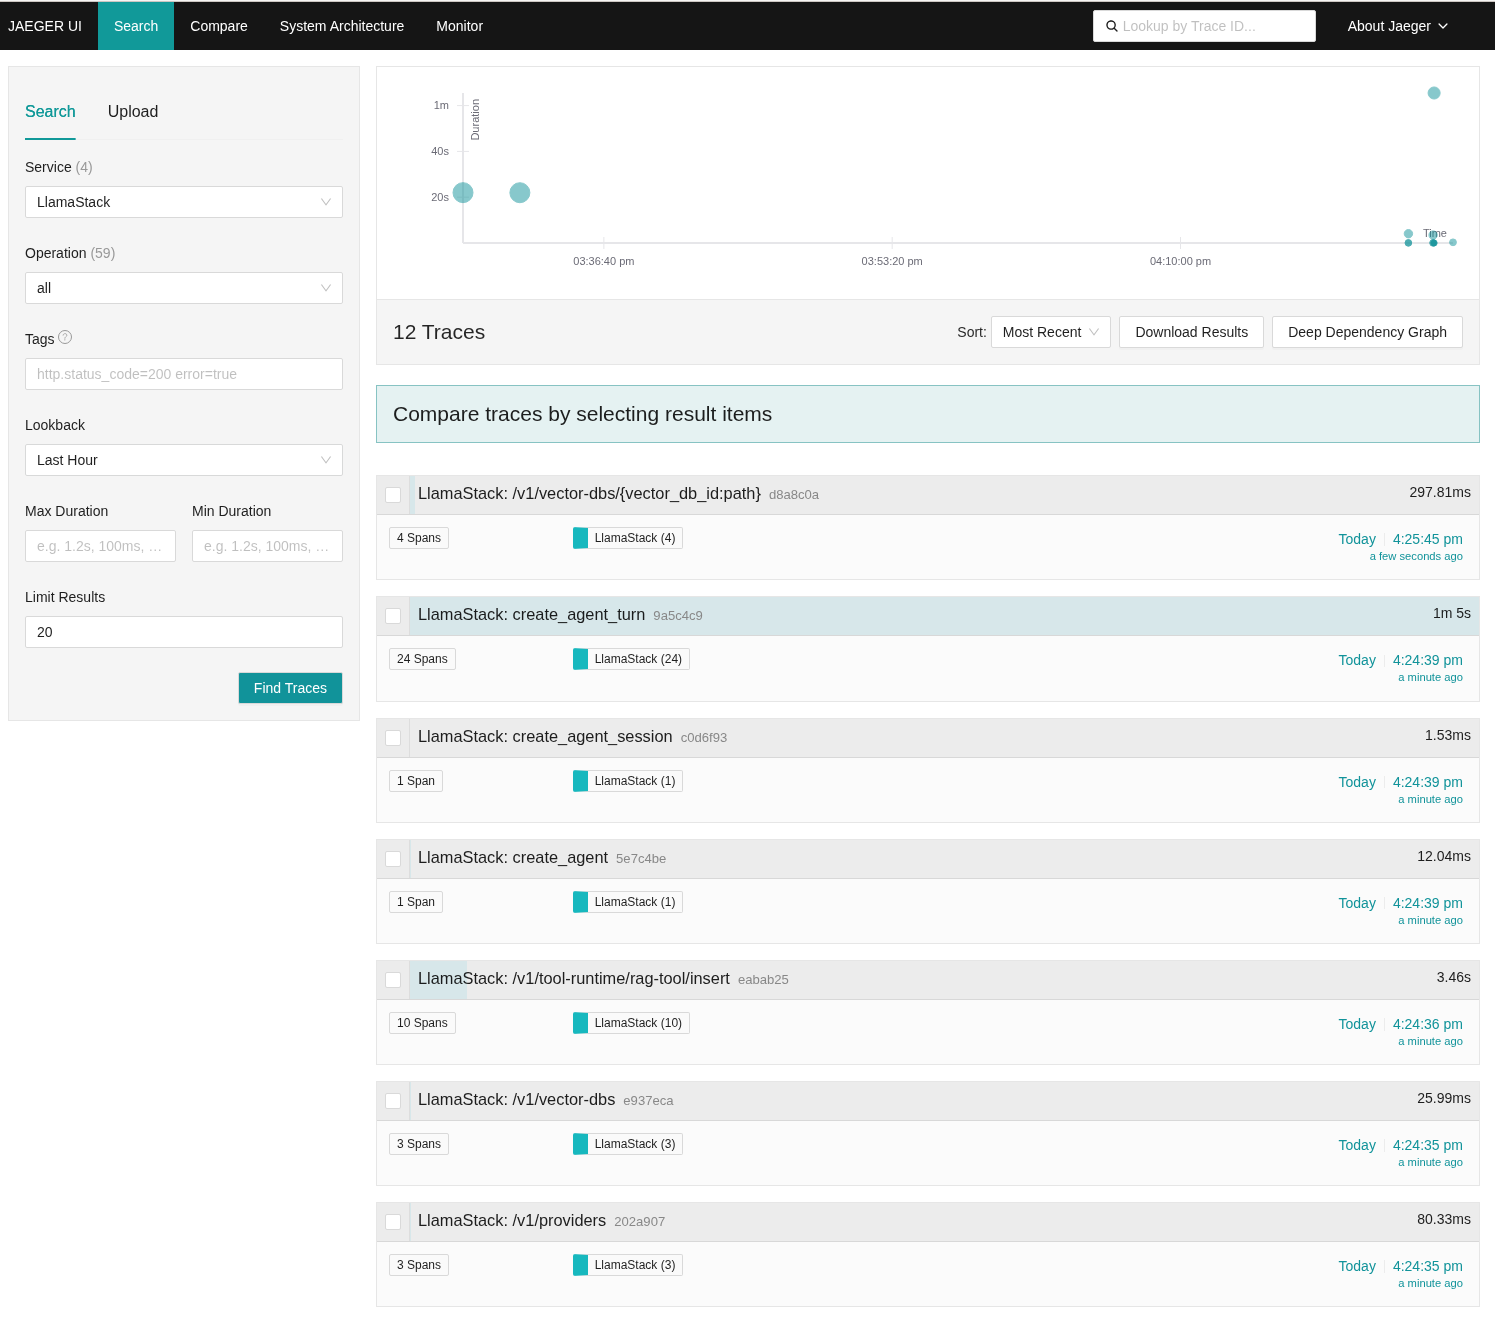
Running that application and then going to the Jaeger search page, we selected LlamaStack for the Service, which is the same as what we configured earlier (Figure 2).

And voilà—there were spans for each of the calls to the Llama Stack APIs, as shown in Figure 3.
Expanding the trace for the creation of a vector database (vectordb), you can see some of the details illustrated in Figure 4.
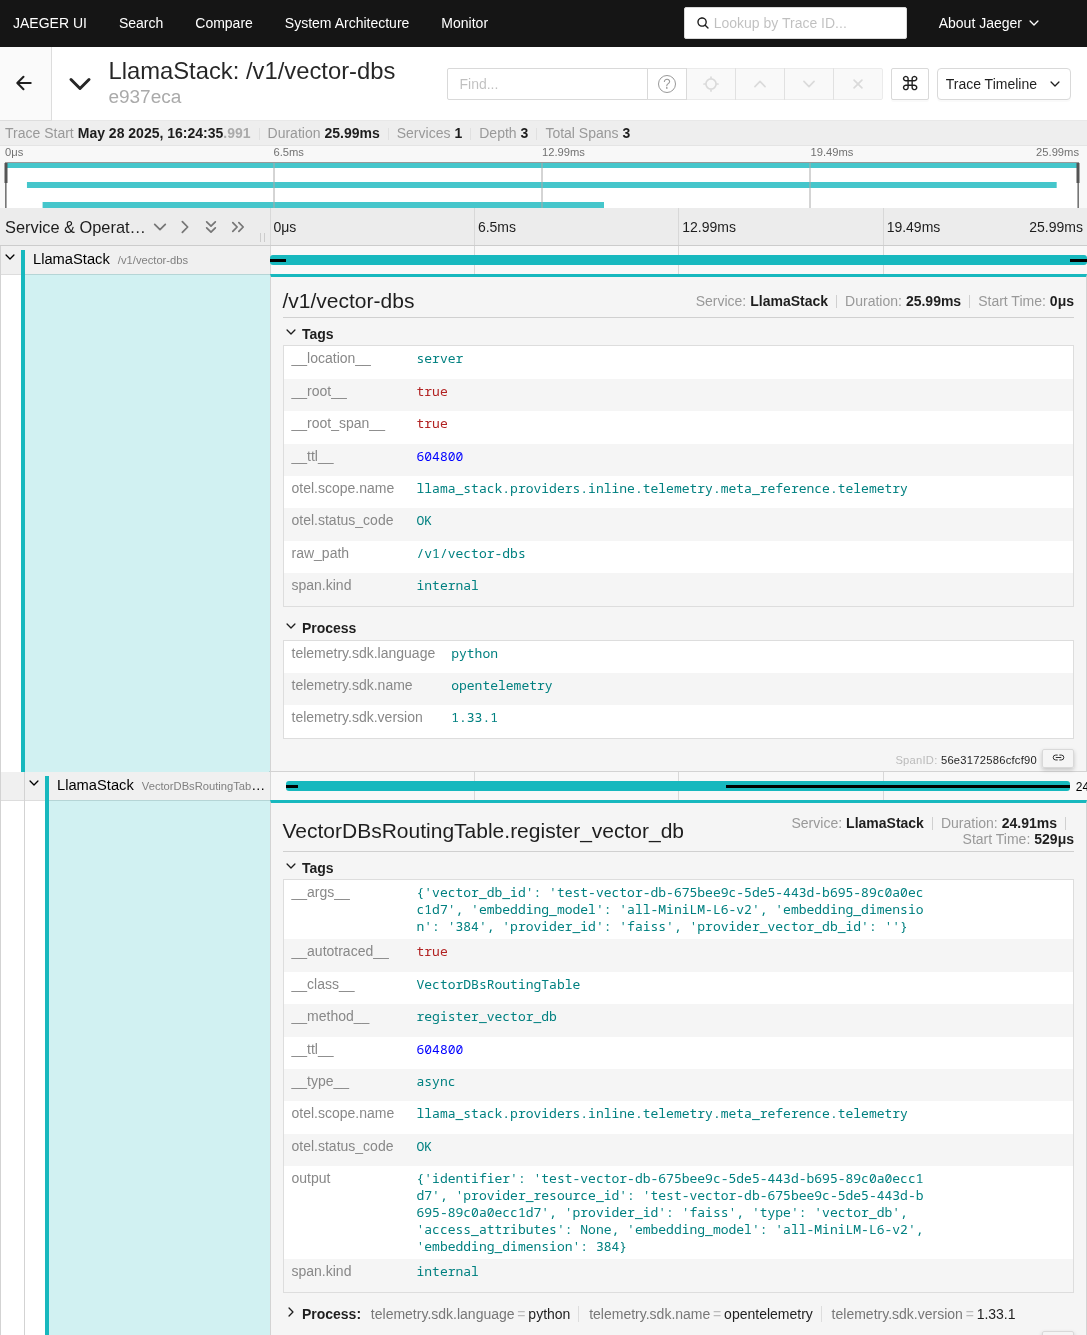
You can see that the endpoint used when we created the vector database was /v1/vector-dbs and the arguments were:
{'vector_db_id': 'test-vector-db-675bee9c-5de5-443d-b695-89c0a0ecc1d7', 'embedding_model': 'all-MiniLM-L6-v2', 'embedding_dimension': '384', 'provider_id': 'faiss', 'provider_vector_db_id': ''}You can similarly expand the spans for each of the calls to get the details of what's going on. And that is without having to change our application at all!
Not quite perfect
One thing we did notice when looking at the spans, however, was that each of the Llama Stack API calls was in its own span and the sequence of calls that we made in the application where not tied together in any way. This would be ok if we only had one request at a time but in a real Llama Stack instance we are likely to have many concurrent applications making requests. This would mean that we would not have a way to figure out which spans belong together.
What is typically done to address this issue is to instrument the application and to open a span at the beginning of a request and then close it after all of the related work is done.
There is an API in Llama Stack (/v1/telemetry/events) which allows us to start/stop a span but after having experimented with it there is no way to get the span id created and we cannot, therefore, use it as the parent span for our sequence of calls. Instead, we needed use the OpenTelemetry APIs to instrument the application so that we could create a parent span to tie things together.
Instrumenting the application
The full code for the instrumented application is available in llama-stack-agent-rag-otel.mjs. This is a modified version of the original application which enables the OpenTelemetry SDK auto-instrumentation for Undici and creates a span that wraps all of the steps in the application.
One key thing to keep in mind is that because spans are now being sent both by the Llama Stack server and from the application, they must both have access to the Jaeger instance, as outlined in Figure 5.

If we don't have the span information from the Node.js application, the spans from Llama Stack will have the right parent span, but Jaeger will report it as an invalid span.
OpenTelemetry Node.js SDK and auto-instrumentation
The first step to instrumenting the application was to set up the Node.js SDK and configure it to:
- Instrument Undici, which provides
fetchwithin Node.js. - Configure an exporter to send spans to the Jaeger instance.
The code do that was as follows:
import { NodeSDK } from '@opentelemetry/sdk-node';
import { OTLPTraceExporter } from '@opentelemetry/exporter-trace-otlp-proto';
import { UndiciInstrumentation } from '@opentelemetry/instrumentation-undici';
import { W3CTraceContextPropagator } from '@opentelemetry/core';
import { trace } from '@opentelemetry/api';
const sdk = new NodeSDK({
 traceExporter: new OTLPTraceExporter({
   url: 'http://10.1.2.128:4318/v1/traces',
 }),
 instrumentations: [new UndiciInstrumentation()],
 propagator: new W3CTraceContextPropagator(),
});
sdk.start();
There are a few key parts we will point out:
- We used the
OLTPTraceExporterto point to the Jaeger instance and to use the port that we had exposed for capturing traces when the container was started: http://10.1.2.128:4318/v1/traces. - We included the Undici Instrumentation
instrumentations: [new UndiciInstrumentation()]. This is because we will configure the Llama Stack client to use the Node.js globalfetchthat Undici provides behind the scenes, and we want to capture calls to the Llama Stack APIs. - We have include a propagator
propagator: new W3CTraceContextPropagator(). We'll talk about this in more detail later. - This code must be before any of the application code, including its imports/requires. Often it is included in a separate file and included on the command line when starting Node.js to ensure it run first.
Using global fetch
Because we are using the Undici instrumentation, we want Llama Stack to use the global fetch in Node.js, which Undici provides under the covers. To do that, we tweaked the creation of the Llama Stack client to be as follows:
    const client = new LlamaStackClient({
     baseURL: 'http://10.1.2.128:8321',
     timeout: 120 * 1000,
     fetch: fetch,
   });
The additional fetch: fetch line is needed so that outgoing http requests will be instrumented.
Starting and stopping a span
The next modification to the application is to wrap the existing code with the creation of a span as follows:
const tracer = await trace.getTracer('Node.js LLamastack application');
tracer.startActiveSpan(
 `Node.js LlamaStack request - ${randomUUID()}`,
 async span => {
... the existing code
   // end the span for the request
   span.end();
   // make sure we wait until all spans have been sent over to jaeger
   // the default flush time is 30s
   setTimeout(() => {
     console.log('done waiting');
   }, 40000);
 },
The part at the end to set a timeout is to ensure that all of the spans are sent to Jaeger before Node.js shuts down. The default span processor flushes spans every 30 seconds. There are better ways to handle this, but it worked for our experimentation.
Node.js LlamaStack request - ${randomUUID()} is the name that we give the top level span and is what we will look for in Jaeger after running the instrumented application.
Otherwise the application is the same as it was in our earlier experimentation.
Running the application
The last thing to mention is that when before running the application we set:
export OTEL_SERVICE_NAME=NodeAgentRAGThis sets the service name for our Node.js application.
A better result
After running the instrumented application, we can again go to Jaeger. This time, let's search on the NodeAgentRAG service name that we configured for our application (Figure 6).

Then, look at the resulting spans (Figure 7).

It shows a single top level span for our application run (which could be a request if it was a microservice). It is named Node.js LlamaStack request - c4032850-693f-415c-88a0-781c9916e526 as requested in our application, with the last part being unique GUID generated for this particular run.
We can then expand the span to see all of the work related to that run, as shown in Figure 8.

Looking at just a smaller part (Figure 9), you can see that the top level span includes spans that have the following service IDs:
- NodeAgentRAG: These come from the Node.js application.
- LlamaStack: These come from Llama Stack.

The first one, tagged with NodeAgentRAG, is the top-level span that we created in the application.
The second one, tagged with NodeAgentRAG, is the outgoing GET request made by the Llama Stack client using Undici. That span is generated by the Undici auto-instrumentation.
Under that GET request, you can see the spans generated in the Llama Stack server as it processes the request.
Having the top level span gives us a much better grouping of related spans and we can now easily find all of the related work for a run/request even if there were multiple concurrent runs at the same time. It also allows us to better visualize the overall timing as we can see the time the full run took as well as how long each of the individual Llama Stack API requests took.
If we had a more complicated application, we could also instrument other aspects of the application (for example database access) or create additional subspans get information on a more granular basis.
One last thing to note is that is important to ensure that sensitive information is not being captured in the spans, so it's a good idea to review what is being captured in the spans and to carefully control access to the Jaeger UIs.
Connecting the spans between the application and Llama Stack
It's great that the spans created by the application and the spans created by Llama Stack are tied together so that we get a unified view, but how does that work across the http call?
Earlier we mentioned the inclusion of a propagator when we configured the OpenTelemetry SDK:
propagator: new W3CTraceContextPropagator(),It's the job of the propagator working with the Undici instrumentation to add an additional http header to each of the requests made by the Llama Stack client to the Llama Stack server.
These headers look like this:
traceparent: version-traceid-spanid-sampledHere's a specific example:
traceparent: 00-1e9a84a8c5ae45c30b1305a0f41ed275-215435bcec6efa72-00When the Llama Stack server receives an API request it looks for this header and if it is present, sets it as the parent span for any spans created as part of the request.
If you want to read about all the details of http trace propagation, see the W3C recommendation Trace Context.
Wrapping up
In this post, we outlined our experiments that used distributed tracing with Node.js, large language models, and Llama Stack. As part of that, we showed you the code to to get a unified span for all of the work in an application request or run. As you can see, distributed tracing is well supported in Llama Stack, which is key because observability is important for real-world applications. Llama Stack also includes support for logging and metrics; we will take a look at those in a future post.
To learn more about developing with large language models and Node.js, JavaScript, and TypeScript, see the post Essential AI tutorials for Node.js developers and More Essential AI tutorials for Node.js Developers.
Explore more Node.js content from Red Hat:
- Visit our topic pages on Node.js and AI for Node.js developers.
- Download the e-book A Developer's Guide to the Node.js Reference Architecture.
- Explore the Node.js Reference Architecture on GitHub.