The custom metrics autoscaler is the Red Hat version of the Kubernetes Event Driven Autoscaler (KEDA) community operator based on the Cloud Native Computing Foundation (CNCF) project. It has been designed to use metrics from different sources, such as pods CPU, memory usage, or other cluster metrics, to decide on whether to autoscale a pod up or down based on the metrics in question.
Examples of such metrics include CPU, memory, number HTTP requests to ingress endpoint, cluster’s health, and more. The source of those metrics is called a trigger, coming from Prometheus monitoring, Kafka, a cron schedule, or many others.
This article demonstrates how to use the custom metrics autoscaler in a different manner than the well-known method. You will learn how a metric collected from the system can be a base to decide on the autoscaling of the application’s pod. In this example, one of the metrics collected by Prometheus from the Red Hat OpenShift Data Foundation storage system has been used to shutdown an application (scaling it down).
This was a real use case from one of our partners that acted on its database application automatically when OpenShift Data Foundation is not healthy. That application has volume claims from OpenShift Data Foundation to store the data.
Use case explanation
In this situation, a database (DB) application is writing data to persistent storage claimed from OpenShift Data Foundation. If OpenShift Data Foundation has a problem, the ceph health status will change accordingly to show either a degraded or even down status. If that happens, writing data to the volume becomes a problem, as it can be corrupted or even lost depending on the issue causing the health state degradation.
It is in the interest of the generator for the data to get the application stopped, and hence, no more data is written to the DB. The custom metrics autoscaler can be used to avoid manual intervention to stop the DB application, which can take time and cause damage.
The cluster used for testing is running OpenShift 4.12 (or above) and has a compatible version of OpenShift Data Foundation installed. This is a 3-node cluster, the minimum number of nodes required for OpenShift Data Foundation.
There is a large number of metrics monitoring the OpenShift Data Foundation cluster. The one that monitors the global health of the cluster (called ceph_health_status) is the one that will be used as a metric by the custom metrics autoscaler. Many issues in the cluster can cause this health status metric to change: disk failure, node failure, etc.
The ceph_health_status can have the value of 0 (Health OK), 1 (Health Warning), and 2 (Health Critical). Node failure will be simulated by stopping on the machines, hence ceph_health_status going from 0 to 1. This triggers the custom metrics autoscaler that we will explain later.
Overview of installation and configuration
To begin, the first requirement is to install the custom metrics autoscaler operator. You can follow the installing the custom metrics autoscaler instructions.
That installation procedure requires creating a KedaController object. In this example, the object was created with the same information as the documentation, except the .spec.operator.caConfigMaps configuration, which is not required here.
The .spec.operator.caConfigMaps configuration is required if you have an external metrics service that you want to connect to. In this example, we use the internal Prometheus metrics collector.
In order to make the creation of KedaController successful, there also needs to be a persistent volume claim (PVC). A PVC was created using the ocs-storagecluster-cephfs storage class from OpenShift Data Foundation. (See Table 2 in the Detailed configuration section).
It is also required to create a scaledObject as per the installation procedure. (See Table 5 in the Detailed configuration section).
The important piece of configuration in that object is the triggers section. The triggers types can be CPU, memory, Kafka, Prometheus, Cron, or others. The triggers field is a list of objects, hence there can be many triggers to activate the autoscaler.
In this integration test, the Prometheus trigger type will be used. The metric will be provided by this metric's collector. The trigger object in this case will use ceph health to decide on scaling up and down the application. There is a parameter called cooldownPeriod:. This gives that specified period of time to the Horizontal Pod Autoscaler (HPA) to keep watching before applying the scaling. It avoids frequent application disruption.
The OpenShift Data Foundation ceph health status metrics is collected by the Prometheus metrics in Red Hat OpenShift. Health status of ceph will be the one metric triggering the autoscaler. It is part of the trigger's entry configuration. You can refer to the Trigger section ceph_health_status in Table 5 in the Detailed configuration section.
There is also a section to configure the authentication to the prometheus metrics collector. Details are provided in the next section.
Detailed configuration
In this section, you can see the different specific configurations related to this test example.
Table 1 shows the spec section from configuration of the KedaController:
spec:
  metricsServer:
    auditConfig:
      lifetime:
        maxAge: "2"
        maxBackup: "1"
        maxSize: "50"
      logFormat: json
      logOutputVolumeClaim: kedapvc [1]
      policy:
        omitManagedFields: false
        omitStages:
        - RequestReceived
        rules:
        - level: Metadata
    logLevel: "0"
  operator:
    logEncoder: console
    logLevel: info
  serviceAccount: {}
  watchNamespace: ""
[1] See Table 2.
Table 2 shows the persistent volume claim created for the KedaController object:
apiVersion: v1
kind: PersistentVolumeClaim
metadata:
  name: kedapvc
  namespace: openshift-keda
spec:
  accessModes:
    - ReadWriteOnce
  volumeMode: Filesystem
  resources:
    requests:
      storage: 2Gi
  storageClassName: ocs-storagecluster-cephfs
Once the KedaController is created, there must be pods running in the openshift-keda namespace:
$ oc get pods -n openshift-keda
NAME READY STATUS RESTARTS AGE
custom-metrics-autoscaler-operator-5fd684746c-bmdrj 1/1 Running 0 10d
keda-admission-644969dc5b-jgqpl 1/1 Running 0 10d
keda-metrics-apiserver-85d55b9577-cqgkp 1/1 Running 0 111m
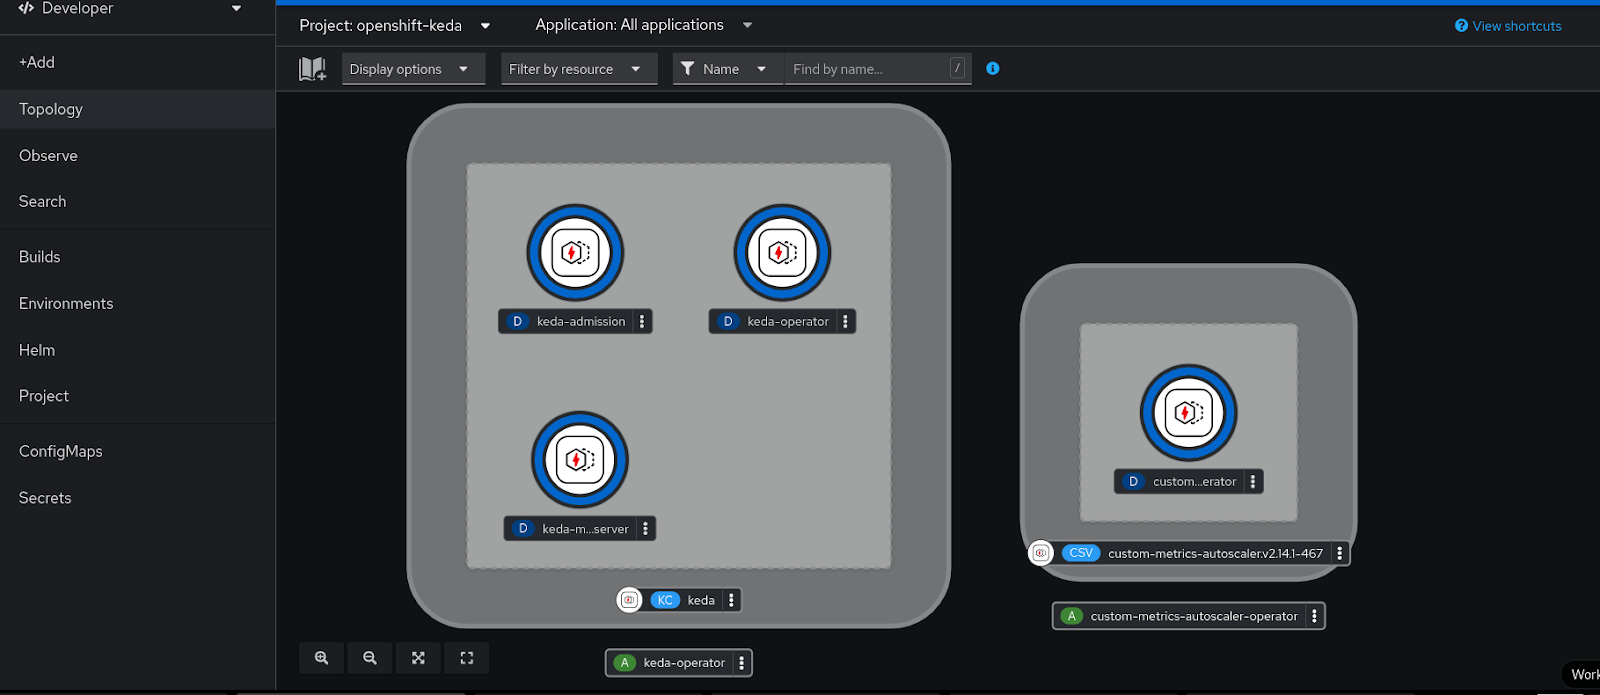
keda-operator-69b768cfb4-tzvzw 1/1 Running 0 10dFigure 1 shows a Keda pod view in the OpenShift console in developer view.
If the scaledObject's trigger needs to authenticate to a data source, its custom resource requires a trigger authentication reference.
The configuration item authenticationRef, in the scaledObject custom resource definition (CRD) refers the name and the type of the authentication object to the TriggerAuthentication object created according to the steps in the Configuring the custom metrics autoscaler to use OpenShift Container Platform monitoring documentation.
First, a service account (SA) (Procedure, Step 2.a) is created in the project (namespace) where the workload application is running, in this example is the DB. The application runs in the project "Default". The documentation indicates to create a new project, but for this test, that is not necessary.
Then a secret is created and will be using the bearer token from that SA [Procedure, Step 2.b ]. Creating this secret was optional in Red Hat OpenShift Container Platform (RHOCP) 4.15 and earlier depending on if the image registry is disabled or not. From RHOCP 4.16 and up, this is required as that authentication bearer secret is not created automatically.
As per the documentation, we show how to create the two above objects. To create the service account:
oc create serviceaccount kedasa -n defaultTo create the secret, Table 3 shows the bearer token created of the service account:
apiVersion: v1
kind: Secret
metadata:
  name: kedasa-token
  Namespace: default
  annotations:
    kubernetes.io/service-account.name: kedasa
  type: kubernetes.io/service-account-token
When this secret is automatically created in RHOCP 4.15 and earlier, it will look like the following:
kedasa-token-xyztw. Running the following command will get you the exact name:
oc get secret -n projectName | grep “serviceaccountName-token”The following is an example:
$ oc get secret -n default | grep "kedasa-token"
kedasa-token-2gc22         kubernetes.io/service-account-token   4      140d
Once that is done, proceed with the next steps (Procedure, Step 3) to create the TriggerAuthentication.
Note:
As for steps 4 and 5 to create the role and role binding, that is required when you need metrics from the namespace where pods are running. In this application example, it was not needed. The role binding was needed from the monitoring platform.
For this integration example to work, the monitoring view cluster role below was bound to the service account in order to be able to gather the metric from prometheus.
The configuration used for this example is as Table 4 shows the TriggerAuthentication object:
apiVersion: keda.sh/v1alpha1
kind: TriggerAuthentication
metadata:
  name: keda-trigger-auth-prometheus
  namespace: default
spec:
  secretTargetRef:
  - parameter: bearerToken
    name: kedasa-token-2gc22
    key: token
  - parameter: ca
    name: kedasa-token-2gc22
    key: ca.crt
To be able to get the cluster monitoring data from OpenShift monitoring (i.e., Prometheus), it must be added the monitoring view role to the service account Keda as follows:
$ oc adm policy add-cluster-role-to-user cluster-monitoring-view -z kedasa -n defaultThe scaledObject CRD is the one used to control the horizontal auto scaling of the application, via the deployment CRD or any other CRD that can create pods.
Table 5 shows the scaledObject configuration:
apiVersion: keda.sh/v1alpha1
kind: ScaledObject
metadata:
  name: autoscaler-ceph-helth-postgresql
  namespace: default
spec:
  cooldownPeriod: 60
  maxReplicaCount: 1
  minReplicaCount: 0
  scaleTargetRef:
    apiVersion: apps/v1
    kind: Deployment
    name: postgresql-db
  triggers:
  - type: prometheus
    metadata:
      serverAddress: https://prometheus-k8s.openshift-monitoring.svc.cluster.local:9091
      namespace: default
      metricName: ceph_health_status
      threshold: '2'
      activationThreshold: '1'
      query: 2-ceph_health_status
      authModes: "bearer"
      ignoreNullValues: "false"
      unsafeSsl: "true"
    authenticationRef:
      name: keda-trigger-auth-prometheus
      kind: TriggerAuthentication
The different parameters in the scaledObject configuration are as follows:
cooldownPeriod: Specifies the period in seconds to wait after the last trigger is reported before scaling the deployment back to 0 if the minReplicaCount is set to 0. The default is 300. This is an important parameter in this case study. One does not need too long to decide to shutdown the application if the storage is not healthy. I have chosen 60 seconds for testing purposes only. It needs to be adjusted according to one's needs.maxReplicaCount: Specifies the maximum number of replicas when scaling up. The default is 100. In this example of a DB server, it is set to 1. It can be set to any value as long as there is no problem with writing to the storage (such as a DB server).minReplicaCount: Specifies the minimum number of replicas when scaling down. In this example, it is set to 0. The application must be shut down if there is a problem with storage. That is the main purpose of the test.scaleTargetRef: This is the target application that is monitored for scaling. In this example, it is the deployment of the DB server.
It can be one of kind Deployment, StatefulSet, or CustomResource.
The following are the different configuration parameters of the trigger:
type: This has been explained in the previous sections. In this example, I am using Prometheus from the cluster’s monitoring.serverAddress: This is the address of the service to be queried for the metrics. This is the address of the Prometheus service in the OpenShift monitoring operator that is installed by default in the RHOCP cluster.metricName: This is the metric name in theexternal.metrics.k8s.ioAPI. If you are using more than one trigger, all metric names must be unique. Of course, here the OpenShift Data Foundation ceph cluster health status is collected in the parameterceph_health_status. It is updated byceph monitordepending on many other parameters such as OSD (disks) health.threshold: Specifies the value that triggers scaling. This must be specified as a quoted string value.activationThreshold: This is the threshold to activate the scaling object. It is explained in the documentation.query: This is how to calculate the value to be decided on for scaling the deployment.authenticationRef: This is the authentication object created in the previous steps based on the service account in the workload namespace. KEDA can control the scaled object via this authentication. For more information, check the documentation.
For reference, all the files are in the GitHub repo.
Start the application and verification steps
The RHOCP cluster is a 3-node cluster with OpenShift Data Foundation installed. Each node has a disk dedicated to OpenShift Data Foundation besides the OS disk.
We've used a simple deployment using a PVC from OpenShift Data Foundation (cephFS again). The application starts by creating the deployment object.
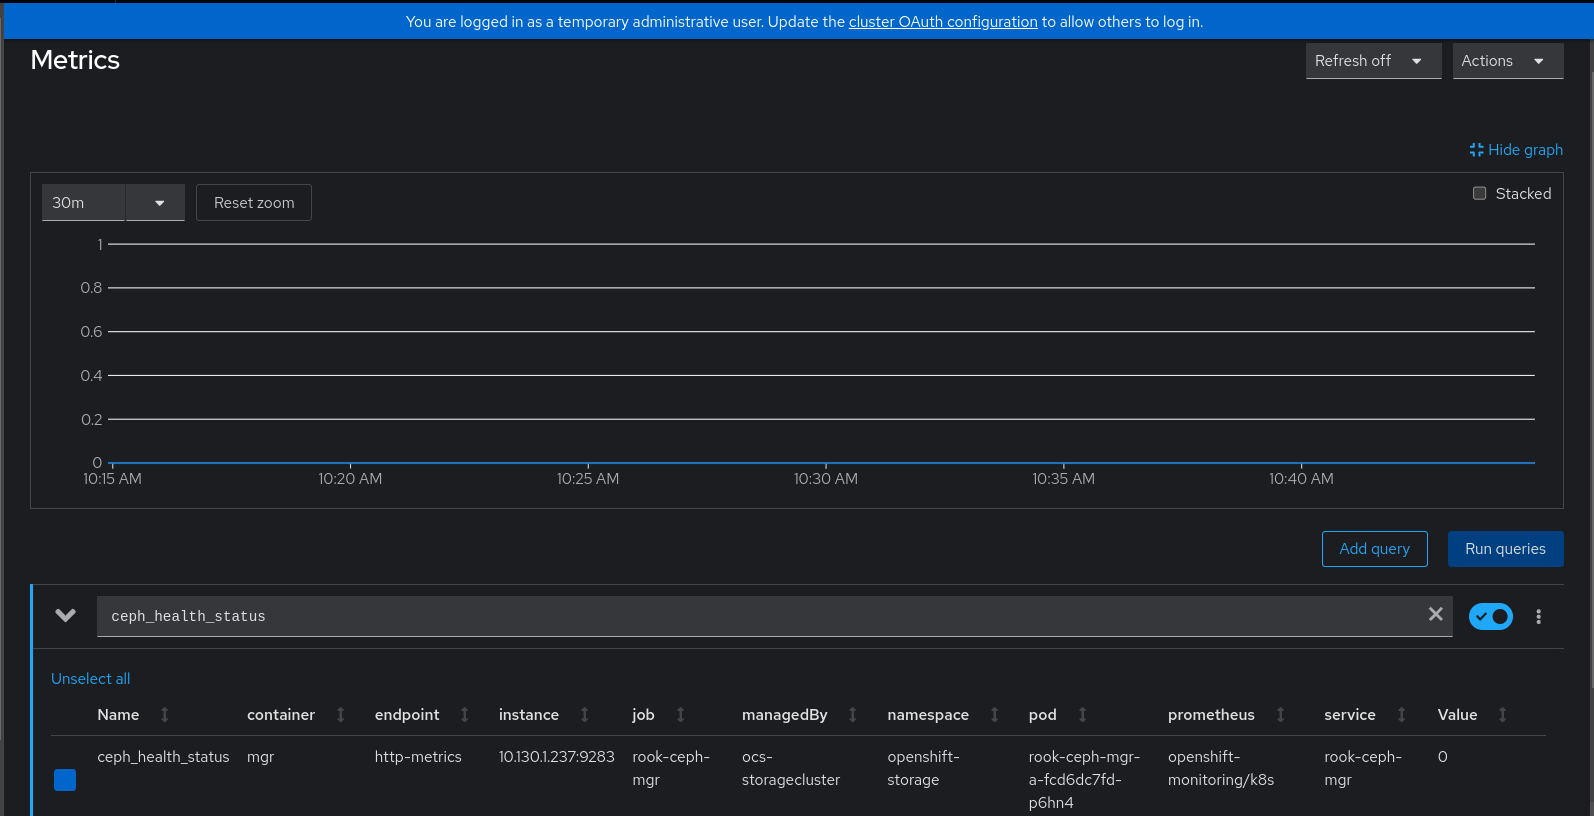
Once the application is up, one of the servers is shut down. In this way, ceph health status will go from HEALTH_OK to HEALTH_WARN.
On the other hand, the ceph_health_status in Prometheus OpenShift monitoring will vary from 0 to 2.
0 means HEALTH_OK, 1 means HEALTH_WARN, and 2 means HEALTH_CRITICAL (or HEALTH_ERR).
Figure 2 shows the ceph health status in OpenShift Metrics Console.
Based on the trigger’s query, threshold, activation threshold, and the min and max replicas, the horizontal autoscaler will decide to scale up and down the application:
spec:
  cooldownPeriod: 60 [1]
  maxReplicaCount: 1 [2]
  minReplicaCount: 0 [3]
…
      metricName: ceph_health_status [7]
      threshold: '2' [8]
      activationThreshold: '1' [9]
      query: 2-ceph_health_status [10]
…
Here is how to do the checks:
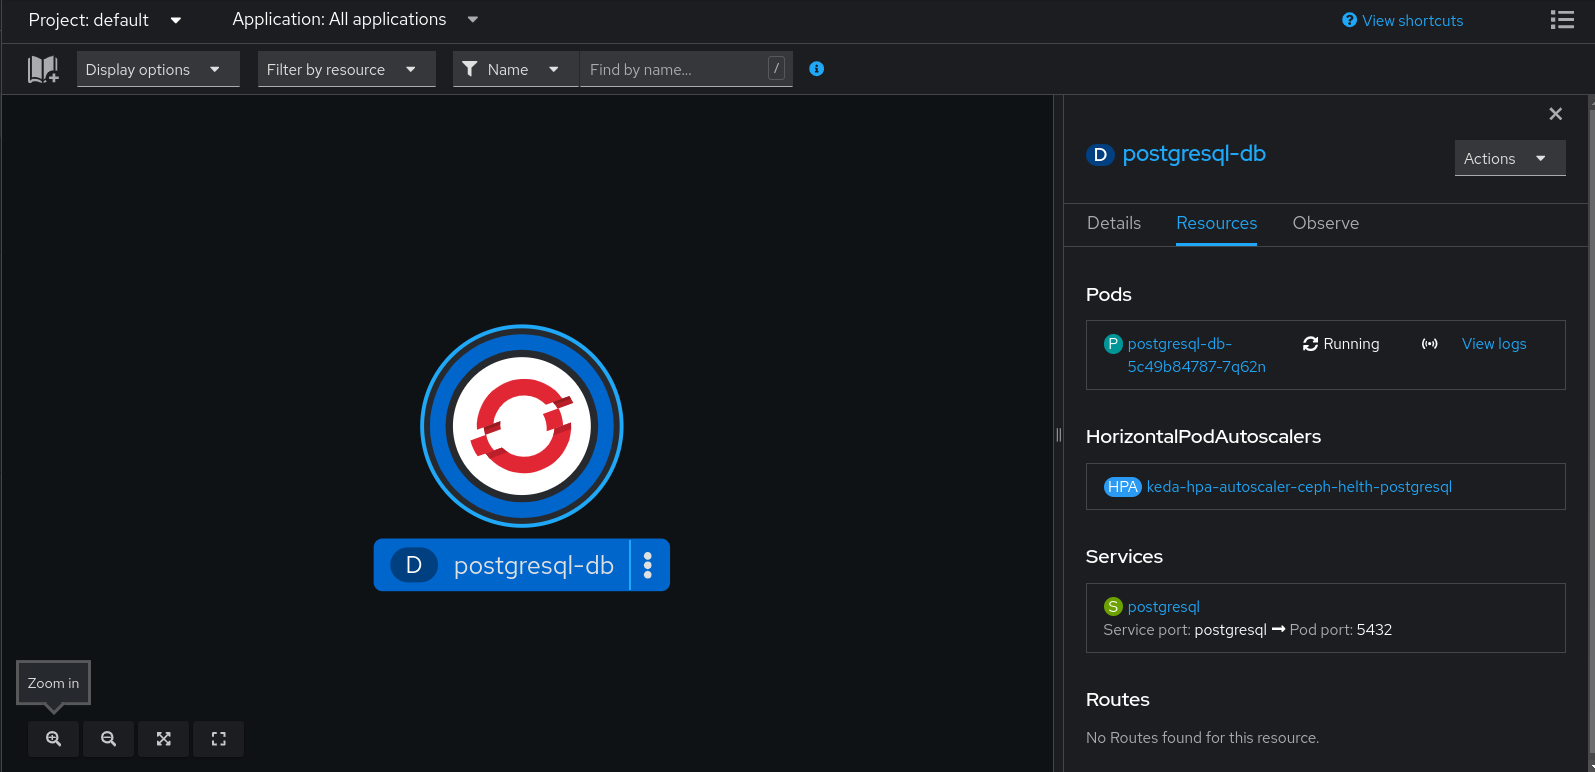
When the OpenShift Data Foundation cluster is healthy, the application must be up and running.
In this test I have used a sample pod to write logs to disk simulating the DB.
The deployment will be responsible for starting the pods and it uses a Fedora or Red Hat Enterprise Linux (RHEL) Red Hat Universal Base Image (UBI) image and starts a logging bash script.
Running the following command on the cluster will show the status of the pod:
$ oc get pods -n defaultThe following is an example:
NAME                               READY   STATUS    RESTARTS      AGE
postgresql-db-5c49b84787-7q62n     1/1     Running   1 (14h ago)   14h
Figure 3 shows Pod Running status in the OpenShift web console in developer view.
Now one of the OpenShift Data Foundation servers is going to be stopped. The purpose of this step is to cause the health warn error to be triggered, and hence, the
ceph_health_statusmetric what is monitored by the autoscaler to go from 0 (HEALTH OK) to 1 (HEALTH WARN)The node will show NotReady:
$ oc get nodes
NAME       STATUS   ROLES                         AGE    VERSION
master-0  NotReady  control-plane,master,worker   259d   v1.27.8+4fab27b
master-1   Ready    control-plane,master,worker   259d   v1.27.8+4fab27b
master-2   Ready    control-plane,master,worker   259d   v1.27.8+4fab27b
Next, monitor the keda operator pod.
This is an example:
$ oc logs keda-operator-69b768cfb4-x4swv -n openshift-keda

2024-10-25T12:55:07Z INFO scaleexecutor Successfully set ScaleTarget replicas count to ScaledObject minReplicaCount {"scaledobject.Name": "autoscaler-ceph-helth-postgresql", "scaledObject.Namespace": "default", "scaleTarget.Name": "postgresql-db", "Original Replicas Count": 1, "New Replicas Count": 0}
Then monitor the pods:
$ oc get pods -n default
NAME                           READY   STATUS    RESTARTS   AGE
postgresql-db-5c49b84787-7q62n   1/1   Terminating   0      15h
The
ceph healthstatus can also be monitored:$ oc exec -n openshift-storage -it rook-ceph-tools-559cf5bc46-gxpds -- ceph -s| grep HEALTH health: HEALTH_WARN
In the OpenShift monitoring dashboard the following query can be run: ceph_health_status. It will see how the value is moving from 0 to 1.
At some point, the service is brought back online. This will move the health metric static back to the HEALTH_OK state:
$ oc get nodes
NAME       STATUS   ROLES                         AGE    VERSION
master-0   Ready    control-plane,master,worker   259d   v1.27.8+4fab27b
master-1   Ready    control-plane,master,worker   259d   v1.27.8+4fab27b
master-2   Ready    control-plane,master,worker   259d   v1.27.8+4fab27b
OpenShift Data Foundation health Status is recovered:
$ oc exec -n openshift-storage -it rook-ceph-tools-5fc865bfd-zrdts -- ceph -s| grep HEALTH
    health: HEALTH_OK
The logs from the keda-operator pod are indicating that the new replicas count is now 1:
2024-10-25T13:14:07Z INFO scaleexecutor Successfully updated ScaleTarget {"scaledobject.Name": "autoscaler-ceph-helth-postgresql", "scaledObject.Namespace": "default", "scaleTarget.Name": "postgresql-db", "Original Replicas Count": 0, "New Replicas Count": 1}The custom metrics autoscaler, which uses the Horizontal Pod Autoscaler, watches the metric gets the new value, and hence, deploys new pods. HPA creates a new replicaSet from the deployment with the min replica count:
$ oc get pods -n default
Example:
NAME                               READY   STATUS    RESTARTS   AGE
postgresql-db-5c49b84787-9qzsc   1/1     Running   0          7m6s
Conclusion
In this article, we provided a practical example of how to configure the custom metrics autoscaler (also known as KEDA in upstream Kubernetes) with a real-world scenario. The metric used was collected from a different namespace and service (OpenShift Data Foundation) other than the metrics available in the pod itself. It shows how to configure the critical parts of OpenShift Container Platform cluster to make it work appropriately.
Thanks to Pedro Ibanez Requena, Max Cao, and John Kyros for reviewing and approving this article.