This is the second article in a series about IOThread Virtqueue Mapping, this time looking at performance in bigger workloads. Check out the first article Scaling virtio-blk disk I/O with IOThread Virtqueue Mapping for an overview of IOThread Virtqueue Mapping and how to configure it.
About IOThread Virtqueue Mapping
Databases are sensitive to disk I/O performance. The IOThread Virtqueue Mapping feature introduced in the QEMU virtual machine monitor in Red Hat Enterprise Linux (RHEL) 9.4 is designed to improve disk I/O performance for workloads that submit I/O from many vCPUs. In this article, we will look at how the IOThread Virtqueue Mapping feature can boost performance for database workloads running in QEMU/KVM guests.
While RHEL guests have supported multi-queue virtio-blk devices for some time, the QEMU virtual machine monitor handled I/O requests in a single thread. This limits the performance benefit of having multiple queues because the single thread can become a bottleneck. This is noticeable when guests have many vCPUs submitting I/O at the same time. See Figure 1.
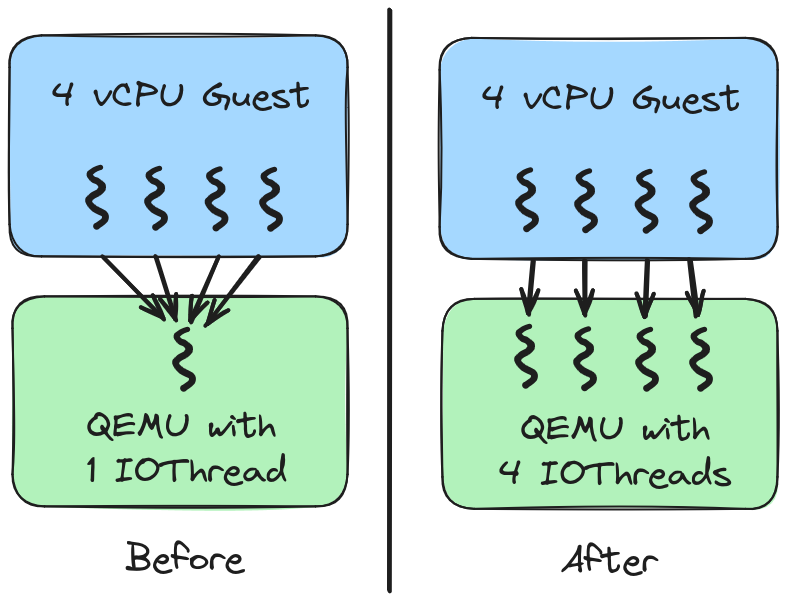
In RHEL 9.4, multiple QEMU threads can process I/O requests for a virtio-blk device. This is called IOThread Virtqueue Mapping. It allows guests with many vCPUs to better take advantage of multi-queue.
Test overview
The performance tests were transactional workloads based on the TPCC (an industry standard benchmark) model, using the HammerDB test suite with 2 databases, MSSQL and Oracle. The testing was done with single and multiple RHEL virtual machines (VMs). For the multiple VM tests, each workload was done with 2, 4, and 8 VMs. The methodology was to run the workload without IOThread Virtqueue Mapping and then repeating the test with IOThread Virtqueue Mapping. Each run set was done with a scaling user count to see how the performance scales as the workload intensity is increased. The transactions per minute (TPM) values from each run, was compared to see the impact io threads has on a real world workload.
System configuration
Hardware:
AMD Genoa (AMD EPYC 9654 96-Core Processor)
   Thread(s) per core:  1
    Core(s) per socket:  96
    Socket(s):           2
Memory: 1.5 TB
Host software:
Kernel - 5.14.0-452.el9.x86_64
qemu-kvm.x86_64 - 17:9.0.0-3.el9
Libvirt domain XML
This is an example of the configuration. The number of virtio-blk queues for the data disk were set to half the number of vcpus in this example. Note that multiple queues are a prerequisite for IOThread Virtqueue Mapping. If you do not specify the number of queues on a virtio-blk device then the number of queues will automatically match the number of vCPUS. This default is suitable for most workloads:
<domain type='kvm' id='2'>
  <name>rhel9_01</name>
  <uuid>cdd876f9-0ac1-430b-8b42-e28ca425b6dd</uuid>
  <metadata>
    <libosinfo:libosinfo xmlns:libosinfo="http://libosinfo.org/xmlns/libvirt/domain/1.0">
      <libosinfo:os id="http://redhat.com/rhel/9.2"/>
    </libosinfo:libosinfo>
  </metadata>
  <memory unit='KiB'>838860800</memory>
  <currentMemory unit='KiB'>838860800</currentMemory>
  <vcpu placement='static'>192</vcpu>
  <resource>
    <partition>/machine</partition>
  </resource>
  <os>
    <type arch='x86_64' machine='pc-q35-rhel9.2.0'>hvm</type>
    <boot dev='hd'/>
  </os>
  <iothreads>4</iothreads>
  <features>
    <acpi/>
    <apic/>
    <pae/>
    <ioapic driver='qemu'/>
  </features>
  <cpu mode='host-passthrough' check='none' migratable='on'/>
  <clock offset='utc'>
    <timer name='rtc' tickpolicy='catchup'/>
    <timer name='pit' tickpolicy='delay'/>
    <timer name='hpet' present='no'/>
  </clock>
  <on_poweroff>destroy</on_poweroff>
  <on_reboot>restart</on_reboot>
  <on_crash>destroy</on_crash>
  <pm>
    <suspend-to-mem enabled='no'/>
    <suspend-to-disk enabled='no'/>
  </pm>
  <devices>
    <emulator>/usr/libexec/qemu-kvm</emulator>
    <disk type='file' device='disk'>
      <driver name='qemu' type='raw' cache='none' io='native'/>
      <source file='/perf1/rhel9_01.img' index='2'/>
      <backingStore/>
      <target dev='vda' bus='virtio'/>
      <alias name='virtio-disk0'/>
      <address type='pci' domain='0x0000' bus='0x04' slot='0x00' function='0x0'/>
    </disk>
    <disk type='file' device='disk'>
      <driver name='qemu' type='raw' cache='none' io='native' queues='96'>
          <iothreads>
            <iothread id='1'/>
            <iothread id='2'/>
            <iothread id='3'/>
            <iothread id='4'/>
          </iothreads>
</driver>
      <source file='/perf1/rhel9_data_01.img' index='1'/>
      <backingStore/>
      <target dev='vdb' bus='virtio'/>
      <alias name='virtio-disk1'/>
      <address type='pci' domain='0x0000' bus='0x08' slot='0x00' function='0x0'/>
    </disk>
.
.
.
Guest software
Kernel - 5.14.0-427.13.1.el9_4.x86_64
Results
Let's examine the Oracle tests first. See Table 1.
User | 10 | 20 | 40 | 80 | 100 |
|---|---|---|---|---|---|
1 VM - Without Iothreads | 502275 | 874371 | 1453838 | 2313728 | 2466708 |
1 VM - 4 io threads | 660906 | 1137540 | 1759600 | 2550453 | 2465182 |
Diff iothreads vs no iothreads (%) | +22.86% | +22.37% | +17.53% | +12.33% | +13.82% |
The data showed a clear gain in performance with 4 IOThreads enabled. As the user count was increased we see that the VM reaches a saturation level and the TPM value flattens out. The gains also decrease when we get to the saturation flat line. Now let's examine the data for two VMs, as shown in Table 2.
User | 10 | 20 | 40 | 80 | 100 |
2 VMs – without IO threads | 1175968 | 1866943 | 3155475 | 5037561 | 5302628 |
2 VMs with IO threads | 1346017 | 2229796 | 3664905 | 5249181 | 5450794 |
Diff iothreads vs no iothreads (%) | +12.63% | +16.27% | +13.9% | +4.03% | +2.72% |
With 2 VMs, we see double the output compared to a single VM. The host system is under more duress and the gains we see with io threads is affected by the overall system activity but we still see double digit gains with moderate to high activity till we reach saturation. Table 3 shows the data for four VMs.
User | 10 | 20 | 40 | 80 | 100 |
4 VMs - without IO threads | 2633709 | 4365018 | 6550691 | 8327475 | 8684021 |
4 VMs – with IO threads | 2944425 | 4657446 | 6511615 | 8655246 | 9015112 |
Diff iothreads vs no iothreads (%) | +10.55% | +6.28% | -0.6% | +3.79% | +3.67% |
Again, as distribute the work among 4 VMs, the total TPM values goes up and we see the same trend across user count and the gain trend also gets lower with higher user count and system saturation. Next, Table 4 shows the data for eight VMs.
User | 10 | 20 | 40 | 80 | 100 |
8 VMs – without IO Threads | 5296693 | 8140100 | 10021034 | 11319230 | 12146374 |
8 VMs – with IO threads | 5236155 | 8184251 | 10258458 | 11678899 | 12375553 |
Diff iothreads vs no iothreads (%) | -1.16% | +0.54% | +2.31% | +3.08% | +1.85% |
With 8 VMs, we find that the host system is completely saturated without even implementing IO threads. When IO threads are enabled, we see no significant gains or loss, i.e., single digit difference. The runs were done to make sure that there’s no overhead of implementing IO threads and that it does not affect performance negatively.
MSSQL workload
Single VM performance shows gains with IO threads, until the workload reaches saturation level where the gains are not seen anymore. See Table 5.
User | 10 | 20 | 30 | 40 | 50 |
1 VM - no Iothreads | 984342 | 1716206 | 2245857 | 2447293 | 2178832 |
1 VM - 4 io threads | 1057213 | 1795770 | 2304984 | 2500406 | 2146220 |
Diff iothreads vs no iothreads (%) | +7.4% | +5.3% | +3.29% | =3.29% | -1.13% |
Table 6 shows that the 2 VM runs show gains over 5% at the lower user counts but the gains are not see at higher user counts.
User | 10 | 20 | 30 | 40 | 50 |
2 VMs – without IO threads | 2151606 | 3657329 | 4549989 | 4452449 | 3758755 |
2 VMs – with IO threads | 2302727 | 3890559 | 4519422 | 4242162 | 3730163 |
Diff iothreads vs no iothreads (%) | +6.56% | +5.99% | -0.68% | -4.96% | -0.77% |
With 4 VMs, as shown in Table 7, we did not see any gains in TPM, when the 2 runs were compared. There was loss in performance, with a single run showing slightly over 5% loss.
User | 10 | 20 | 30 | 40 | 50 |
4 VM – without IO threads | 3916385 | 5514594 | 6342340 | 6279554 | 5930946 |
4 VM – with IO threads | 3677794 | 5439761 | 6258328 | 6279357 | 5911355 |
Diff iothreads vs no iothreads (%) | -6.49% | -1.38% | -1.34% | 0% | -0.33% |
With 8 VMs, as shown in Table 8, we see no gains in performance but the loss in performance was measured under 5%.
User | 10 | 20 | 30 | 40 | 50 |
8 VMs – without IO Threads | 3978575 | 6300584 | 8605045 | 10665459 | 11041451 |
8 VMs – with IO threads | 3871841 | 6065353 | 8422722 | 10394693 | 10959212 |
Diff iothreads vs no iothreads (%) | -2.76% | -3.88% | -2.16% | -2.6% | -0.75% |
Conclusion
We observed that implementing IOThread Virtqueue Mapping with 4 IOThreads for IO-intensive workloads helps performance with database workloads. The performance gains were significant on low to moderately busy systems, which is in the range where most production systems operate. When the workloads reached saturation within the VMs, the gains were lower. With lower VM densities, the gains were more prominent. As VM density went up, the gains were lower. This suggests that IOThread Virtqueue Mapping should be configured on VMs that run workloads that need I/O performance. It is evident from the data gathered that the gains seen here vary by workload, so we recommend applying the setting only the VMs that need it for IO performance.