Page
Deploy the Prometheus instance in the Developer Sandbox

The next step is connecting what you have already done with the Developer Sandbox for Red Hat OpenShift, the free OpenShift/Kubernetes cluster, to finish building out this exercise.
Among many integrations, Developer Sandbox installs the Observability Operator. The Observability Operator is a Kubernetes Operator that enables monitoring/alerting stacks management through Kubernetes Custom Resource Definitions (CRD). So it’s the perfect operator to install and configure Prometheus.
Log in to (or create) your Developer Sandbox account. After logging in, you’ll need to use oc command to connect to the cluster from the terminal. If you don’t have the oc command-line interface (CLI), you can download it by clicking the question mark icon and selecting the Command line tools option, which will let you download the oc tool for your environment.
With oc installed, click on your username, select the Copy login command, and copy the command with the token to the terminal. Figure 2 shows the Developer perspective in the Developer Sandbox.

At this point, you can use kubectl from the terminal to deploy resources to this cluster. In the next part of this activity, we’ll deploy the Prometheus instance using the MonitoringStack CRD defined in the Observability Operator.
The Observability Operator specifically provides Prometheus through the Prometheus Operator, but in a way that is compatible with the default OpenShift stack. Let’s deploy the Prometheus instance into the Developer Sandbox.
Monitoring stack
Create the following file and name it monitoring-stack.yaml to deploy the Prometheus instance:
apiVersion: monitoring.rhobs/v1alpha1
kind: MonitoringStack
metadata:
  name: sample-monitoring-stack
  labels:
    app: monitor
spec:
  logLevel: info
  retention: 1d
  resourceSelector:
    matchLabels:
      app: monitor
Notice that the resourceSelector contains the app=monitor label we set in the application labels in the deployment.yaml file, specifically in the Kubernetes Service definition, is essential because the last thing we must do is configure Prometheus to connect to the service through the Kubernetes Service to retrieve the metrics.
ServiceMonitor
Create a new file named service.monitor.yaml with the following content:
apiVersion: monitoring.rhobs/v1
kind: ServiceMonitor
metadata:
  name: quarkus-monitor
  labels:
    app: monitor
spec:
  selector:
    matchLabels:
      app: monitor
  endpoints:
  - port: http
The ServiceMonitor object is a part of the Observability Operator CRDs to configure the location(s) where Prometheus must retrieve metrics. In this case, we set matchLabels to app=monitor, and the endpoints port to http. This configures Prometheus to get metrics using any Kubernetes Service labeled with app=monitor and a port named http.
Now, it’s time to deploy the solution.
Deploy
Let’s deploy the Prometheus instance with a Thanos sidecar. Run the following command in your terminal:
kubectl apply -f monitoring-stack.yaml
You can check that two instances of Prometheus have been deployed by running the following commands:
kubectl get pods
NAME                                   READY   STATUS    RESTARTS
prometheus-sample-monitoring-stack-0   3/3     Running   0
prometheus-sample-monitoring-stack-1   3/3     Running   0
Then deploy the Quarkus application with the Micrometer installed and expose the /metrics endpoint:
kubectl apply -f deployment.yaml
Wait until it’s ready:
kubectl  get pods
NAME                                   READY   STATUS    RESTARTS
prometheus-sample-monitoring-stack-0   3/3     Running   0
prometheus-sample-monitoring-stack-1   3/3     Running   0
quarkus-monitor-55c59f9679-brbwh       1/1     Running   0
Now configure Prometheus by applying the ServiceMonitor definition:
kubectl apply -f service-monitor.yaml
We need to wait one minute or so until Prometheus connects to our service and starts getting metrics.
To connect to the Prometheus dashboard, the Operator creates a Route with a public URL to access it. Run the following command in the terminal to retrieve the URL:
kubectl  get routes
NAME         HOST/PORT
prometheus   prometheus-asotobue-dev.apps.sandbox-m2.ll9k.p1.openshiftapps.com
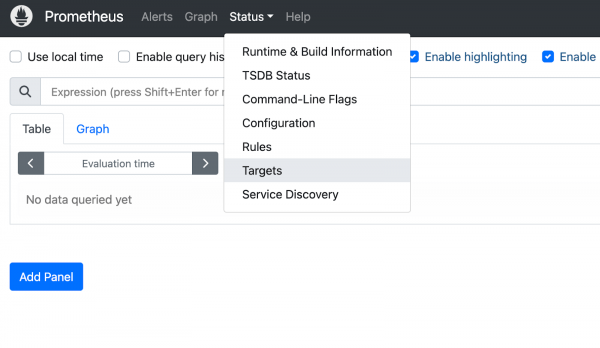
Copy the previous URL to the browser and navigate to the Prometheus dashboard in Status → Targets, as shown in Figure 3.

The Targets section contains the list of instances monitored by Prometheus. In this case, you should see three instances: the two Prometheus instances observed and the Quarkus application (Figure 4).

Conclusion
Monitoring applications in the Developer Sandbox for Red Hat OpenShift is straightforward; you only need to deploy the Prometheus instance with a short YAML file and configure it accordingly with the desired labels. You can install the Observability Operator in any Kubernetes cluster and use it in any other cluster, not just the Developer Sandbox for Red Hat OpenShift.
Monitoring applications is essential, and thanks to Kubernetes Operators, it’s possible to do it quickly. Learn more about Kubernetes Operators here.
