Networking hardware is becoming crazily fast, 10Gbs NICs are entry-level for server h/w, 100Gbs cards are increasingly popular and 200Gbs are already surfacing. While the Linux kernel is striving to cope with such speeds with large packets and all kind of aggregation, ISPs are requesting much more demanding workload with NFV and line rate packet processing even for 64 bytes packets.
Is everything lost and are we all doomed to rely on some kernel bypass solution? Possibly, but let's first inspect what is really the current status for packet processing in the kernel data path, with a perspective look at the relevant history and the recent improvements.
We will focus on UDP packets reception: UDP flood is a common tool to stress the networking stack allowing arbitrary small packets and defeating packet aggregation (GRO), in place for other protocols.
Once upon a time
Blaming on poor networking performances is popular since at least the creation of computer networks. To avoid digging into ancient history, we start this journey from a point far most near in time, just before the most recent bunch of improvements landed the relevant area.
In the following tests, we measure the number of packets that a user space UDP sink[1] is able to receive under flood, while the sender is generating small size packets using the kernel packet generator, pktgen[2]. We measure the different level of stress for the ingress socket setting-up the ingress NIC to use a different number of receive queues to process the traffic, via an appropriate RSS[3] configuration.
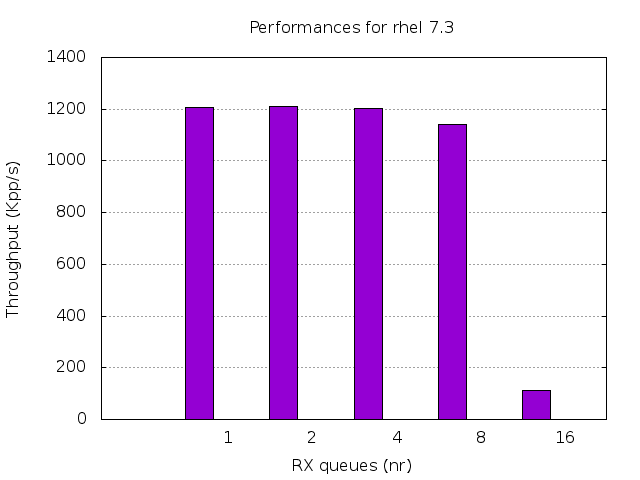
Let's first look at RHEL 7.3 kernel performances:
Similar figures can be measured for the vanilla Linux kernel version 4.9.
The performances for a single UDP flow are actually quite good, most probably beyond what most application demands even on enterprise grade deployment, at least for a single flow.
Are we good then? Nope: the performances do not scale well and adding many receive queues, e.g. as for the common DNS use case, the overall throughput goes down rapidly.
Why? The perf tool[4] can give some hints; tracing the UDP sink process in the most stressful scenario, we see:
70.24% [kernel] [k] _raw_spin_lock_bh

4.25% [kernel] [k] lock_sock_fast

3.33% [kernel] [k] skb_release_data

3.32% [kernel] [k] _raw_spin_unlock_bh

2.46% [kernel] [k] sock_rfree

2.43% [kernel] [k] __free_page_frag

2.37% [kernel] [k] __sk_mem_reclaim

1.55% [kernel] [k] cmpxchg_double_slab.isra.51

1.48% [kernel] [k] _raw_spin_lock_irqsave

0.89% [kernel] [k] _raw_spin_lock

0.71% [kernel] [k] udp_recvmsg

0.57% [kernel] [k] free_pages_prepare

0.53% [kernel] [k] __skb_recv_datagram
At least we have a culprit, but which lock is hunting us? Again, perf came to the rescue; using the '-g' switch to collect and show the call-trace for the collected tracepoints, we observe:
 + 99.76% 0.01% libc-2.17.so [.] __GI___libc_recvmsg

+ 98.83% 0.02% [kernel] [k] system_call_fastpath

+ 98.77% 0.10% [kernel] [k] __sys_recvmsg

+ 98.42% 0.27% [kernel] [k] ___sys_recvmsg

+ 97.98% 0.23% [kernel] [k] sock_recvmsg

+ 97.28% 0.02% libc-2.17.so [.] __GI___libc_recvmsg

+ 97.09% 0.33% [kernel] [k] inet_recvmsg

+ 96.72% 0.73% [kernel] [k] udp_recvmsg

+ 96.38% 0.02% [kernel] [k] system_call_fastpath

+ 96.35% 0.01% [kernel] [k] sys_recvmsg

+ 93.27% 0.14% [kernel] [k] skb_free_datagram_locked

+ 75.08% 4.29% [kernel] [k] lock_sock_fast

+ 70.44% 70.43% [kernel] [k] _raw_spin_lock_bh

70.30% __GI___libc_recvmsg

system_call_fastpath

sys_recvmsg

__sys_recvmsg

___sys_recvmsg

sock_recvmsg

inet_recvmsg

udp_recvmsg

skb_free_datagram_locked
Since skb_free_datagram_locked() acquires the socket lock, we know that the UDP sink spends all its time contending such lock!
A matter of memory
Why is the UDP socket lock so heavily hammered? It's used to protect the forward allocated memory update, udp_recvmsg() needs to acquire it when releasing the packet after the reception, and the kernel threads enqueuing the packets to the sockets can hold it for possibly a long time.
The UDP memory accounting implementation present in the RHEL 7.3 kernel is old, and probably never aimed to scalability. But in recent times it has been revamped, re-using the receive queue spinlock to protect the accounting, dropping the socket lock usage and removing the socket backlog.
All these changes will be entered in the upcoming RHEL 7.4, let's see how the new kernel will behave:
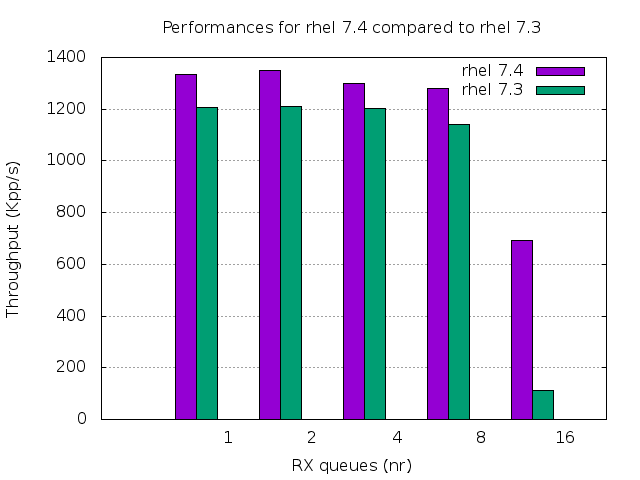
That's roughly 6x better in the more contended scenario, and still, about 10% where we already saw quite good numbers.
Still, the performances degrade significantly while increasing the number of receive queues. Our friend perf will tell us why.
 15.83% [kernel] [k] udp_rmem_release

12.85% [kernel] [k] _raw_spin_lock_irqsave

11.00% [kernel] [k] __free_page_frag

10.74% [kernel] [k] __sk_mem_reduce_allocated

8.25% [kernel] [k] cmpxchg_double_slab.isra.51

4.26% [kernel] [k] copy_user_enhanced_fast_string

3.81% [kernel] [k] udp_recvmsg

2.50% [kernel] [k] inet_recvmsg

2.32% [kernel] [k] skb_release_data

1.94% [kernel] [k] __skb_try_recv_datagram

1.78% [kernel] [k] avc_has_perm_flags

1.68% [kernel] [k] __skb_recv_datagram

1.61% [kernel] [k] sock_recvmsg

1.56% [kernel] [k] _raw_spin_lock
Why udp_rmem_release() takes so much time? It updates the amount of memory allocated by the socket (the rmem_alloc field of the socket data structure) atomically and experiences a cache miss on each run[5] because the kernel threads piping the packets to the socket are changing that value at least as fast as the user space receiver is.
After all, we need bulking
How can we avoid an atomic cache miss per packet? Bulking comes to the rescue: we can update the rmem_alloc field on dequeue with a more coarse grain so that the cache miss cost is amortized on possibly a lot of packets. Eric Dumazet, a lead contributor to the Linux networking stack, added some more clever tricks, like an additional busy lock to ensure that the socket queue (sk_receive_queue) spinlock is distributed fairly between producers and consumer, and a struct socket reorganization, to avoid dirtying hot fields in the common receive and transmit path.
The above landed in Linux 4.11 and will be in the approaching RHEL 7.4-alt.
Let's see where we are:
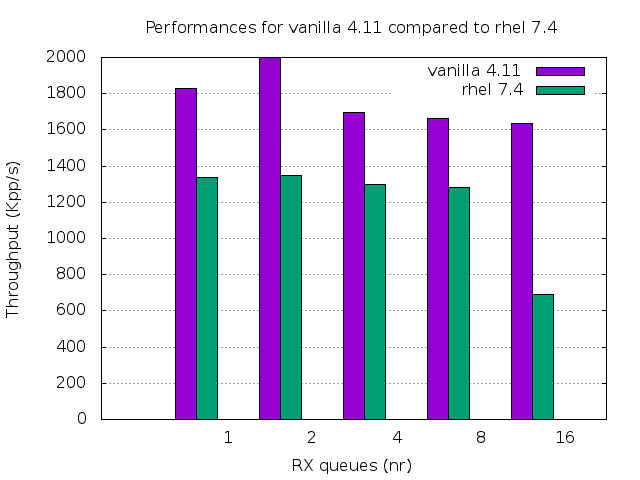
That's a great, additional, 2.5x in the most critical scenario! Even the single receive queue scenario improved a lot because now we can leverage busy polling for unconnected UDP sockets, too[6].
Who is hot on perf output now?
 12.61% [kernel] [k] copy_user_enhanced_fast_string

10.78% [kernel] [k] _raw_spin_lock_irqsave

9.11% [kernel] [k] udp_recvmsg

5.58% [kernel] [k] page_frag_free

4.26% [kernel] [k] native_queued_spin_lock_slowpath

4.12% [kernel] [k] __skb_try_recv_datagram

2.60% [kernel] [k] sock_has_perm

2.52% [kernel] [k] copy_to_iter

2.40% [kernel] [k] skb_release_head_state

2.30% [kernel] [k] avc_has_perm
History repeats itself: a lock is biting us, again. This time is the sk_receive_queue spinlock. We can be sure since it's the only lock in place in the UDP receive path.
Contention, again
How can we improve here? Eric Dumazet, again, had a nice suggestion: we can use two queues, reading from an ancillary one and splicing from the sk_receive_queue when the first is empty so that under load the relevant spinlock contends only once every several packets.
The related patches landed in upstream net-next and will eventually land into Linux 4.13, let's see how such kernel behave:
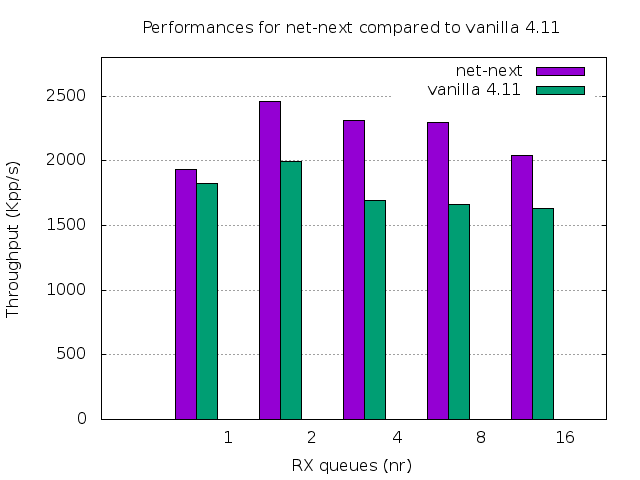
Not as great as the previous iterations, but that is still more than 30% speed-up in the contended scenario. More interestingly now the performances do not degrade with the increase of the receive NIC queues and even improve significantly when moving from a single queue to a limited number of receive queues.
Does perf show any low hanging fruits now? Let's see.
 12.58% [kernel] [k] copy_user_enhanced_fast_string

7.83% [kernel] [k] page_frag_free

4.69% [kernel] [k] skb_release_data

3.94% [kernel] [k] udp_recvmsg

3.32% [kernel] [k] __skb_copy_datagram_iter

3.13% [kernel] [k] skb_release_head_state

3.02% [kernel] [k] __skb_recv_udp

2.94% libc-2.17.so [.] __GI___libc_recvmsg

2.83% [kernel] [k] sock_has_perm

2.77% [kernel] [k] __fget_light

2.77% [kernel] [k] avc_has_perm

2.74% [kernel] [k] cmpxchg_double_slab.isra.64

2.61% [kernel] [k] __audit_syscall_exit

2.61% [kernel] [k] __slab_free
A large amount of time spent in copy_user_enhanced_fast_string() is expected: even if the packets we are processing are small, we have to copy their contents to user space and we can't escape cache-misses there.
The first relevant entry is page_frag_free(), which frees the buffer carrying the packet and experiences a cache-miss while atomically decrementing the page reference count.
Its presence in the perf trace is actually ingress-device-driver dependent: we used the Intel ixgbe for our tests, others devices expose different behaviors, but generally speaking, a faster page allocator would probably save the day.
What's next?
Fast memory allocation and reclaiming is a hot topic for fast networking performance for some time, and will probably be in the near future.
There are still other smaller steps we can take in the networking stack; the socket buffer (skbuff) data structure we have to process for each packet is a heavy burden we can try to lift.
As UDP code becomes more efficient, the per syscall overhead is more measurable.
Overall the Linux kernel improved UDP receive performances by more than an order of magnitude for relevant use case scenario, peak performances are now approaching line rate processing at 10Gbps with internet mix traffic[7] and there is room for more. Stay tuned!
[1] The user space program used for testing is available here:
https://github.com/netoptimizer/network-testing/blob/master/src/udp_sink.c
with the following command line: udp_sink --recvmsg --count 1000000 --repeat 1 --port 9
The DUT is a 12 cores, 24 threads, single NUMA node Xeon E5-2690 v3, with all netfilter/conntrack related modules removed and flow control disabled on the ingress NIC.
[2] Pktgen allows a single core to generate up to 14Mpps packets on modern h/w. Our tests were bound by the sender h/w in use to roughly 6.7Mpps; some sample scripts to configure and control pktgen are available here:
https://github.com/netoptimizer/network-testing/blob/master/pktgen/
[3] RSS - Receive Side Scaling is a mechanism implemented by most NIC to distribute the ingress traffic on different queues and CPUs, see: Documentation/networking/scaling.txt for more details
[4] The perf tool allows collecting a large variety of performances events from the Linux kernel, analyzing and displaying them. We relied on CPU usage data reported by the following command line:
perf top -p `pidof udp_sink`, unless differently specified.
[5] Recent version of the perf tool allows to trace and analyze the cache miss with great detail, see: https://joemario.github.io/blog/2016/09/01/c2c-blog/; in this case code analysis sufficed.
[6] The busy polling infrastructure has been greatly enhanced on recent upstream kernels; before 4.10 we needed connected sockets to leverage it.
[7] The average packet length sampled on Internet traffic is supposed to be 300B, thus the line rate on a 10Gbps is ~3.8Mpps.
Take advantage of your Red Hat Developers membership and download RHEL today at no cost.
Last updated: June 13, 2017