This article is the second part of a two-part series analyzing Identity Management (IdM) performance when encrypted DNS (eDNS) is introduced. The previous article focused on extensive testing from a virtual machine (VM) joined to an IdM server. In this second part, we evaluate performance from within Pods and Deployments on an Red Hat OpenShift cluster version 4.20, calling the IdM BIND server directly and indirectly (through the CoreDNS service), which is quite a different scenario.
This scenario is significantly more complex than the previous one, and it requires extensive tuning of IdM to have good and consistent results. We pushed IdM to its absolute limits, profiling, stressing, twisting, and optimizing it in multiple ways until we identified how to extract the maximum possible performance.
All work described in the previous post related to the Prometheus and Grafana setup remains unchanged and can be fully reused in this scenario. The data source is set up in the same way, and the required dashboards are unchanged (specifically, the Node Exporter and BIND Exporter dashboards). Additionally, the integration of IdM and CoreDNS has been addressed in an earlier article.
Architecture of the setup and tuning of IdM
We've installed both Identity Management and OpenShift cluster in Amazon Web Services (AWS). The IdM server we used for this article was c8i.xlarge in AWS, which has 4 vCPU and 8 GB RAM.
The installation of IdM on Red Hat Enterprise Linux 10.1 with encrypted DNS (eDNS) is already covered in a previous article. However, to conduct the performance tests described here, two changes are required:
Set the DNS policy
Set the DNS policy to relaxed. You can configure this during the initial installation using the following command:
# ipa-server-install --setup-dns --dns-over-tls \
--dns-policy relaxed --no-dnssec-validation \
--dot-forwarder=8.8.8.8#dns.google.com
If the IdM server was already installed with the DNS policy set to enforced, you can change it to relaxed:
# ipa-dns-install --dns-policy=relaxedEnable DNS service in firewalld
Enable the standard DNS service in firewalld using firewall-cmd:
# firewall-cmd --add-service dns
# firewall-cmd --runtime-to-permanent
Create a records.txt DNS record
You must create a records.txt file containing all the resource records in the format required by the dnsperf command to run these tests. The following Python script generates a records.txt file with 1,000 records. Copy this and run it in the terminal:
python3 -c "
with open('records.txt', 'w') as f:
    for i in range(1, 1001):
        f.write(f'test-record-{i}.melmac.univ A\n')
"
This creates the following records.txt file:
$ cat records.txt
test-record-1.melmac.univ A
test-record-2.melmac.univ A
test-record-3.melmac.univ A
test-record-4.melmac.univ A
[...]
test-record-1000.melmac.univ A
After generating the file containing all records required for the dnsperf tests and populating Identity Management using the same script described in the first article, we're ready to move on to the OpenShift side of the equation.
Prepare the Pods
Our intended target is 100% CPU utilization (or as close as possible) on the IdM system when performing stress tests.
You can create an ad-hoc container or you can configure it at runtime. We've elected to configure the container at runtime for simplicity, acknowledging that it's not strictly the best choice.
To begin with, create the Deployment:
$ oc create deployment dnsperf-load \
--image=registry.access.redhat.com/ubi9/ubi \
--replicas=4 -- /bin/bash -c "sleep infinity"
To prepare the Pods, install dnsperf and copy the records.txt on each Pod of the Deployment (another option would be to mount a ConfigMap with the file records.txt). Execute the script:
#!/bin/bash
# 1. Get all pod names matching the label
PODS=$(oc get pods -l app=dnsperf-load -o jsonpath='{.items[].metadata.name}')
for pod in $PODS; do
  echo "Preparing $pod..."
  # --- STEP 1: Add ALL CentOS Stream 9 Repos (BaseOS, AppStream, CRB) ---
  # Overwrite repos to ensure we have access to full OS library set
  # preventing "nothing provides" errors for standard libraries like ldns
  oc exec $pod -- bash -c 'cat <<EOF > /etc/yum.repos.d/centos-stream-all.repo
[centos-baseos]
name=CentOS Stream 9 - BaseOS
baseurl=https://mirror.stream.centos.org/9-stream/BaseOS/x86_64/os/
enabled=1
gpgcheck=0
[centos-appstream]
name=CentOS Stream 9 - AppStream
baseurl=https://mirror.stream.centos.org/9-stream/AppStream/x86_64/os/
enabled=1
gpgcheck=0
[centos-crb]
name=CentOS Stream 9 - CRB
baseurl=https://mirror.stream.centos.org/9-stream/CRB/x86_64/os/
enabled=1
gpgcheck=0
EOF'
  # --- STEP 2: Clean Metadata ---
  # Force dnf to see new repos immediately
  oc exec $pod -- dnf clean all
  # --- STEP 3: Install EPEL ---
  oc exec $pod -- dnf install -y --nogpgcheck https://dl.fedoraproject.org/pub/epel/epel-release-latest-9.noarch.rpm --disableplugin=subscription-manager
  # --- STEP 4: Install dnsperf ---
  # Now dnf has access to AppStream (standard libs) and CRB (dev libs)
  oc exec $pod -- dnf install -y --nogpgcheck dnsperf bind-utils --disableplugin=subscription-manager
  # --- STEP 5: Copy Data ---
  oc cp ./records.txt $pod:/tmp/records.txt
  echo "$pod is ready!"
done
Initial tests
With this setup, running a simple dnsperf test for DNS over TCP using the IdM BIND server (and the same -c4 option as the first article, denoting only four concurrent clients) results in relatively poor performance. We say "relatively" because although they are impressive in AWS, the numbers can still be improved. CPU utilization reaches only about ~26–32%, while throughput remains at ~118-120k queries per second (QPS) with an average latency of just 800 µs. The command used for this test:
[dnsperf-load-599754]# dnsperf -f inet -m tcp \
-s demo-0.sandbox2980.opentlc.com -p 53 -T 4 -c 4 \
-l 120 -d /tmp/records.txt -O latency-histogram \
-O verbose-interval-stats -S 1 \
-O suppress=timeout,unexpected > dnsperf-result-tcp-4.txt
The results can be summarized in the following order of QPS:
Statistics:
  Queries sent:         14194210
  Queries completed:    14194210 (100.00%)
  Queries lost:         0 (0.00%)
  Response codes:       NOERROR 14194210 (100.00%)
  Average packet size:  request 44, response 60
  Run time (s):         120.043025
  Queries per second:   118242.688403
  Average Latency (s):  0.000827 (min 0.000246, max 0.073016)
  Latency StdDev (s):   0.000908
In our initial article, the system exhibited correct, and sufficiently performant, behavior from the outset so tuning was not required. However, in this new scenario, we need to tune the IdM server to achieve maximum utilization.
Additionally, as Kubernetes or OpenShift increases the number of components to communicate, it is probable that the number of concurrent connections would be higher. In that sense, when we increase the request concurrency to 200 connections, CPU usage shows a noticeable increase, reaching approximately 56–58%. However, this higher CPU utilization is not followed by an improvement in throughput, but remains almost the same in QPS and latency values. This is the command:
[dnsperf-load-599754]# dnsperf -f inet -m tcp \
-s demo-0.sandbox2980.opentlc.com -p 53 -T 4 -c 200 \
-l 120 -d /tmp/records.txt -O latency-histogram \
-O verbose-interval-stats -S 1 \
-O suppress=timeout,unexpected > dnsperf-result-tcp-4.txt
This resulted in the following QPS and summary values:
Statistics:
  Queries sent:         13699647
  Queries completed:    13699047 (100.00%)
  Queries lost:         600 (0.00%)
  Response codes:       NOERROR 13699047 (100.00%)
  Average packet size:  request 44, response 60
  Run time (s):         120.041967
  Queries per second:   114118.814797
  Average Latency (s):  0.000609 (min 0.000000, max 0.245052)
  Latency StdDev (s):   0.000874
It is evident that simply increasing concurrency does not improve performance in this case. We need to find a balance where higher CPU utilization translates into a corresponding increase in QPS. On one hand, we're hitting a hard limit imposed by the default BIND configuration, which typically restricts the number of TCP clients to 150. As a result, when concurrency is set to 200, around 50 connections are immediately rejected or queued. To overcome this limitation, add the following settings to the end of the /etc/named/ipa-options-ext.conf file:
tcp-clients 1000;
tcp-listen-queue 4096;
Note: In this scenario, it does make sense to have tcp-clients significantly higher than the -c parameter. We need a buffer of free slots, and we will use pipelining, so we don't need thousands of connections to saturate a server. With pipelining, every client defined in the -c parameter opens this number of simultaneous connections to the IdM BIND. If we increased -c to 1000, we would just be adding overhead (more TCP handshakes, more context switching) without necessarily adding pressure.
Next, apply a restart of the named service:
[idm]# systemctl restart namedWith that change, when we run the same dnsperf command (-c 200), the usage of CPU is improved to around 70-74% with about 150-160k QPS. We're using more "productive" CPU cycles, but we still have around ~30% to conquer (and additionally explore how to use our 70% more efficiently).
Keeping the -c 200 option leaves the default queue limit of outstanding queries at 100. As a result, we end up with more available clients than permitted "in-flight" queries, which is inefficient. We aren't driving enough traffic to fully utilize 200 clients, and are instead throttled by the default queue limit. By increasing the number of simultaneous in-flight queries to 1,000 (-q 1000), we allow roughly five outstanding queries per client. This removes the artificial bottleneck and enables dnsperf to generate significantly higher throughput (QPS), effectively stress-testing the server. With the previously described IdM tuning and this change in the dnsperf command to increase concurrent connections and outstanding requests, CPU utilization improves substantially, reaching approximately 84-85%. However, throughput is almost the same, or shows some negligible gains at 155-160k QPS, so we must identify where the next bottleneck is.
The updated command:
[dnsperf-load-599754]# dnsperf -f inet -m tcp \
-s demo-0.sandbox2980.opentlc.com -p 53 -T 4 -c 200 -q 1000 \
-l 120 -d /tmp/records.txt -O latency-histogram \
-O verbose-interval-stats -S 1 \
-O suppress=timeout,unexpected > dnsperf-result-tcp-4.txt
This results in the following summary statistics:
Statistics:
  Queries sent:         19342357
  Queries completed:    19342357 (100.00%)
  Queries lost:         0 (0.00%)
  Response codes:       NOERROR 19342357 (100.00%)
  Average packet size:  request 44, response 60
  Run time (s):         120.047031
  Queries per second:   161123.160139
  Average Latency (s):  0.006155 (min 0.000239, max 0.098975)
  Latency StdDev (s):   0.005888
A bottleneck in the logs
Our next identified bottleneck is in the log processing of BIND in IdM. To eliminate the logging bottleneck, and to free up the CPU for processing DNS queries, we redirected all BIND logging categories to /dev/null. This stops the server from waiting for disk I/O. Of course, this is not recommended in production, but for our tests this is completely mandatory. At 160,000 QPS, even a "quiet" log configuration generates massive system overhead, because every time BIND writes a line to a log file or syslog, it forces a context switch to the kernel.
First, do a backup of the /etc/named/ipa-logging-ext.conf file. Then edit /etc/named/ipa-logging-ext.conf, replacing its content with:
// Redirect all major categories to null to eliminate I/O Wait
category default        { null; };
category general        { null; };
category security       { null; };
category queries        { null; };
category query-errors   { null; };
category lame-servers   { null; };
category dnssec         { null; };
category edns-disabled  { null; };
category config         { null; };
category resolver       { null; };
category cname          { null; };
category spill          { null; };
category rate-limit     { null; };
category database       { null; };
category client         { null; };
category network        { null; };
category update         { null; };
category dispatch       { null; };
There is another option to accomplish similar results without disabling all logs. You can instead change the severity level of the query logs. To do this, find this block in the configuration file:
channel query_log {
        file "data/query.log" versions 10 size 80M;
        severity info;
        print-time yes;
        print-severity yes;
};
Replace it with this configuration:
channel query_log {
        file "data/query.log" versions 10 size 80M;
        severity notice;
        print-time yes;
        print-severity yes;
};
Finally, restart the named service:
# systemctl restart namedWith this change in place, QPS increases dramatically to approximately 240-250k, while CPU utilization rises to around 96–97%, confirming that we have (almost) closed the final performance gap. The remaining few percentage points are likely lost in the microseconds required for the CPU to transition from an idle state to handling network interrupts.
The new results:
Statistics:
  Queries sent:         29093016
  Queries completed:    29093016 (100.00%)
  Queries lost:         0 (0.00%)
  Response codes:       NOERROR 29093016 (100.00%)
  Average packet size:  request 44, response 60
  Run time (s):         120.045238
  Queries per second:   242350.437924
  Average Latency (s):  0.003995 (min 0.000254, max 0.107687)
  Latency StdDev (s):   0.004413
Enable busy polling
Further optimization is possible by enabling busy polling, which instructs the kernel to avoid sleeping to keep the CPU "spinning" while waiting for incoming packets.
# sysctl -w net.core.busy_read=50
# sysctl -w net.core.busy_poll=50
This approach trades CPU efficiency (and power savings) for raw performance, and pushes the CPU to 99% usage. Because the CPU is already fully saturated, busy polling ensures that more cycles are dedicated to packet processing, eliminating wake-up latency and yielding an additional gain of roughly 5-10k QPS at most, achieving 255-260k of QPS.
With all that configuration, we've reached the maximum with 1% CPU idle time. One last tune parameter we applied is the tuned profile called network-latency (instead of the virtual-guest it has by default). After changing the tuned profile, no improvement was observed. This confirms that we've achieved our best performance.
To change the profile execute:
# tuned-adm profile network-latency
# tuned-adm active
The only way to go beyond 99% to 99.9% is through a tuning of priority (renicing) of the named process, which forces the CPU to process BIND before anything else (logging agents, monitoring, cron jobs). It might convert that last 1% idle into QPS, but we obtain negligible QPS gains because we're hitting the "efficiency wall". The CPU works harder to schedule tasks, not answering queries faster. Consequently, we can consider the IdM system fully tuned for workload testing, having achieved its maximum performance in our environment.
With all of this in place, we can consider the IdM system fully tuned and ready to perform workload tests, which are based on the architecture shown in Figure 1.
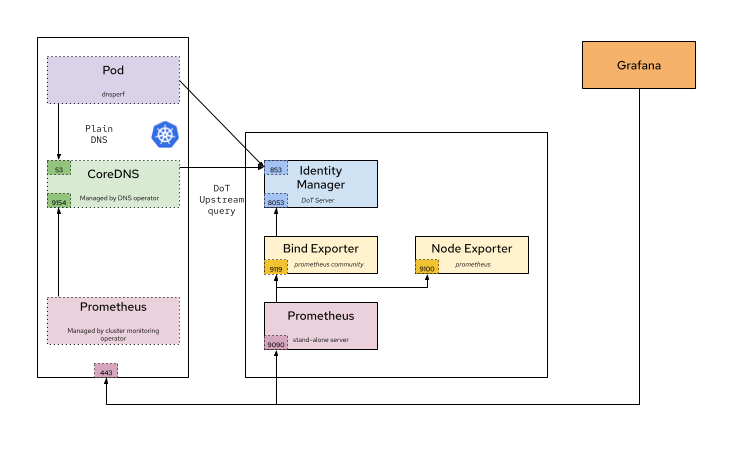
With this architecture, we look at these two scenarios:
- Workload testing is performed by a Pod from our Deployment, which executes queries directly against the IdM BIND server.
- Workload testing based on a Pod or Deployment executing queries aiming indirectly at the BIND IdM server, through the CoreDNS service in OpenShift.
For both scenarios, we compare the results when performing DNS UDP, TCP (only when aiming directly), and encrypted DNS (eDNS) tests.
Direct Resolution: UDP tests
We can run a DNS UDP test directly inside a Pod of our Deployment dnsperf-load using the following command:
[dnsperf-load-599754]# dnsperf -f inet -m udp \
-s demo-0.sandbox2980.opentlc.com -p 53 -T 4 -c 200 \
-q 1000 -l 120 -d /tmp/records.txt \
-O latency-histogram -O verbose-interval-stats -S 1 \
-O suppress=timeout,unexpected > dnsperf-result-udp-4.txt
As expected, after the first article's findings, the UDP test gives results considerably higher (over 300k QPS) than TCP or eDNS. This test produces the following summarized results:
Statistics:
  Queries sent:         36526221
  Queries completed:    36512058 (99.96%)
  Queries lost:         14163 (0.04%)
  Response codes:       NOERROR 36512058 (100.00%)
  Average packet size:  request 44, response 60
  Run time (s):         120.000646
  Queries per second:   304265.512037
  Average Latency (s):  0.001149 (min 0.000209, max 0.078807)
  Latency StdDev (s):   0.000878
The behaviour is highly stable during the whole test run, we're achieving a sustained rate of about 300-306k QPS. This environment is based completely on AWS, and we did not observe higher bursts at the beginning as we did in our tests of the first article.
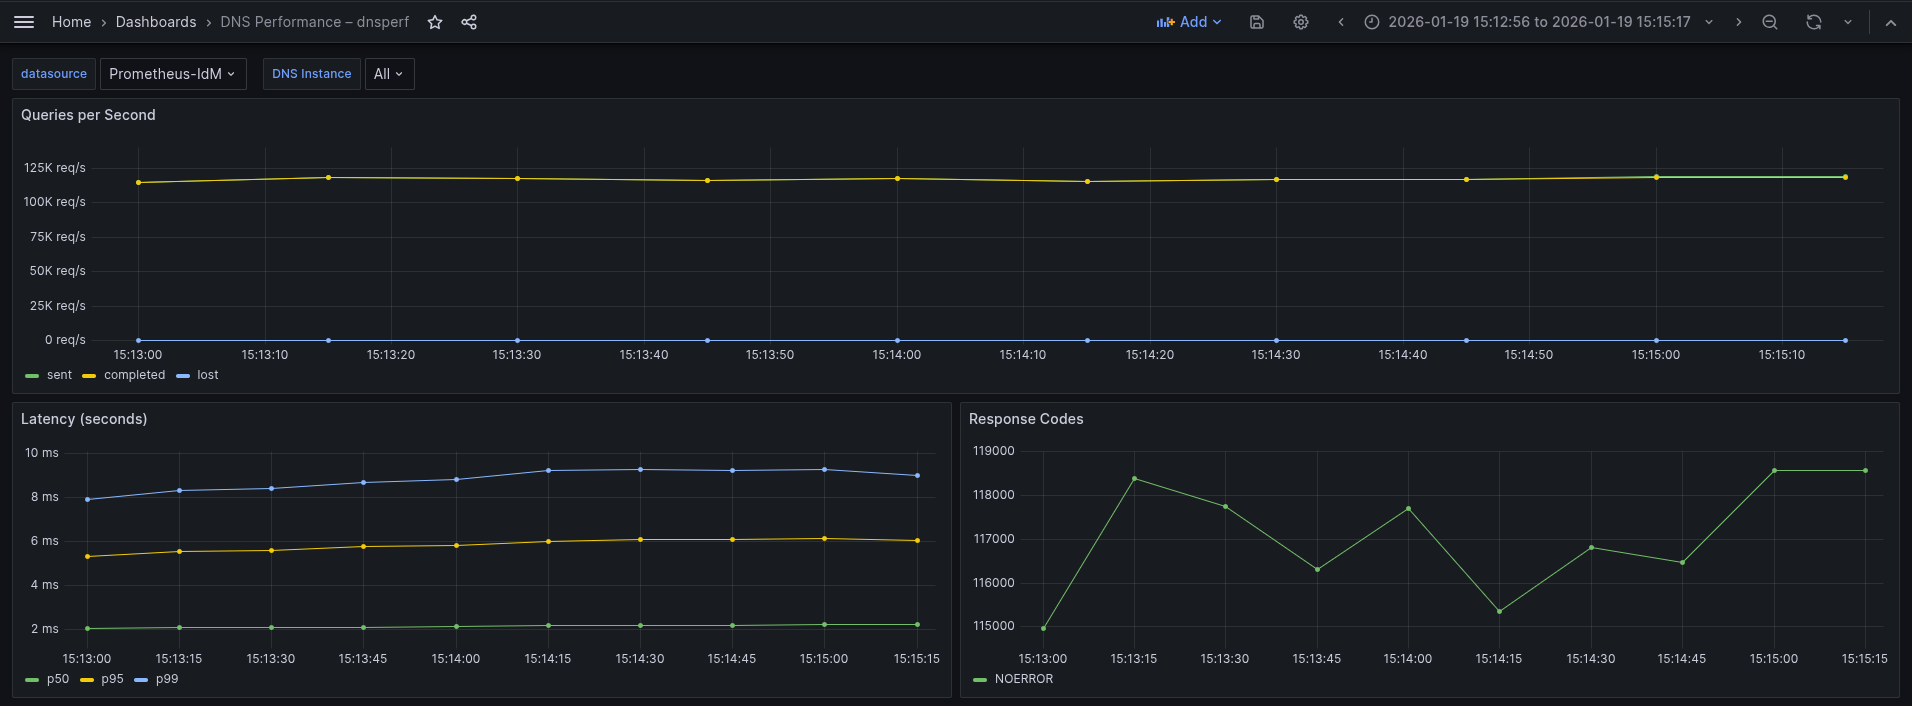
The results in the Grafana view are shown in Figure 2.
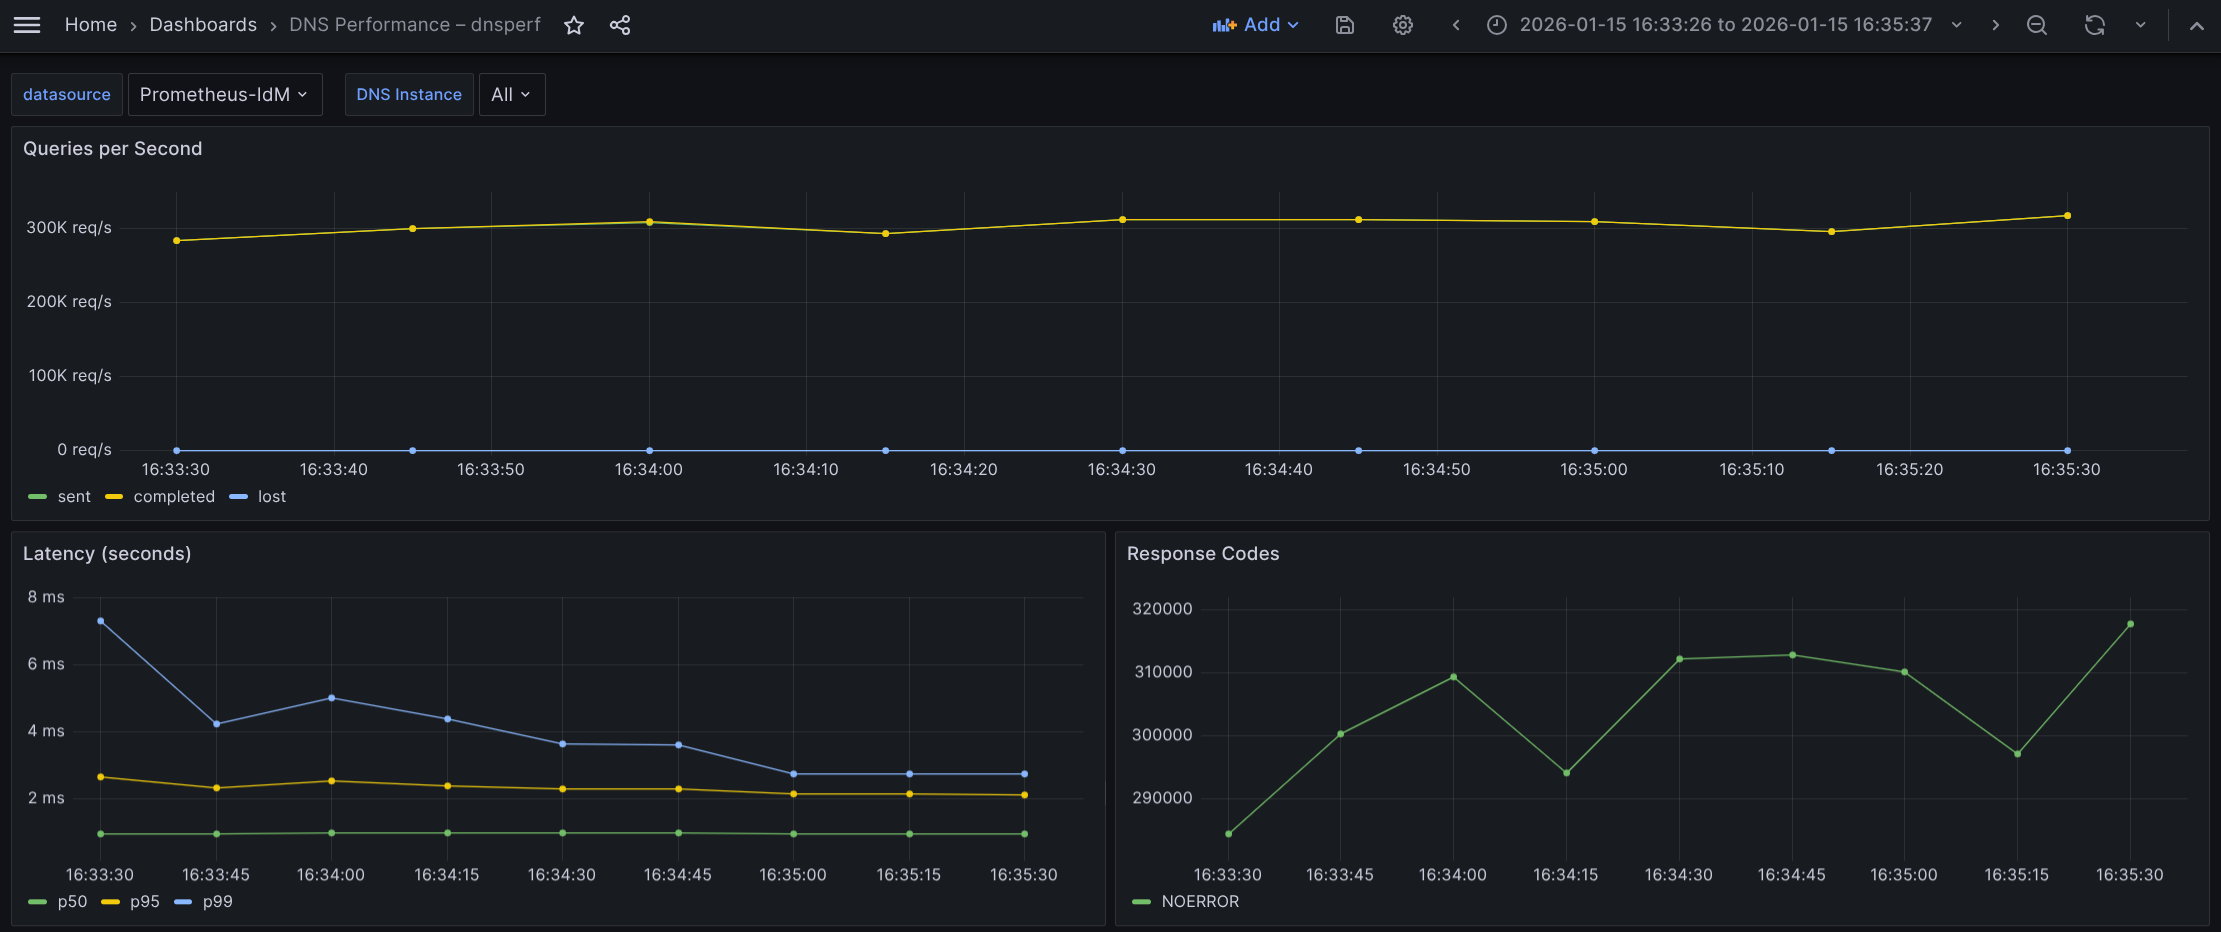
What the graph shows:
- Sustained throughput hovering (almost a flat line) closely around 300k QPS throughout the observed interval of 2 minutes.
- Completed and Sent queries appear to overlap perfectly, indicating a 1:1 ratio between requests sent and answers received.
- Lost queries (blue) remain effectively at zero (a flat line at the bottom) for the duration.
Interpretation:
- The flat, high-volume throughput curve indicates a stable, high-intensity load test.
- The system is successfully processing a massive volume of requests (~300,000 every second) without falling behind.
- The complete absence of lost queries confirms that the network bandwidth, UDP buffers, and the DNS application itself are not saturated. There is likely no packet dropping at the NIC or kernel level.
Conclusion: The system robustly sustains approximately 300k QPS under continuous load with zero packet loss, demonstrating significant performance capacity.
Latency
Regarding latency percentiles: This measure describes the distribution of query response times, ordered from fastest to slowest. The p50 (median) represents the time within which 50% of queries complete. The p95 indicates that 95% of queries complete within that time. Lastly, p99 reflects tail latency, where only 1% of queries take longer than the reported value (which is 1 of every 100 queries).
Based on the latency graph, we observe the following behavior:
- p50 latency (green) remains extremely low and perfectly stable, appearing to sit consistently below 1 ms (~970 µs).
- p95 latency (yellow) is stable and flat, hovering around 2.2 ms throughout the test.
- p99 latency (blue) shows a distinct downward trend. It starts higher at ~7.2 ms, drops quickly to ~4 ms, and eventually settles down to ~2.8 ms by the end of the test.
Interpretation:
- The p99 improvement (dropping from ~7.2 ms to ~2.8 ms) strongly suggests cache warming. As the test runs, the specific DNS records are likely being cached in memory, or the CPU branch prediction is optimizing for the hot code path.
- The gap between p95 and p99 narrows significantly towards the end. Initially, the tail (p99) is 3x p95, but they are nearly adjacent at the end. This indicates that the system is becoming more deterministic and stable as the test progresses.
- p50 being sub-millisecond (microsecond) indicates that the best path for a query is incredibly fast, likely serving purely from RAM without disk I/O or heavy computation.
Conclusion: Latency is excellent. The system demonstrates a "warm-up" phase, where tail latency improves drastically over the first 60–90 seconds. By the end of the test, the system is highly stable with minimal jitter (latency fluctuation), effectively answering even the slowest 1% of queries in times below 3 ms.
Direct Resolution: TCP tests
All experiments conducted with TCP showed a consistent reduction in QPS, at around ~25-27%. The TCP test can be run with the following command:
[dnsperf-load-599754]# dnsperf -f inet -m tcp \
-s demo-0.sandbox2980.opentlc.com -p 53 -T 4 -c 200 -q 1000 \
-l 120 -d /tmp/records.txt -O latency-histogram \
-O verbose-interval-stats -S 1 \
-O suppress=timeout,unexpected > dnsperf-result-tcp-4.txt
This gives us the following results:
Statistics:
  Queries sent:         30376311
  Queries completed:    30376311 (100.00%)
  Queries lost:         0 (0.00%)
  Response codes:       NOERROR 30376311 (100.00%)
  Average packet size:  request 44, response 60
  Run time (s):         120.046070
  Queries per second:   253038.779195
  Average Latency (s):  0.003886 (min 0.000239, max 0.253625)
  Latency StdDev (s):   0.003251
Here, we observe a clear and sustained rate at around 250k of QPS. CPU consumption is higher, reaching 97.8% (UDP achieved 95% maximum), which is due to the extra processing time required by TCP. We used more, but less efficient, CPU cycles than the corresponding UDP test.
The Grafana view is shown in Figure 3.
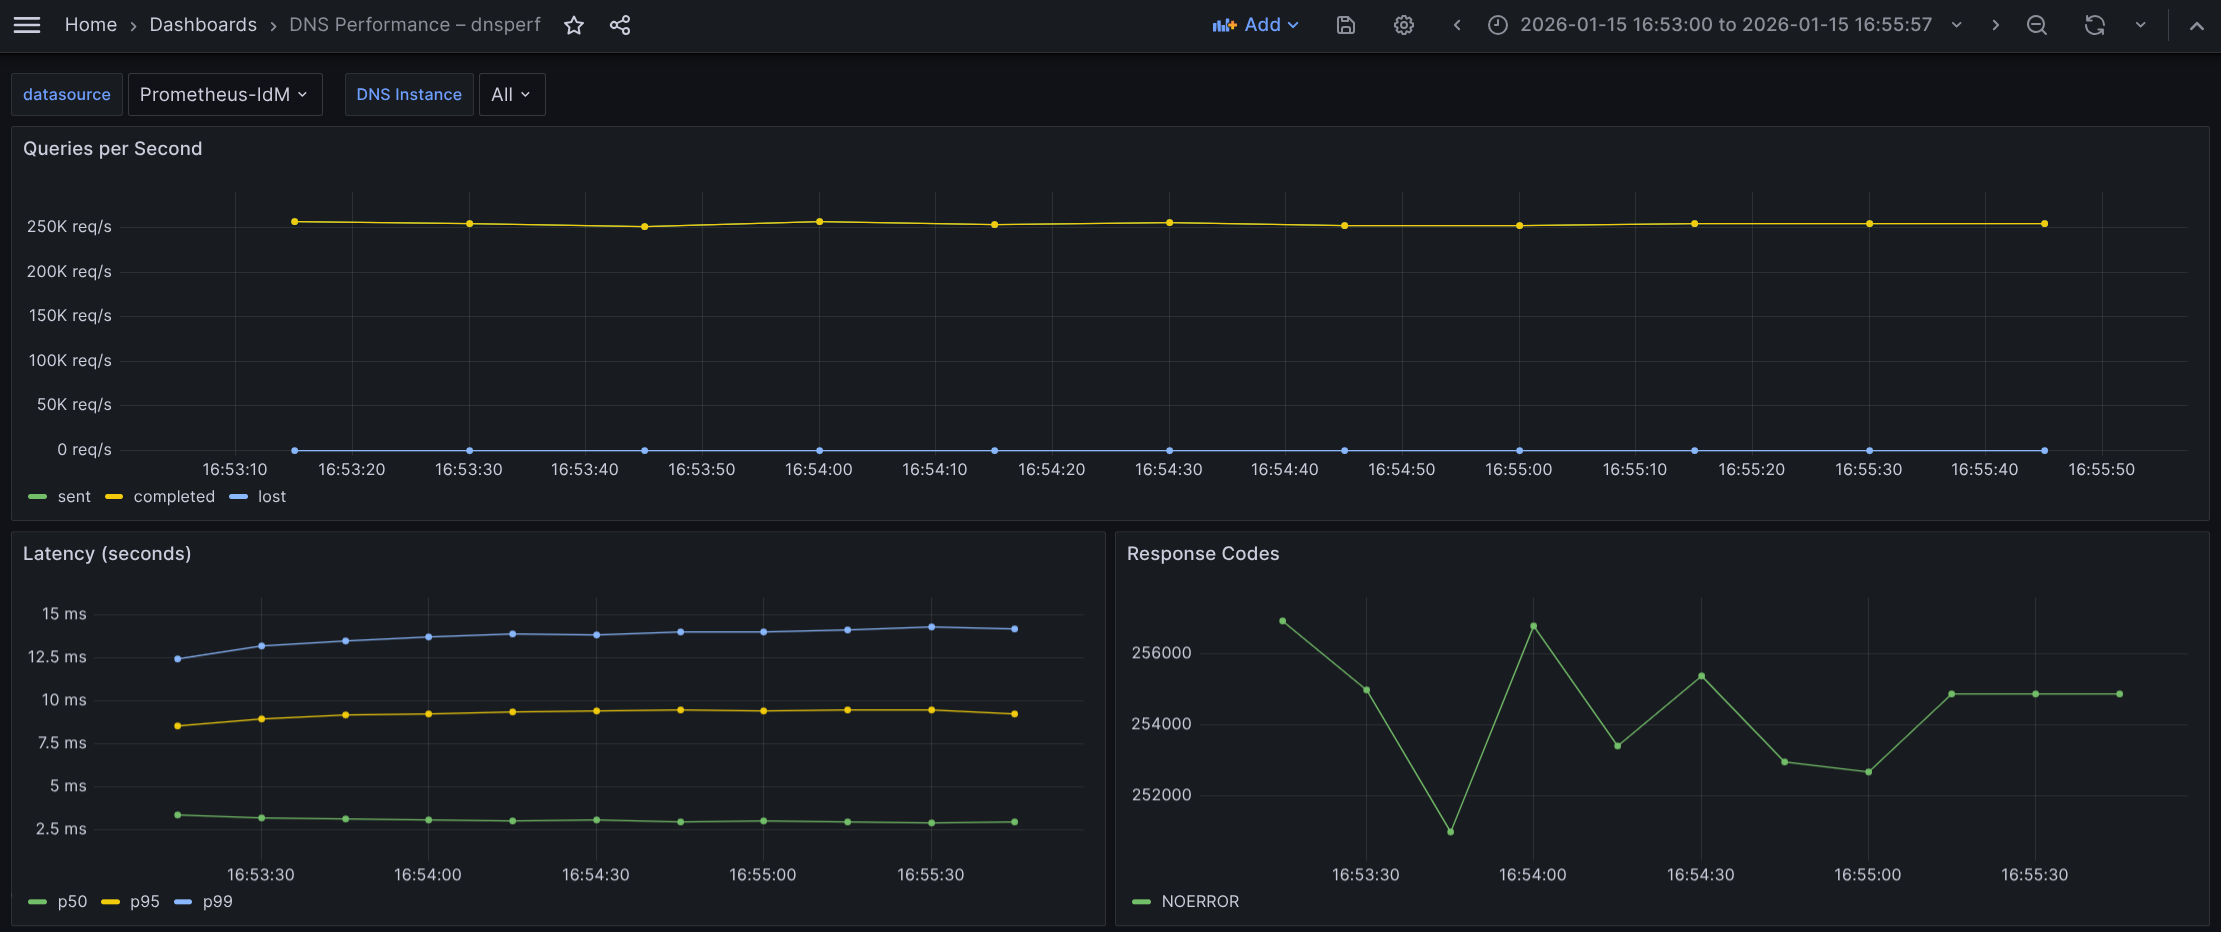
What the graph shows:
- Sustained throughput of ~250k QPS. This is lower than the UDP test of ~300k, but remarkably stable (last stabilization at 255k QPS).
- Sent and completed queries overlap, indicating the server is successfully accepting TCP connections, processing the query, and returning the response without dropping the connection.
- Lost queries remain at zero.
Interpretation:
- The drop from 300k (UDP) to 255k (TCP) is the expected "TCP tax". For every DNS query, the system is now processing the known extra packets for ACK and other TCP overhead.
- Achieving 255k QPS over TCP is a high-performance result. The BIND server is dispatching requests without much overhead related to the UDP socket.
- The flat throughput confirms that despite the overhead, the server is not hitting a hard limit on accepting new connections.
Conclusion: The system is sustaining a massive rate of 255k TCP transactions per second, handling the connection overhead robustly without dropping packets.
Latency
Regarding latency percentiles: We can confirm that this is the most penalized factor on the p95 and p99 area. In a TCP context, the baseline latency is naturally higher than UDP because the "clock" for a query often starts before the TCP connection is fully established. The client must wait for the server to acknowledge the connection before sending the actual DNS query.
Based on the latency graph, we observe the following behavior:
- p50 (median) is ~3.0 ms: This is significantly higher than the UDP test (~0.8 ms). The ~2 ms difference represents the round-trip time (RTT) required for a TCP ACK. This is normal behavior.
- P95 latency is about 9.2-9.4 ms.
- p99 (tail latency) is rising: Unlike the UDP test (where latency improved or warmed up), the p99 here is degrading, rising from ~12.5 ms to ~14.2 ms over the 2-minute window.
Interpretation:
- The rising p99 indicates resource accumulation or fatigue. This may happen because, in TCP, the server and client must track package windows for every active connection in the kernel.
- The upward trend suggests the system is suffering from state accumulation. This is likely due to:
- TCP polling: Threads getting messages from established connections that are empty are usually put to sleep for some milliseconds, which can impact latencies on some particular situations.
- Buffer contention: TCP socket buffers filling up faster than the application can drain them under this specific load.
Conclusion: While the server is keeping up with the volume (throughput is flat), the user experience is slowly degrading for the slowest 1% of queries (p99). The rising tail latency is a classic sign of TCP resource exhaustion rather than application CPU limits.
Direct Resolution: DNS over TLS (DoT) tests
The command used for the DNS over TLS (DoT) test:
[dnsperf-load-599754]# dnsperf -f inet -m dot \
-s demo-0.sandbox2980.opentlc.com -p 853 -T 4 -c 200 \
-q 1000 -l 120 -d /tmp/records.txt -O latency-histogramam \
-O verbose-interval-stats -S 1 \
-O suppress=timeout,unexpected > dnsperf-result-dot-4.txt
The results:
Statistics:
  Queries sent:         22596146
  Queries completed:    22596146 (100.00%)
  Queries lost:         0 (0.00%)
  Response codes:       NOERROR 22596146 (100.00%)
  Average packet size:  request 44, response 60
  Run time (s):         120.046531
  Queries per second:   188228.229602
  Average Latency (s):  0.005152 (min 0.000250, max 0.084406)
  Latency StdDev (s):   0.003918
DNS over TLS (DoT) tests revealed that this is, as expected, the most penalized of the three in terms of latency and QPS, showing a sustained rate around ~188-191k QPS.
The Grafana view is shown in Figure 4.
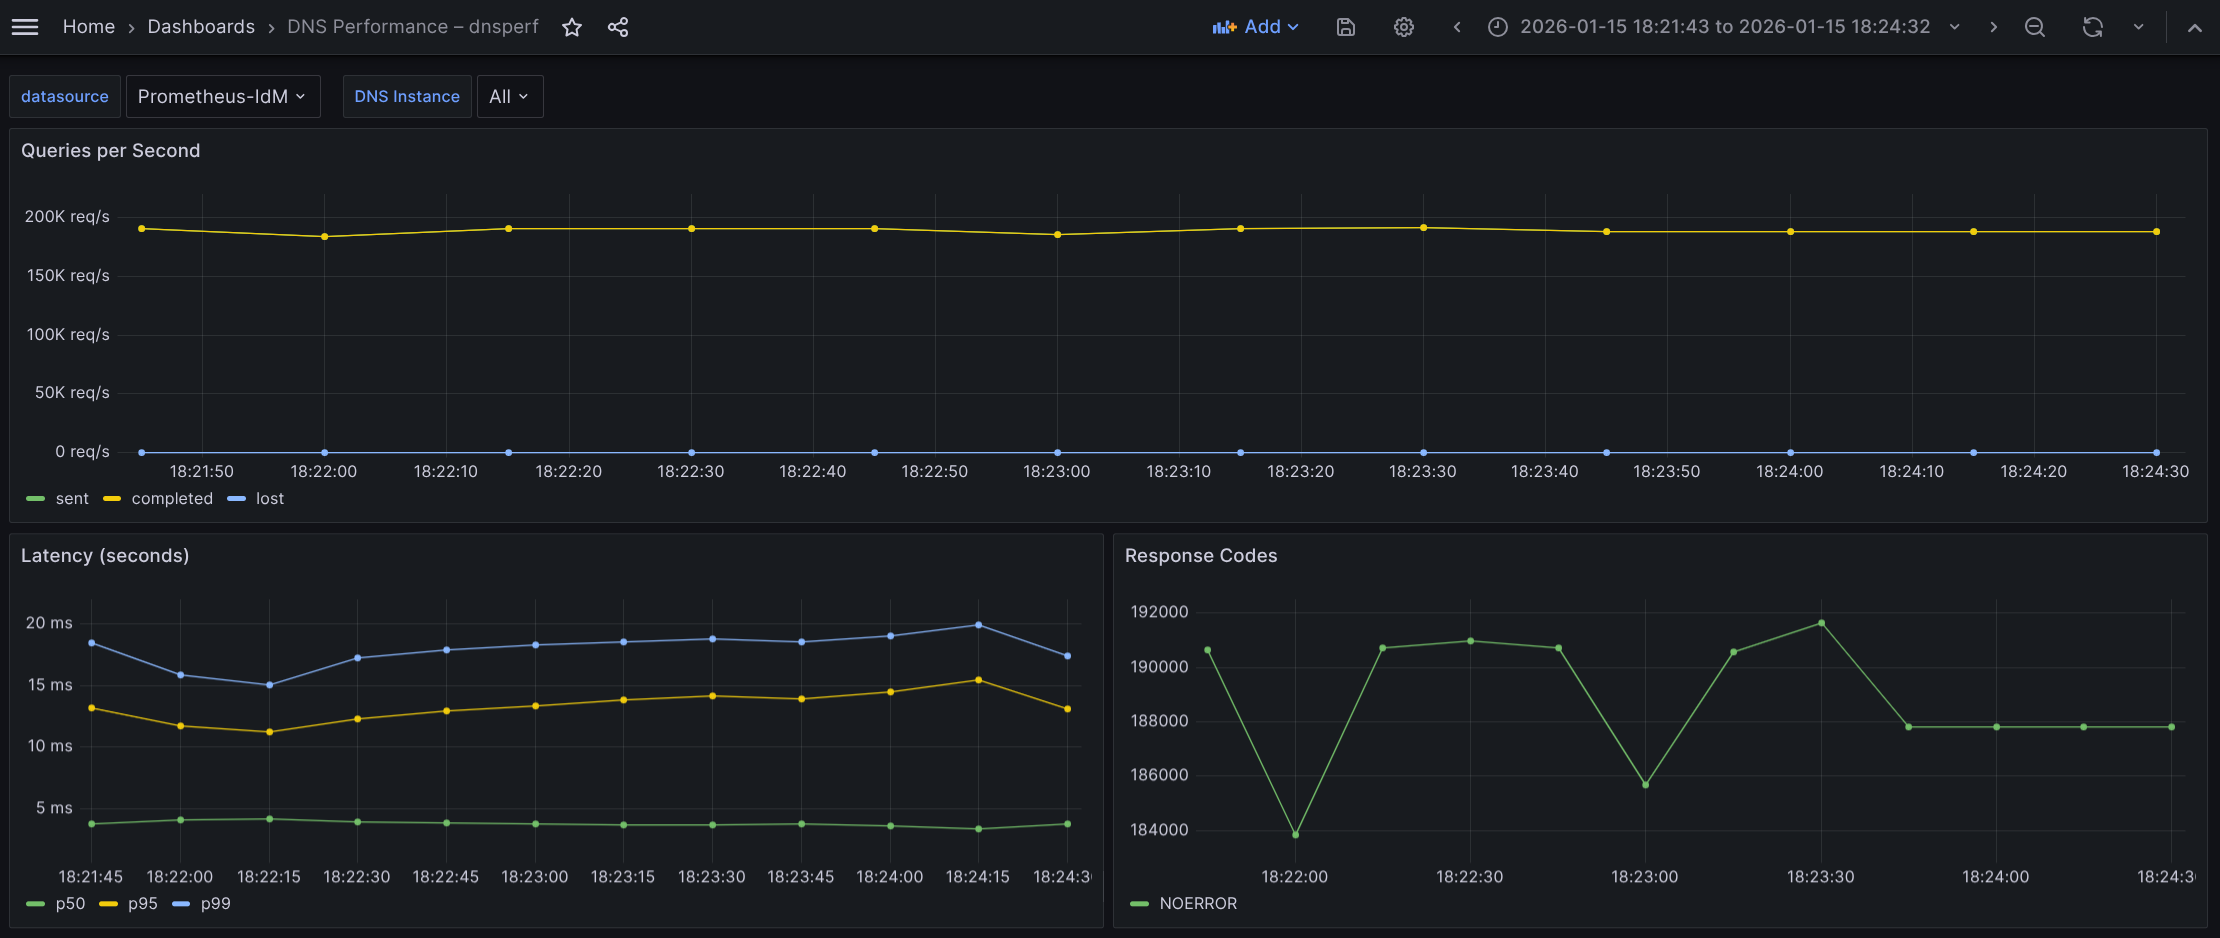
What the graph shows:
- Sustained throughput has dropped to approximately ~190k QPS.
- Compared to the UDP baseline of 300k QPS, this is a substantial drop.
- Compared to the TCP baseline of 250k QPS, this is a moderate drop.
- The throughput is extremely stable (flatline), with Sent and Completed queries overlapping perfectly.
- Lost queries remain at zero.
Interpretation:
- We can confirm the capacity loss (the "security cost" or "encryption penalty"):
- Compared to UDP: We're losing ~37% of raw capacity (190k vs. 300k) to add encryption and reliability.
- Compared to TCP: We're losing ~23% of capacity (190k vs. 250k) specifically due to the TLS encryption overhead (TCP already accounts for the connection overhead).
- The fact that the line is flat indicates that even at 190k QPS, the CPU is managing the cryptographic load without crashing, although it is working very hard.
Conclusion: The system sustains 190k QPS with encryption. While this is significantly lower than UDP or TCP, it represents a strong performance for a secure protocol.
Latency
Regarding latency percentiles: The distribution here tells a story about how TLS works. We see a huge split between the median (p50) and the tail latency (p99):
- p50 (median) remains low, hovering around 3.6-3.8 ms (green), just a little bit more than TCP tests.
- p95 (yellow) jumps drastically to ~12-15.4 ms.
- p99 (tail) sits high but always lower than 20 ms, mostly in the range 18-20 ms.
Interpretation:
- The DoT median is 5x slower than UDP and ~33% slower than TCP. The jump from TCP (3 ms) to DoT (3.6-3.8 ms) represents the computational cost of decrypting the request and encrypting the response for the average packet.
- Tail latency (p99):
- Compared to UDP: The tail latency is ~5-6x higher. This is the cost of the handshake plus encryption for new connections.
- Compared to TCP: The DoT tail (~20 ms) is higher than the TCP tail (~14 ms).
Conclusion: Adding TLS (DoT) introduces a consistent latency penalty. We paid ~0.6-0.8 ms extra per query on average (compared to TCP) for encryption, and ~6 ms extra for the worst-case scenario.
Comparative benchmarks of Direct Resolution scenario
Here is a comparative summary based on the performance data for the UDP, TCP, and DNS over TLS (DoT) tests:
| Metric | UDP | TCP | DNS over TLS (DoT) |
|---|---|---|---|
| Queries per Second (QPS) | 304-306k | 250-255k | 190-192k |
| Query Average Latency (p50) | ~970 µs | ~3 ms | ~3.6-3.8 ms |
| Tail Latency | 2.8-7.2 ms | 12.5-14.2 ms | 18-20 ms |
The data clearly illustrates the "tax" paid for moving from a simple stateless protocol to a secure, encrypted one.
UDP → TCP (reliability cost)
- Drop: ~53k QPS (17%)
- Adding connection state (handshakes, teardowns, and kernel tracking) reduces maximum throughput by roughly 17%. This is the cost of ensuring packet delivery (reliability).
TCP → DoT (encryption cost)
- Drop: ~61k QPS (~23-24%)
- Adding TLS encryption on top of TCP consumes an additional quarter of the system's capacity. This is purely CPU overhead for cryptographic operations.
Total capacity impact (UDP → DoT)
- Drop: ~114k QPS (~37%)
- To run an encrypted DNS service, you must provision approximately 40% more infrastructure or scale up the hardware, to match the query volume of a standard UDP setup.
Latency
Regarding latency, the p50 represents the usual experience:
- UDP (∼0.97 ms): Extremely fast, sub-millisecond or microseconds response.
- TCP (∼3.0 ms): Latency triples (+209%). The physics of TCP requires a full round-trip handshake before data flows of roughly 3 ms.
- DoT (∼3.8 ms): Latency increases by another ~23% over TCP.
- The jump from TCP to DoT is relatively small (only ~0.8 ms). This confirms that for established connections, encryption is fast. The CPU decrypts packets quickly enough that the user barely notices the difference compared to plain TCP.
The p99 highlights the cost of worst case scenarios and system stress:
- UDP (2.8–7.2 ms): Even the slowest UDP queries are processed in single-digit milliseconds.
- DoT (18–20 ms): The worst-case latency is ~5-6x higher than UDP.
- This ~20 ms delay is dominated by the TLS handshake, which you see in the closer values between TCP and DoT. This is the most significant bottleneck in the system.
Conclusions of Direct Resolution
- Viability: The system is highly capable. Sustaining 190k QPS over encrypted DoT is an impressive result, proving the infrastructure handles the "crypto tax" well without collapsing.
- Scaling rule of thumb: If migrating traffic from UDP to DoT, expect to lose ~37% of your max QPS capacity and see average latency increase from ~1 ms to ~4 ms.
Indirect Resolution
The next scenario evaluates performance under a workload where DNS queries are not sent directly to the IdM BIND server, but are instead forwarded through the OpenShift cluster's CoreDNS service. In this setup, query resolution occurs in two stages (which we refer to as "legs"). first, queries are sent from the application Pod within the Deployment to the CoreDNS server (leg 1), and then CoreDNS forwards those queries to the IdM BIND server for resolution (leg 2). For more detail, refer to figure 1.
The Go-based CoreDNS cannot forward packets as fast as the C-based BIND, so we must assume that we cannot reach the same QPS as in previous tests. We are limited by the physical maximum speed of a single CoreDNS instance (which is single-threaded Go) processing packets. CoreDNS is called though a load balancer with a special open virtual network (OVN) rule that calls at the same node where our Pod is running (unless this CoreDNS is down for whatever reason). It does not make sense to try to improve performance of the CoreDNS running on the same node as our Pod, because this is the behavior by default.
Our architecture is a DNS protocol gateway (or proxy):
Leg 1 (client Pod → CoreDNS)
This is always using a clear protocol (port 53).
The OpenShift DNS service (172.30.0.10) listens on port 53 and prefers UDP as the transport protocol. It falls back to TCP only if the response size exceeds the negotiated UDP buffer size (typically handled with EDNS0, which allows payloads larger than the traditional 512 bytes). In such a case, the initial UDP response from the upstream IdM server arrives with the truncated (TC) bit set. Upon receiving this flag, the OpenShift CoreDNS resolver immediately re-initiates the connection using the TCP protocol to retrieve the full response. Based on our observations, this fallback is not currently occurring in our environment. This indicates that our IdM BIND server's responses with our test data are consistently staying within the UDP packet size limits allowed by the network and configuration. This would only fall back were we using extensive SRV or TXT resource records, but that's not the case.
Port 853 is not being used. Inside the cluster (Pod-to-Pod), traffic is considered trusted (or protected by mTLS/NetworkPolicies), so it uses fast, standard DNS (port 53).
Leg 2 (CoreDNS → IdM)
This section may (using DoT) or may not (using UDP) be encrypted.
- CoreDNS receives cleartext "always" query from the Pod.
- It upgrades the protocol as needed.
- It can initiate the TLS handshake with IdM on port 853 if required (and configured to do so). If not, queries are sent on port 53 UDP to IdM (or TCP if the size exceeds the limit).
- Leaving the cluster (CoreDNS-to-IdM), traffic crosses the untrusted data center network, so CoreDNS encrypts the traffic outbound to the IdM BIND.
- As a consequence, in this second leg we can perform tests with the IdM backend in an encrypted and unencrypted configuration, so we're using a hybrid approach model (later, we will see this factor is not a limiter).
With this configuration established, we're positioned to execute two distinct performance tests. Because the DNS policy in IdM is set to relaxed, we can compare the following scenarios:
- Test 1 (pure UDP baseline): An end-to-end unencrypted flow where the client Pod connects to CoreDNS over UDP (leg 1), and CoreDNS forwards the query to IdM using standard UDP (leg 2).
- Test 2 (hybrid DoT): A secure upstream configuration where the client Pod still uses UDP (leg 1), but CoreDNS communicates with the IdM backend over an encrypted TLS connection on port 853/TCP (leg 2).
Both scenarios conform to our Indirect Resolution category.
Indirect Resolution: UDP tests from Pod client to CoreDNS (leg 1) against IdM UDP (leg 2)
The first thing to notice is that we should reconfigure DNS to use plain UDP, according to this article so that the second segment (leg 2) is unencrypted. To do that, do a backup of the current configuration:
$ oc get dns.operator.openshift.io/default \
-o yaml > dns-config-backup.yaml
Next, change the DNS operator to reach the IdM server using plain DNS:
$ oc edit dns.operator.openshift.io/defaultRemove the following transportConfig section (inside the forwardPlugin block):
  transportConfig:
        tls:
          caBundle:
            name: dns-ca
          serverName: demo-0.sandbox2980.opentlc.com
        transport: TLS
And change port 853 in upstream servers to 53:
      upstreams:
      - 10.0.200.25:53
With that change, the operator regenerates the Corefile configuration file for CoreDNS, which is stored in dns-default configMap in the openshift-dns namespace. In that way, it reverts to the default configuration forwarding behavior for CoreDNS using port 53. You have to wait a few seconds until the operator finishes generating the Corefile. You can get the status with this command:
$ oc get clusteroperators dns
NAME   VERSION   AVAILABLE   PROGRESSING   DEGRADED   SINCE   MESSAGE
dns    4.20.6    True        True          False      4h46m   DNS "default" reports Progressing=True: "Have 0 up-to-date DNS pods, want 1."
It may take several seconds until the operator has upgraded the corresponding Pods. Look for the False status in the PROGRESSING column:
$ oc get clusteroperators dns
NAME   VERSION   AVAILABLE   PROGRESSING   DEGRADED   SINCE   MESSAGE
dns    4.20.6    True        False         False      30m
Once you see that, take a look at the generated Corefile:
$ oc get configmap/dns-default -n openshift-dns -o yamlYou don't see the TLS section because we are in a pure UDP environment now, where both legs are using UDP (or to be more precise, leg 2 only uses UDP when the packet is not too large, which is true in these tests). Run the following command inside a Pod deployed in your OpenShift cluster:
[dnsperf-load-599754# dnsperf -f inet -m udp -s 172.30.0.10 \
-p 53 -T 4 -c 200 -l 120 -d /tmp/records.txt -q 1000 -O latency-histogram \
-O verbose-interval-stats -S 1 \
-O suppress=timeout,unexpected > dnsperf-result-udp-coredns4.txt
The Grafana view is shown in Figure 5.
What the graph shows:
- Sustained throughput stabilizes at approximately 119k QPS.
- The lines for Sent (green) and Completed (yellow) overlap perfectly and are remarkably flat, indicating strictly linear processing without buffering issues.
- Lost queries remain flat at zero throughout the entire 2-minute test window.
- This UDP flow is essentially a flat line, showing consistent and stable packet forwarding.
Interpretation:
- Lightweight protocol: While UDP is a "lighter" protocol, the throughput (~117-119k QPS) reflects the processing limit of the intermediary CoreDNS. This can be considered as the "forwarding tax". Every packet here must be received by CoreDNS, parsed, and forwarded to IdM. We're hitting the CPU limit processing per packet of the CoreDNS Pod, long before saturating the UDP network capacity (this is crucial in the second test).
- Reliability vs. capacity: Despite the high load, the system shows 0% packet loss. This confirms that the CoreDNS Pod is sized correctly to handle this specific volume without dropping UDP packets, but it cannot push beyond this ceiling in its current configuration.
- Protocol efficiency: The graph lacks the "warm-up" curve often seen in TCP tests. This demonstrates the "stateless" nature of UDP, no handshakes required to start the flow.
Conclusion: The architecture sustains 117-119k QPS with the "double-hop" UDP configuration. While the raw throughput is lower than the DoT example in the Direct Resolution tests, this is due to the specific resource constraints of the CoreDNS hop in this test.
Latency
We have seen good results in this test. The distribution here highlights the raw speed of unencrypted UDP traffic:
- p50 (median) is extremely low and flat, sitting consistently at ~2.20 ms (green).
- p95 (yellow) hovers around ~5.5-6.12 ms.
- p99 (tail) remains generally stable below 9.29 ms, with very minor fluctuations.
Interpretation:
- Raw speed: The p50 of 2.20 ms is nearly 50% faster than the DoT baseline (which was ~3.8 ms) even with the extra hop in between. This 1.8 ms difference represents the savings of removing the TLS handshake and encryption/decryption CPU cycles from the loop.
- Tight latency spread: The gap between the median (p50 at ~2.2 ms) and the tail (p99 at ~9 ms) is relatively small (~7 ms). Without the complexity of TCP retransmissions or TLS session tickets, the worst case scenarios in UDP are much closer to the average scenario. The jitter is strictly network/CPU queuing, not protocol overhead.
Conclusion: Using pure UDP flow (through CoreDNS) delivers lower latency. We're saving nearly ~2 ms per query on average compared to DoT direct test, and strictly capping tail latency under 10 ms (vs. 20 ms in the DoT direct test). This confirms UDP as the superior choice for latency-sensitive workloads, provided the security trade-off is acceptable.
Indirect Resolution: UDP tests from Pod client to CoreDNS (leg 1) against IdM eDNS (leg 2)
For this test, you must revert the configuration of the Corefile configuration file stored in the dns-default configMap in the openshift-dns namespace, to aim for IdM using eDNS port 853. To do that, follow the same steps as before, but add the section previously removed.
$ oc edit dns.operator.openshift.io/defaultAdd the following transportConfig block indented under the forwardPlugin line:
  transportConfig:
        tls:
          caBundle:
            name: dns-ca
          serverName: demo-0.sandbox2980.opentlc.com
        transport: TLS
At last, you need to change the port 53 to the encrypted one 853 in upstream servers line:
      upstreams:
      - 10.0.200.25:853
After done that, you can see that the change is effective by checking the redeployment of the Pods in the openshift-dns namespace and looking at the new values in:
$ oc get configmap/dns-default -n openshift-dns -o yamlAnd now, we are ready to perform our second test using the hybrid approach consisting in plain DNS UDP traffic for the first leg (between the client Pod and CoreDNS), and encrypted DNS (eDNS) for the second leg (between CoreDNS and IdM BIND). The command used is the same as the previous one, because the encapsulation and upgrading of the protocol happens after the first hop, and this is transparent to the dnsperf command:
[dnsperf-load-599754# dnsperf -f inet -m udp -s 172.30.0.10 -p 53 -T 4 -c 200 \
-l 120 -d /tmp/records.txt -q 1000 -O latency-histogram \
-O verbose-interval-stats -S 1 \
-O suppress=timeout,unexpected > dnsperf-result-udp-corednseDNS4.txt
The Grafana result is shown in Figure 6.
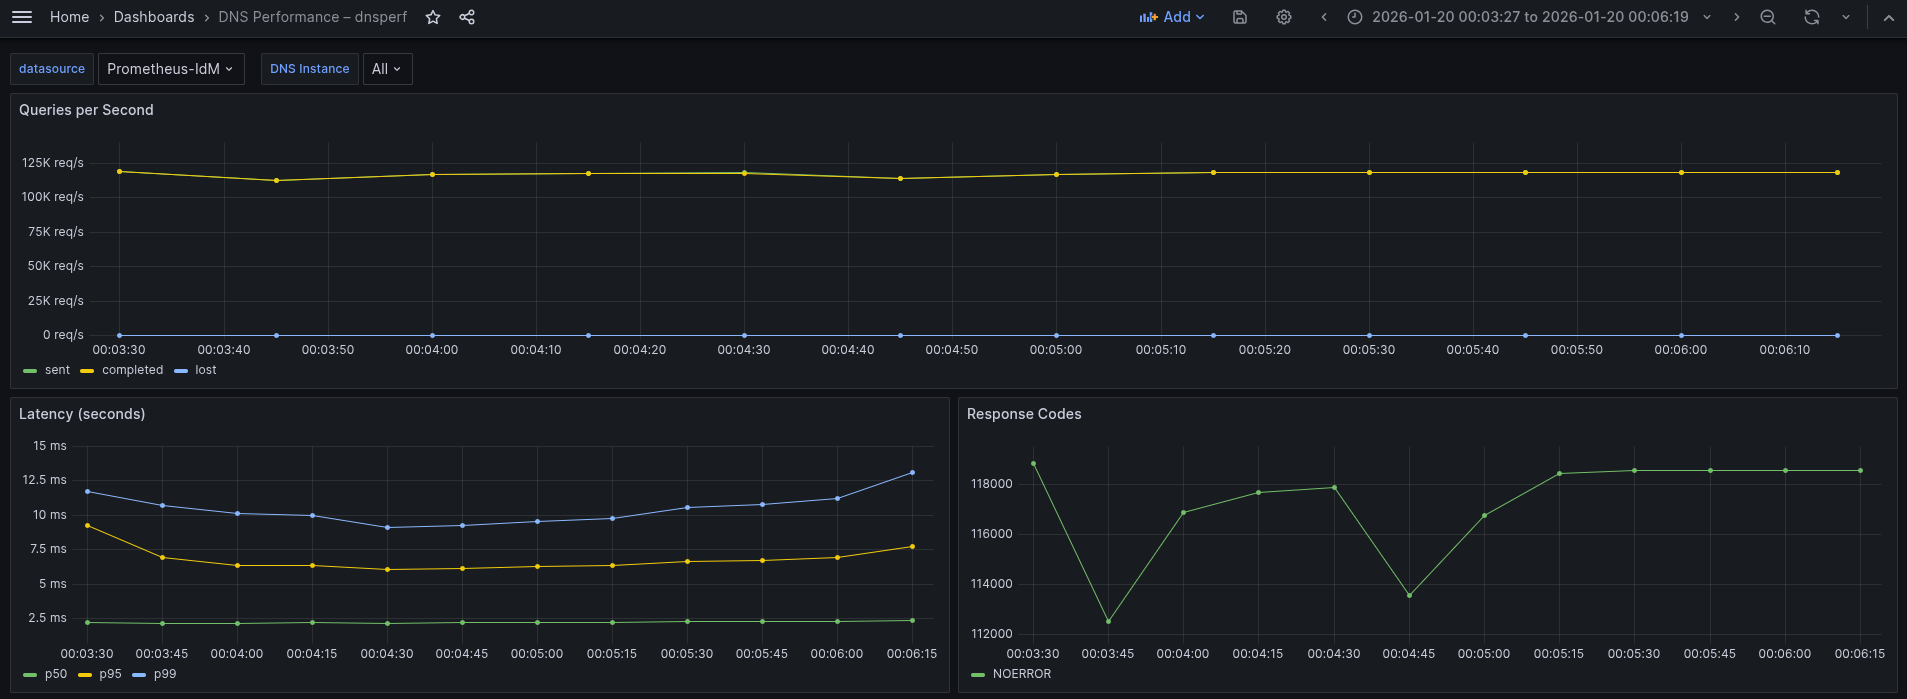
This is almost the same graph as we've seen previously when both legs are using UDP.
What the graph shows:
- Sustained throughput stabilizes at approximately 117-119k QPS.
- The throughput line is perfectly flat and stable. Sent and Completed overlap completely, and Lost queries remain at zero.
- In comparison to UDP baseline, this result (~117-119k QPS) is virtually identical to the previous pure UDP test (~117-119k QPS).
Interpretation:
- The throughput didn't drop compared to the UDP test. This indicates that the bottleneck is not the encryption.
- Since both the UDP test and this hybrid (DoT) test are capped at roughly the same level (~117-119k), the system is hitting a limit before encryption becomes a problem. This is likely the CPU packet processing limit of the CoreDNS Pod receiving the initial UDP traffic.
- The CoreDNS Pod is handling the encryption of 119,000 QPS outgoing to IdM with no trouble. It is effectively hiding the cost of TLS behind the packet processing limit.
Conclusion: The system sustains 119k QPS in this hybrid mode. We have successfully secured the upstream traffic to IdM with zero observable loss in capacity compared to the plain UDP configuration. The architecture is highly efficient, likely reusing persistent TLS connections to the IdM server to avoid handshake overhead.
Regarding latency profiles, this run reveals the realistic jitter of secure TCP connections compared to the perfect run we saw earlier.
- p50 (median) stays at an impressive ~2.37 ms (green). This matches the unencrypted UDP baseline almost exactly.
- p95 (yellow) is stable but slightly elevated, hovering between 6.5 ms and 7.72 ms.
- p99 (tail) unlike the flat line in the previous test, here the tail starts at 12 ms, dips to 9 ms, and rises back to 13.1 ms.
Interpretation:
- There is no cost for encrypting the upstream leg. The fact that the median remains at ~2.37 ms confirms that for the vast majority of traffic, the existing TLS connections to the IdM backend are being reused efficiently (pipelining). There is no handshake penalty for 50% of the traffic.
- The p99 latency here (~13.1 ms) is slightly higher than the previous best-case run (~9.29 ms). This behavior is typical for DoT (DNS over TLS). Unlike a UDP pure flow, the upstream leg here relies on TCP. At 119,000 QPS, occasional TCP windowing, segment reassembly, or minor garbage collection pauses in the IdM backend can cause slight delays for the 1% of packets.
- Even with this jitter, a worst-case latency of 13.1 ms for an encrypted, double-hop query is an exceptional result.
Comparative benchmarks of Indirect Resolution scenario
This is a summary of the performance data for the pure UDP flow and hybrid TLS (DoT) tests:
| Metric | Pure UDP | Hybrid DoT |
|---|---|---|
| Queries per Second (QPS) | 117-119k | 117-119k |
| Query Average Latency (p50) | ~2.2 ms | ~2.37 ms |
| Tail Latency | 9.29 ms | 13.1 ms |
Conclusions of Indirect Resolution
In summary, the Indirect Resolution tests have demonstrated:
- Both configurations achieved an identical sustained throughput of 117-119k QPS.
- Enabling TLS encryption on the upstream leg does not incur any penalty. CoreDNS reaches the CPU packet processing limit before the computational cost of encryption becomes a bottleneck.
- The average p50 latency increased marginally from 2.2 to 2.37 ms.
- The encryption penalty is just 0.17 ms, which is virtually negligible. CoreDNS is effectively reusing persistent TCP/TLS connections (pipelining) to the IdM backend, eliminating the expensive TLS handshake for the vast majority of requests. This difference is imperceptible to applications. This led us to confirm that IdM can scale extremely well, the limiting factor is CoreDNS and as such is out of the IdM BIND domain.
- Tail latency (p99) in the worst case rises from 9.29 to 13.1 ms. This is a penalty of ~4 ms in the worst case scenario, even in that situation tail latency is extremely low and fits well within the safety margins for latency-sensitive applications
Conclusion
The hybrid DoT architecture is production-ready. It delivers the exact same throughput capacity as the insecure baseline with a latency impact that is statistically negligible for 99% of traffic. The security gain (encrypted credentials/queries) vastly outweighs the 4 ms increase in tail latency.
Because IdM is included in your RHEL subscription, you can try to replicate this content in your lab environment without any additional subscriptions. If you are not already a RHEL subscriber, get a no-cost trial from Red Hat.