Welcome to another installment of "What's new in network observability." This article covers network observability 1.11 released in the same time frame as Red Hat OpenShift Container Platform 4.21. However, it is also backwards-compatible with the older supported versions of OpenShift Container Platform. While there is an upstream version of network observability, I will focus on using it with the Red Hat OpenShift web console. If you’re interested in earlier versions, read my previous What’s new in network observability articles.
New features
Network observability provides insights to your network traffic across your entire cluster. It collects and aggregates network flow data using eBPF technology. The data is enriched with Kubernetes context and stored in the form of Loki logs and/or Prometheus metrics. You can visualize this in the form of graphs, tables, and a topology view. It provides deep visibility and troubleshoots problems related to packet drops, latencies, DNS errors, and more.
To try this out, you'll need a Kubernetes cluster, preferably an OpenShift cluster, and the oc or kubectl command line on your computer. Follow the instructions to install the network observability operator.
I will discuss the following changes and new features in 1.11:
- Service deployment model
- FlowCollectorSlice CRD
- Zero-click Loki for non-production
- DNS name
- Improvements in network health
- Recording rules
- Enhanced filters
- Kubernetes Gateway object
Service deployment model
Minimally, to get network observability running, you need to deploy a FlowCollector custom resource or instance. In the OpenShift web console, click Ecosystem (formerly Operators in OCP 4.19 or earlier) on the left-hand side. Then click Installed Operators. On the right side, click the FlowCollector link. This brings up the FlowCollector wizard.
In the Deployment model field, there is a new Service option. It deploys FlowCollector using the Kubernetes deployment method and allows you to specify the number of replicas to run (Figure 1).
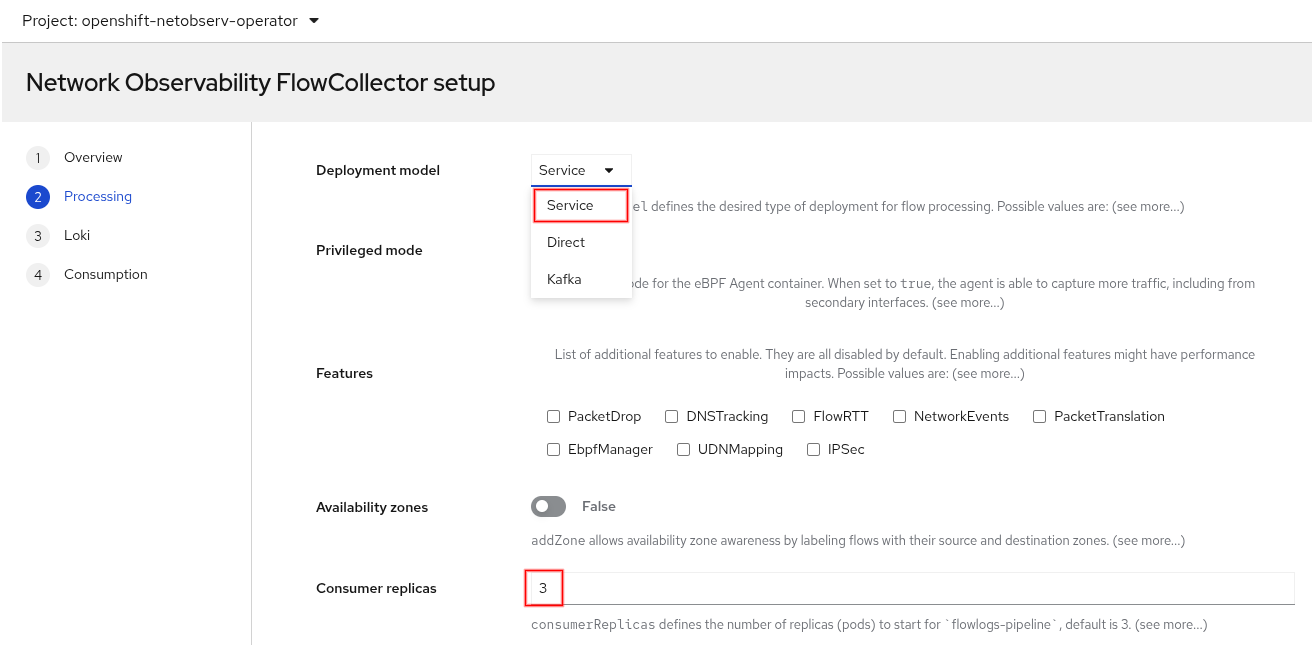
The Service model is sort of in between the two existing models, Direct and Kafka. The Direct model deploys as a DaemonSet, so it runs a flowlogs-pipeline pod on each node. The Kafka model is just like the Service model, except it supports Apache Kafka for better scalability. View the architectural diagrams of each model for more details.
The default setting is Service model with three flowlogs-pipeline pods. You may need more pods if your cluster has heavy traffic or uses a low sampling interval (that is, samples more data). For large clusters, it is still recommended to use the Kafka model.
The FlowCollectorSlice custom resource definition
While the Service model allows you to specify the number of flowlogs-pipeline pods, you still don't have much control over what and how much packet data to ingest. In 1.8, the eBPF flow filter feature allowed you to specify a CIDR, peer CIDR, and a sampling interval, but that is very low-level. Instead, what we want is to do this at the namespace level so it can support multitenancy.
A new custom resource definition (CRD) named FlowCollectorSlice lets you define one or more instances that include a namespace and optionally a sampling value and a list of subnet labels. A subnet label is simply a CIDR (e.g., 10.128.0.1/32) that's given a human-readable name. If you think of a project (or tenant) that consists of one or more namespaces, then each project can set their own sampling value and labels. Unlike the FlowCollector CRD configured by the cluster-admin, a typical use case for FlowCollectorSlice is to give RBAC access to a non-admin user, such as a project admin, so they can configure a FlowCollectorSlice instance for their namespaces.
Before we dive into this, I want to point out that in OpenShift, there are at least two ways to configure something. You can use the OpenShift web console and go to the appropriate panel and fill out a form. You can also click the "+" at the top next to your username, select Import YAML, and paste YAML into the window. Alternatively, you can run the oc command, such as oc apply -f <file> where <file> is the YAML file. In some cases, I'll show both. But other times for brevity or simplicity, I will only show one method.
Figure 2 shows the form view of the OpenShift web console for creating a FlowCollectorSlice. You can get to this panel from Ecosystem > Installed Operators. In the network observability row, click the FlowCollectorSlice link.
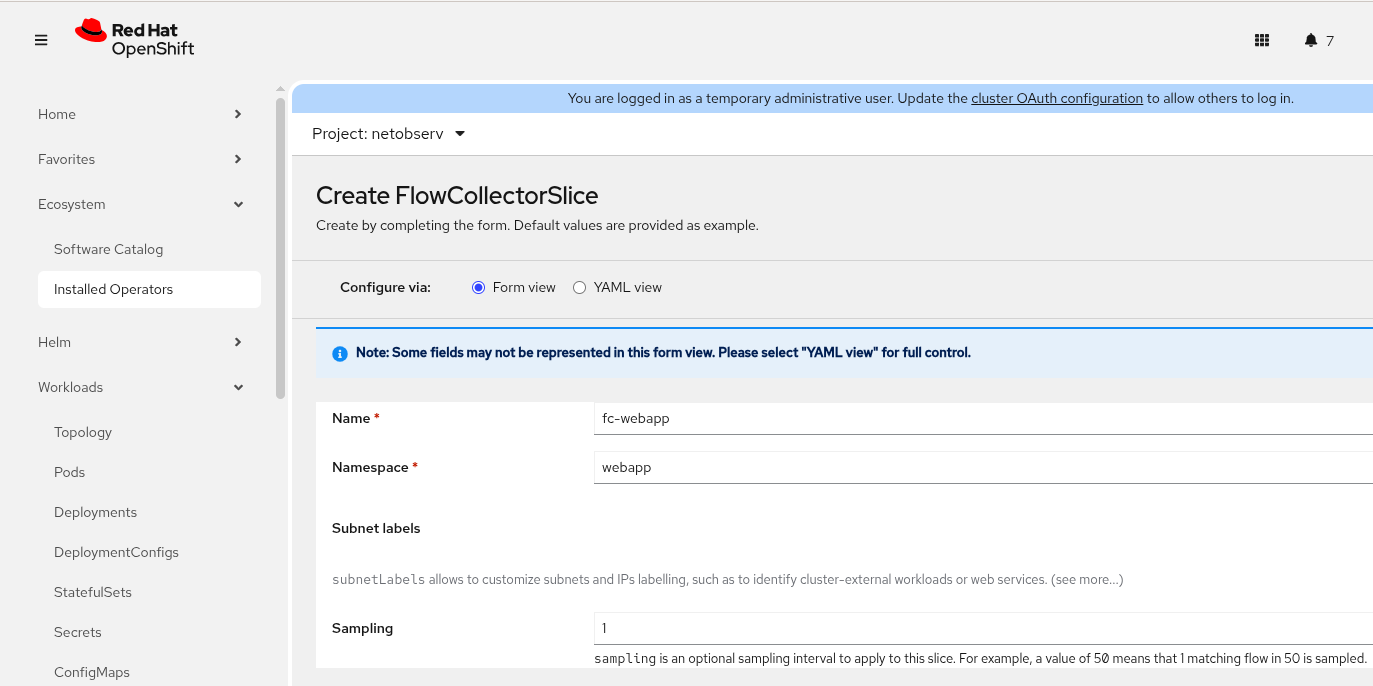
Here is the YAML applied to my cluster.
apiVersion: flows.netobserv.io/v1alpha1
kind: FlowCollectorSlice
metadata:
  name: fc-webapp
  namespace: webapp
spec:
  sampling: 1
  subnetLabels:
    - cidrs:
        - 172.30.40.45/32
      name: websvc
The FlowCollectorSlice instances won't take effect unless they are enabled in the FlowCollector. In the OpenShift web console, click Processor configuration and then Slices configuration to configure this. Alternatively, enter oc edit flowcollector in the terminal and configure the following under the processor section.
spec:
  processor:
    slicesConfig:
      enable: true
What makes this really powerful is that you can configure the FlowCollector to ingest data only for a list of namespaces. Here is an example to ingest data for namespaces named webapp or begin with openshift-.
spec:
  processor:
    slicesConfig:
      enable: true
      collectionMode: AllowList  # default: AlwaysCollect
      namespacesAllowList: [webapp, /^openshift-/]
The collectionMode must be set to AllowList for namespacesAllowList to take effect. The first element of namespacesAllowList is an exact match for webapp. The second element specifies a regular expression because it's between the forward slashes.
Zero-click Loki for non-production
If you want to test network observability with Loki enabled, you still have to create a Loki instance and provide storage. The zero-click Loki feature adds a new parameter, installDemoLoki. When set to true, this parameter creates a Loki in monolithic mode and a persistent volume claim (PVC). If you're using the OpenShift web console, this is the third page (Loki) of the FlowCollector wizard. Set the mode to Monolithic and enable installDemoLoki with YAML as follows:
spec:
  loki:
    monolithic:
      installDemoLoki: true
The PVC is 10 GiB of ephemeral storage. Now you're able to get a running network observability to instantly try. As the parameter name indicates, use this only for demo purposes and not production since monolithic Loki will not scale.
DNS name
Network observability can track DNS information if you enable the DNSTracking feature. In the OpenShift web console, this is in the Agent configuration section of the FlowCollector form or the second page of the FlowCollector wizard (Figure 1). The following snippet shows the YAML configuration:
spec:
  agent:
    ebpf:
      features:
        - DNSTracking
It now retrieves the DNS name. Technically, in a DNS query, it is the QNAME field. In the OpenShift web console, go to Observe > Network Traffic and click the Traffic flows tab. Click Show advanced options and then Manage columns. Scroll down and enable DNS Name to add this column. Now you will see this column in Figure 3.
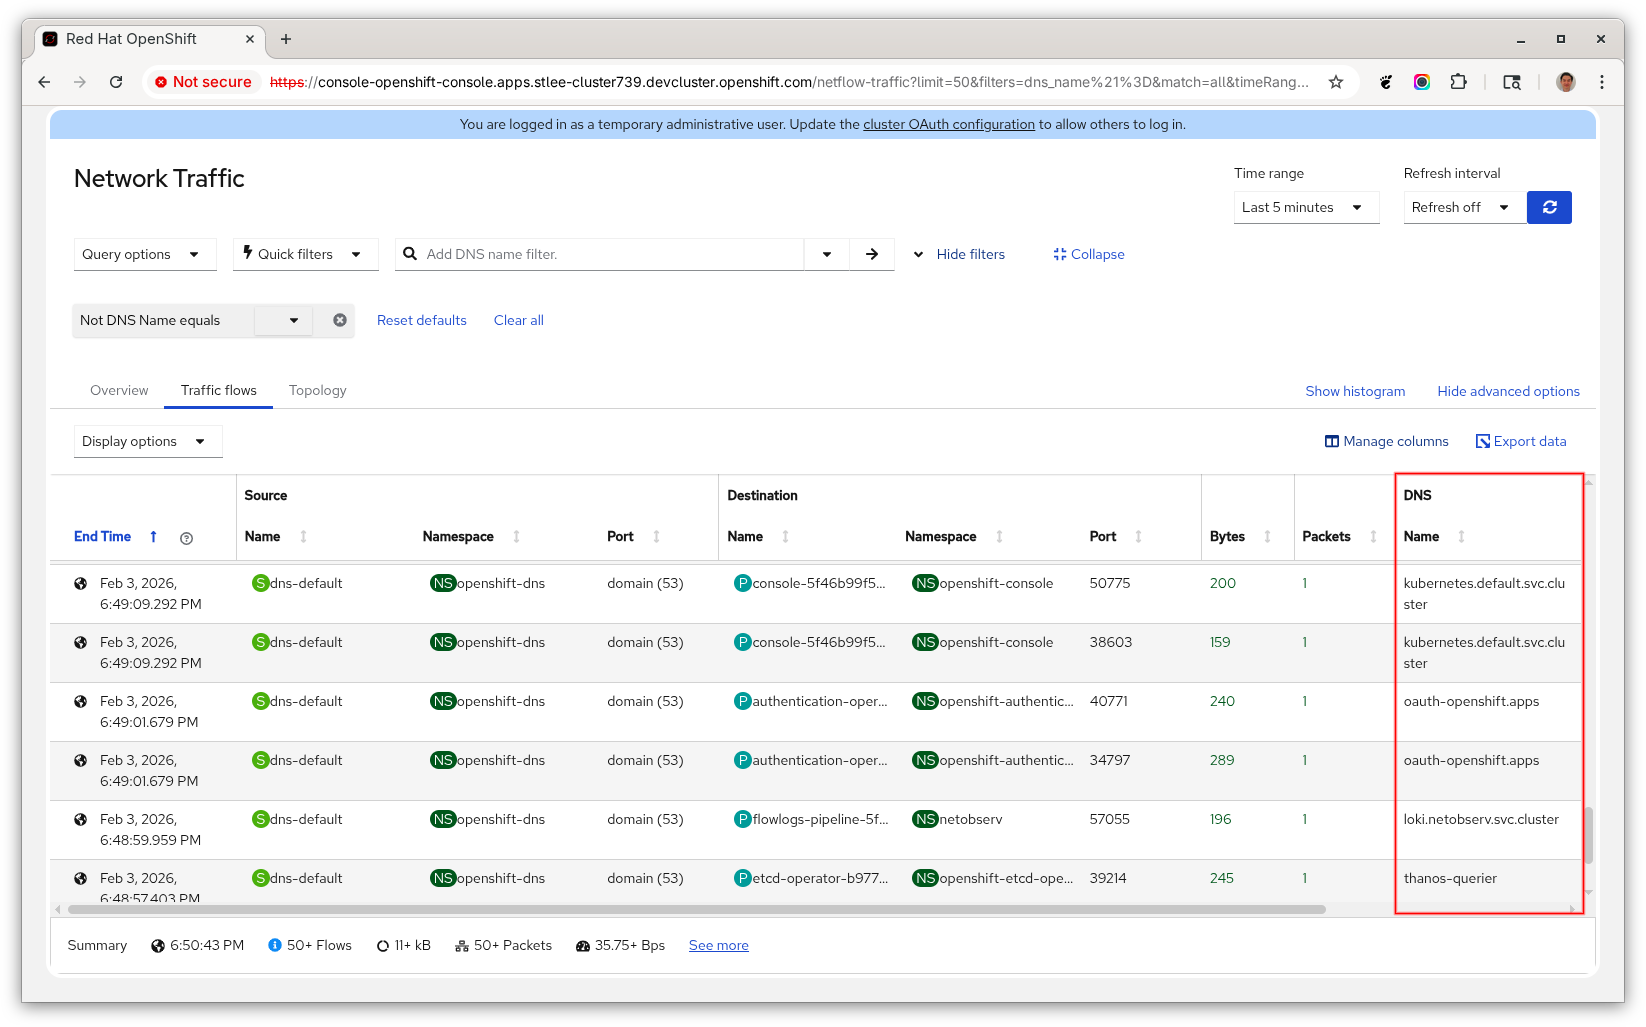
In the Overview tab, there is also a new "Top 5 DNS name" graph.
The DNS name is also supported in the network observability CLI, a command line tool based on the network observability code base. There is a current limitation of storing only the first 30 characters of the DNS name.
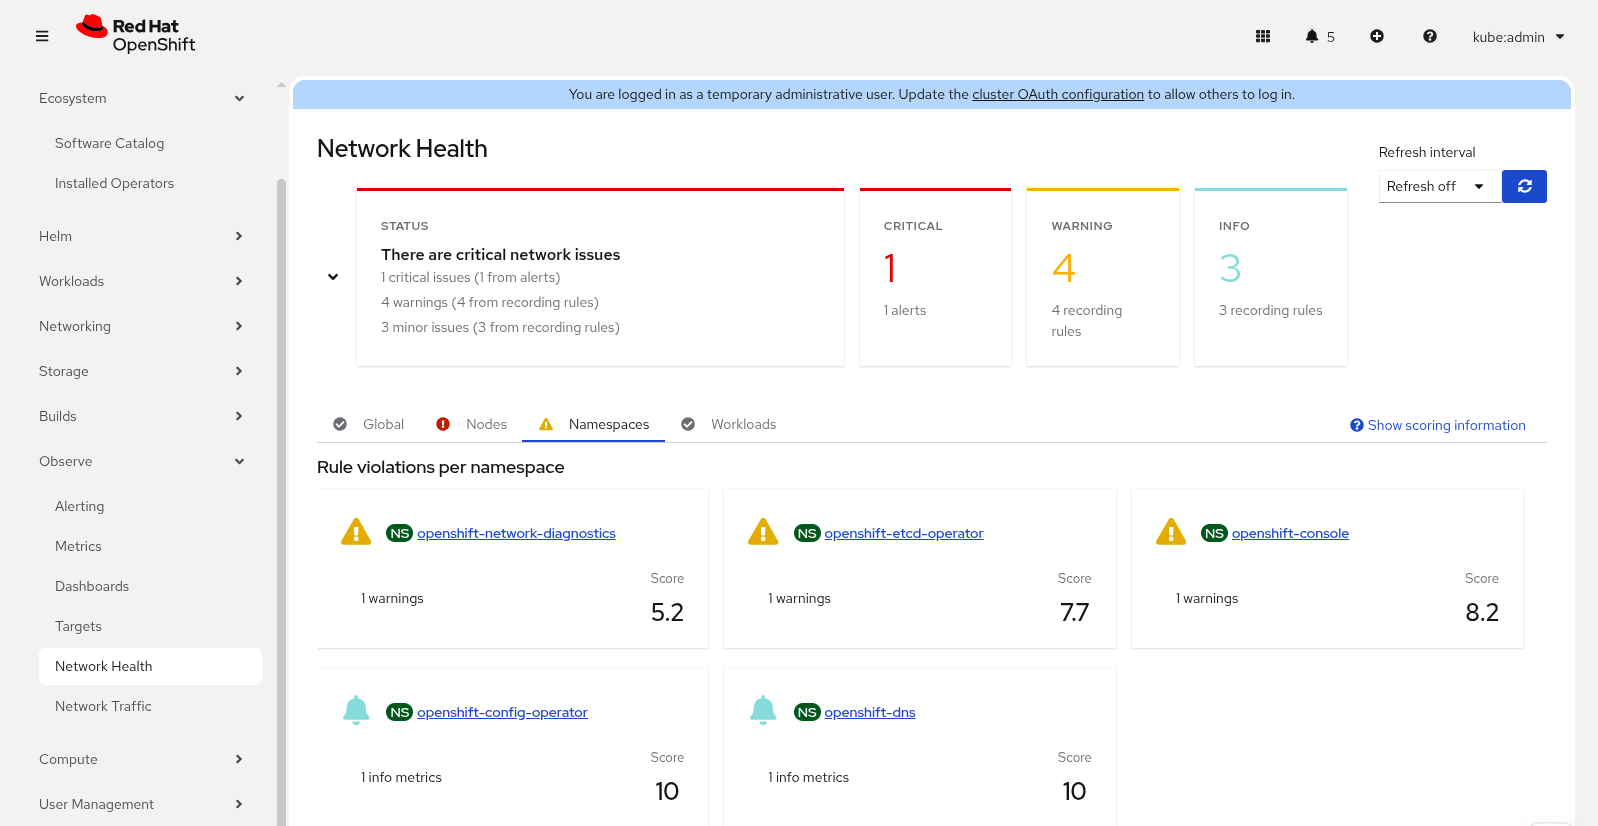
Improvements in network health
The network health dashboard and custom alerts reached General Availability (GA) in this release. It removes the feature gate environment variable mentioned in the 1.10 article.
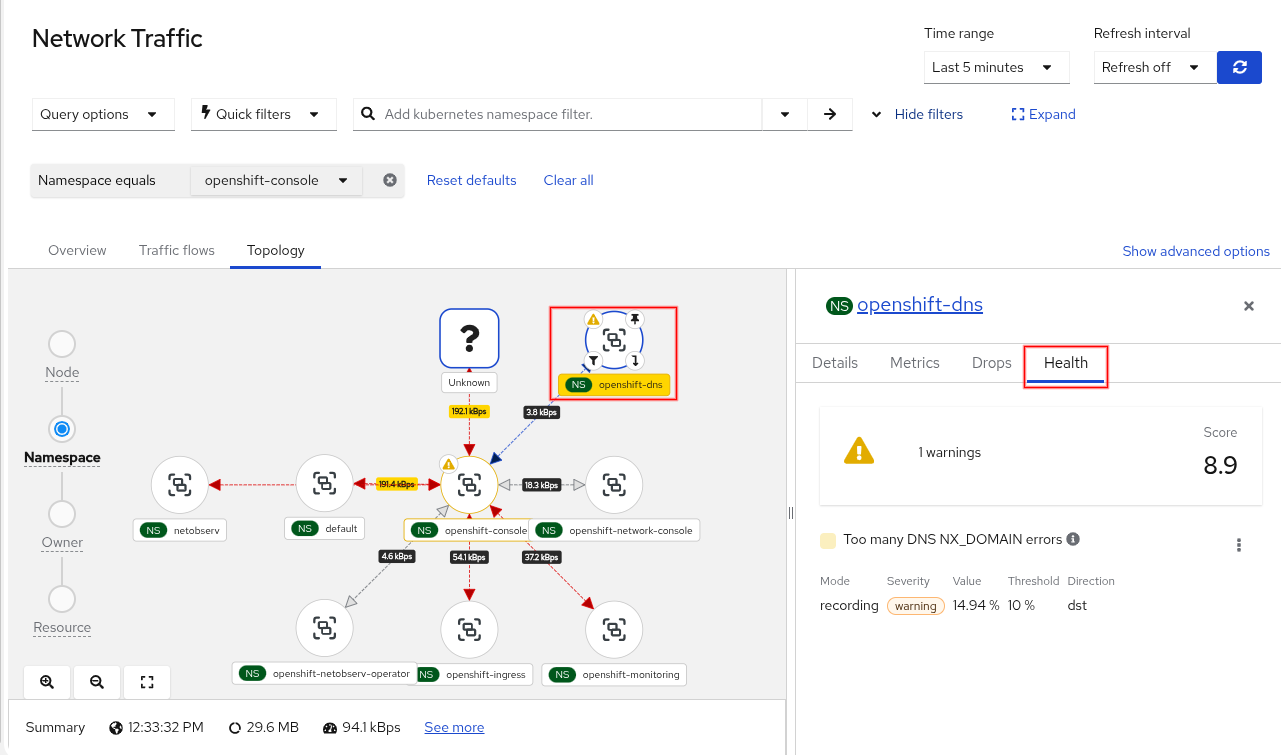
The health violations were also integrated into the topology view in the Observe > Network Traffic panel under the Topology tab. Select an object to view the details. If there are any violations, there will be a Health tab (Figure 4).
Recording rules
Custom alerts create a PrometheusRule object (from monitoring.coreos.com/v1) tied into the OpenShift alert system. This is great if the alert is well-defined to avoid false positives and not generating another alert for the same problem. This is sometimes hard to avoid and the notion of alert fatigue is very real and problematic.
Network observability now supports the recording rule in PrometheusRule. It is a PromQL expression precomputed regularly and then stored as a new metric. From a user point-of-view, it is like an alert, except it only appears in the Network Health dashboard and doesn't fire any events (Figure 5).
In the OpenShift web console and the FlowCollector form, click Processor configuration and then Metrics configuration. The two relevant sections are: include list and healthRules (Figure 6).
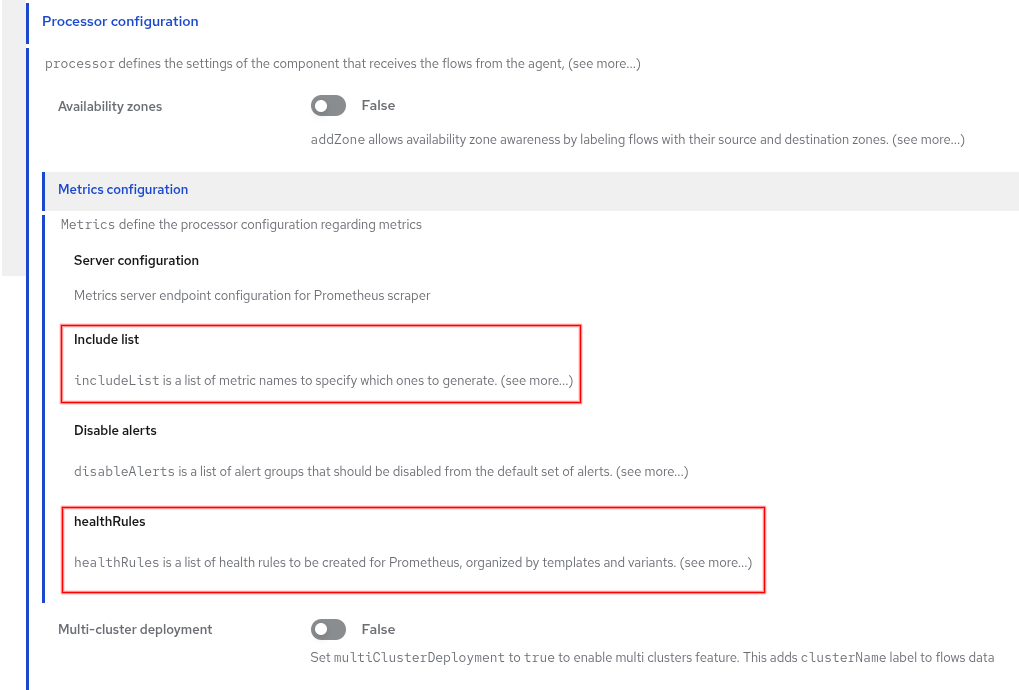
Both the recording rules and alerts fall under the umbrella of healthRules. When you select a template for a health rule, you must also include the corresponding metric in the include list section. Don't worry, a warning will appear if you didn't include the necessary metric. For the DNS-related health rule, enable the DNSTracking feature in eBPF.
To configure this in the terminal, enter oc edit flowcollector and look for the metrics section, as in the following example:
spec:
  processor:
    metrics:
      healthRules:
        - template: DNSNxDomain
          mode: Alert  # Alert (default) or Recording
          variants:
            - groupBy: Namespace
              mode: Recording  # override parent's mode
              thresholds:
                warning: "10"
                info: "5"
            - groupBy: Node
              # mode not specified so it uses parent's mode
              thresholds:
                critical: "15"
The mode field determines whether it's a recording rule or alert. This is configured under healthRules or variants. If it is specified in variants, it overrides the setting in healthRules. For more details on health rules, including how to adjust the thresholds, view the runbooks for the network observability operator.
Enhanced filters
The next sections describe two enhanced filters: UI and Quick filters.
UI filters
Previously, in the Network Traffic panel, the filter fields were made up of three separate UI components. They were the field name, operator, and value (e.g., Source Name = netobserv). It is now a single field that makes up this <field><operator><value> expression. Start typing into this field and it will provide suggestions for you. It works best if you don't put a space before or after the operator. If you want more guidance on creating the filter expression, click the small triangle to the right of the text field to bring up a dialog (Figure 7).
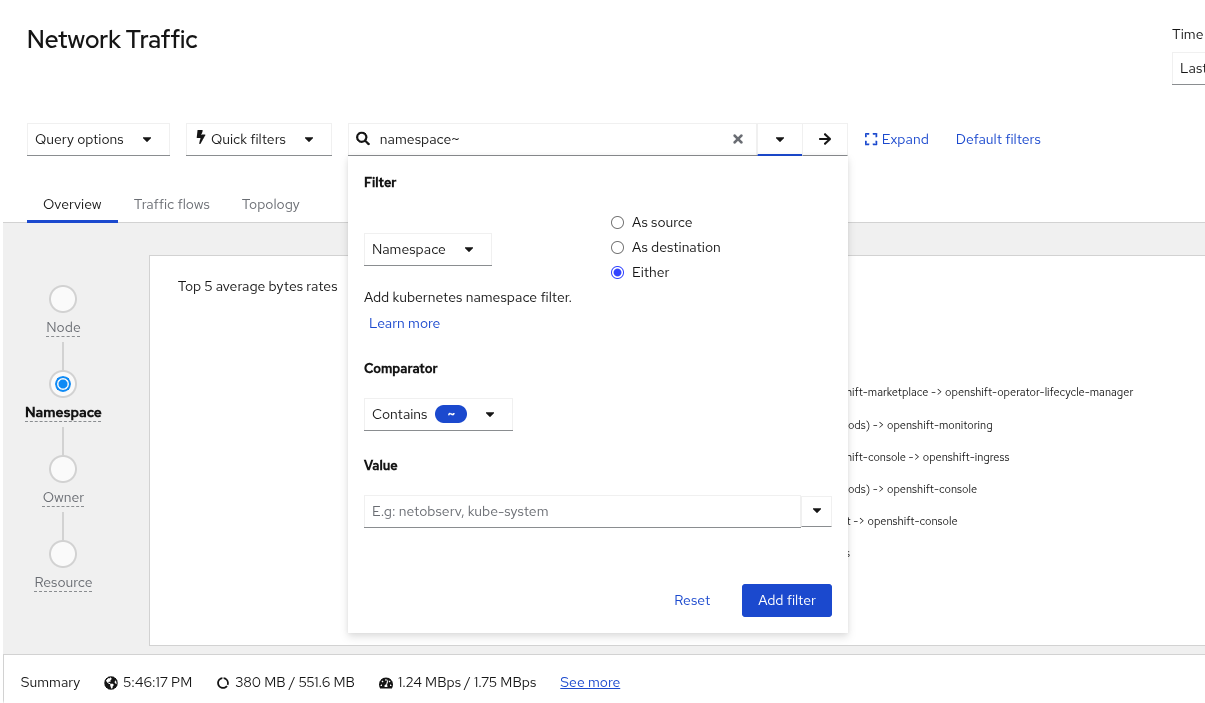
The dialog is mostly self-explanatory, so I won't get into details. After entering the filter expression, click the right arrow button next to the small triangle. You can also just press Enter. This adds the filter expression with any other filters you might already have below this field.
You can make changes to the configured filter expressions, including changing the field value. For example, suppose you have "Namespace equals netobserv." The "Namespace" means source or destination namespace. Click the netobserv dropdown menu and select As source. This changes the field to Source Namespace only. Changing the field value might move the entire expression to a new location because you can't have the same field name repeated twice in the entire expression.
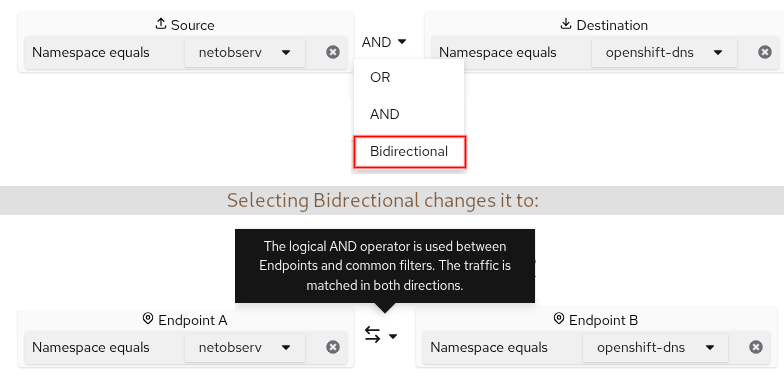
A field name with multiple values means it must match any one of the values (OR condition). In between the fields is typically an AND condition but can be changed to OR. There's a special case where Bidirectional might be an option. For example, suppose you have "Source Namespace equals netobserv" AND "Destination Namespace equals openshift-dns." If you change AND to Bidirectional, then it also includes the traffic when swapping the source and destination. For the UI, the Source and Destination labels change to Endpoint A and Endpoint B, respectively (Figure 8).
Quick filters
Quick filters are predefined filters in the Network Traffic panel. Two new filters were added in this release: External ingress and External egress (Figure 9).
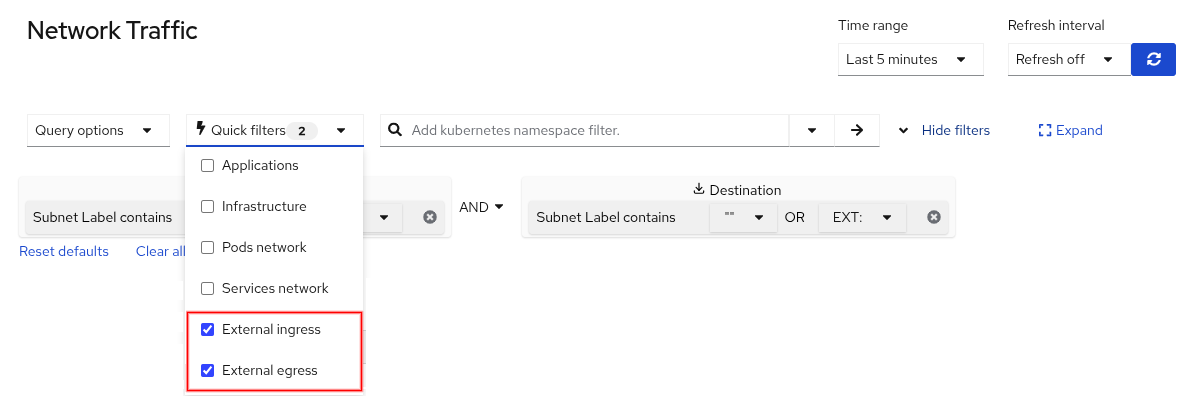
"External ingress" is traffic where the source is outside of the cluster, and the destination is an endpoint inside your cluster. If you deploy a web server and access this server from the outside, this creates two flows in OpenShift, one from the outside to an HAProxy pod named router-default-<hash> and a second flow from the HAProxy pod to your web server. The second flow is not considered external ingress traffic.
Similarly "External egress" is the traffic where the source is inside the cluster and the destination is outside of the cluster. Again, there is an HAProxy in between and so the second flow that goes outside of the cluster is only considered external egress traffic.
How does this actually work? It leverages subnet labels. There's a parameter under spec.processor.subnetLabels named openShiftAutoDetect that must be set to true, which is the default. This identifies all CIDRs with a predefined value such as Pods, Services, Machines, n/a, or a custom name that you give it. The default value for an external CIDR is blank. If you give it a custom name, you must prefix it with EXT: for the quick filter to work. Why? If you look at the implementation of the quick filter, it is as follows:
   - filter:
       src_subnet_label: '"",EXT:'
     name: External ingress
   - filter:
       dst_subnet_label: '"",EXT:'
     name: External egress
If the subnet label name is blank or EXT:, then it is considered external traffic.
Kubernetes Gateway object
Network observability recognizes the Kubernetes Gateway object. The owner of a pod is often a deployment. But if the owner of the deployment is a gateway (i.e., if Red Hat OpenShift Service Mesh 3 or Istio is installed), then network observability will show this owner object with a gateway icon instead (Figure 10). To view the gateway traffic, it provides a link to the Gateway resource page.
Speaking of icons, they have been refreshed and updated to better represent the Kubernetes objects.
Wrap up
This release provides features that give you better control of how resources are used with the Service deployment model and the new FlowCollectorSlice CRD. There were improvements to the Network Health dashboard and support for recording rules. Usability enhancements were made in the UI filters, along with a zero-click Loki setup for demonstration purposes. Finally, the DNS name was added and the Kubernetes Gateway object is now recognized.
We want to make a bigger push to serve the community. If there's something on your wishlist, go to the discussion board, and let us know what you have in mind.
Special thanks to Julien Pinsonneau, Olivier Cazade, Amogh Rameshappa Devapura, Leandro Beretta, Joel Takvorian, and Mehul Modi for reviewing this article.