This article is the first in a two-part series examining how Identity Management (IdM) behaves from a performance perspective when encrypted DNS (eDNS) is used under sustained high load.
As discussed in Using DNS over TLS in OpenShift to secure communications, a dedicated task force was established to ensure that Red Hat complies with the U.S. government memorandum MS-22-09, which mandates that internal networks supporting hybrid workloads must adhere to zero-trust architecture (ZTA) principles. Under this model, all traffic must be authenticated, authorized, and encrypted. We must also consider that organizations are increasingly moving unencrypted DNS traffic to protocols like DNS over TLS (DoT), and while the security benefits of this transition are clear (particularly with IdM using standard clients, and also with CoreDNS in OpenShift environments), the deployment of new security layers can introduce performance overhead.
In this initial article, we explore a stress scenario in which a standard client joined to an IdM domain generates an exceptionally high volume of DNS queries (orders of 1,000+ requests per second) against an IdM DNS server. We compare conventional DNS over UDP and TCP with encrypted DNS (eDNS) using DNS over TLS (DoT), available in both Red Hat Enterprise Linux 9.6 and 10 (RHEL), to assess how encryption impacts DNS performance under high load.
The architecture to test
In the test scenario, both the client and the IdM server are running RHEL 10.1. On the client side, we use the dnsperf tool to generate high load for both standard DNS (UDP and TCP) and also with DoT. Performance metrics include queries per second (QPS), latency, throughput, and resource utilization, and are collected using Prometheus and visualized in Grafana, ensuring comprehensive and verifiable insight into the performance trade-offs.
The installation and initial configuration of IdM with eDNS are not covered here, as they were addressed in Using DNS over TLS in Red Hat OpenShift to secure communications. Beyond that baseline setup, only two additional changes are required to prepare the benchmarking environment: enabling the standard DNS service in firewalld and changing dns-policy from enforced to relaxed:
# ipa-server-install --setup-dns --dns-over-tls \
--dns-policy relaxed --no-dnssec-validation \
--dot-forwarder=8.8.8.8#dns.google.com
# firewall-cmd --add-service dns
Both steps are required to run the benchmarks described below.
In addition, a key part of this test scenario is the preparation of suitable test data. In the previous article, we created a single resource record (securerecord.melmac.univ) but that's insufficient for the purposes of this benchmark. For this updated scenario, two requirements must be addressed:
- Avoid DNS caching: To ensure that every query is resolved by the nameserver, the sample records must use a low time-to-live (TTL). A TTL of 1 second is commonly used in performance testing to prevent caching effects.
- Increase record count: At least 1,000 distinct resource records are required to generate meaningful load.
In an Identity Management (IdM/FreeIPA) environment, the easiest way to implement this is by using the IdM command-line interface (CLI). This manages the underlying BIND configuration, so the records are added using the ipa dns-record-add command (other approaches include creating an ldif file and loading it into the LDAP engine).
For the upcoming dnsperf tests, we assume you have created a file with the following content (this is needed only for the dnsperf tests, not for the creation of the resource records):
# cat dnsrecords.txt
test-record-1.melmac.univ A
test-record-2.melmac.univ A
test-record-3.melmac.univ A
test-record-4.melmac.univ A
[...]
test-record-1000.melmac.univ A
This file is used later as an input to dnsperf, and defines the set of DNS queries executed during the tests.
Next, all of these records must be added to IdM using a script similar to the one shown below.
# cat addrecords.sh
#!/bin/bash

ZONE="melmac.univ"
IP="127.0.0.1"
TTL=1

for i in $(seq 1 1000); do
    RECORD="test-record-$i"
    echo "Adding $RECORD..."
    ipa dnsrecord-add "$ZONE" "$RECORD" --a-ip-address="$IP" --ttl="$TTL" --force
done
Note that the ipa dnsrecord-add command explicitly sets the TTL to 1 second.
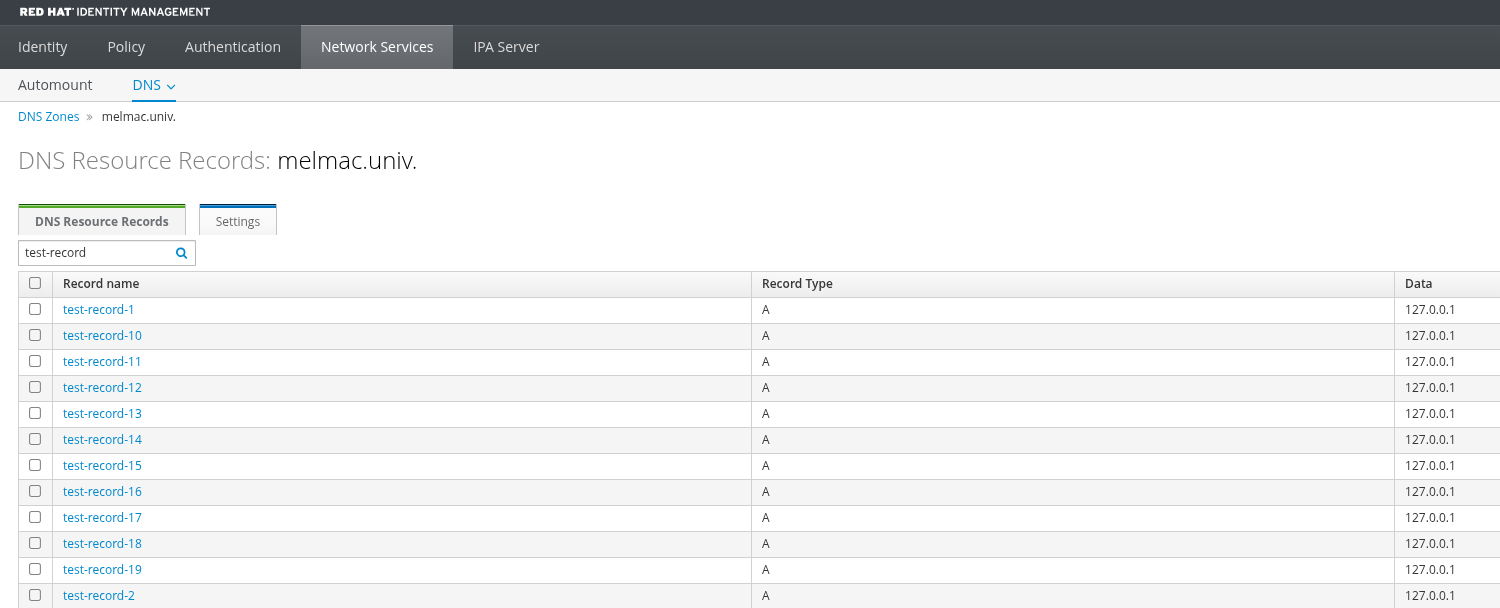
Once executed, all test data is ready for the upcoming dnsperf tests, as shown in Figure 1.
Identity Management metrics
At this stage, we have a client system (server.melmac.univ) joined to an IdM server (idm.melmac.univ), which is configured with BIND and eDNS working in relaxed mode.
Note that all configuration and container commands in this section are performed directly on the Identity Management (IdM) host to set up local metric collection. In this blog, for simplicity, exporters and Prometheus are not secured and protected by authentication. In a real production environment, securing those features is highly recommended.
We would first configure the Identity Management to export statistics, and then a BIND exporter and node exporter to collect them and export in the Prometheus OpenMetrics protocol.
Add the following configuration to /etc/named/ipa-ext.conf:
/* statistics for prometheus bind exporter */
statistics-channels {
  inet 127.0.0.1 port 8053 allow { 127.0.0.1; };
};
Relabel port 8053 in SELinux so it can be associated with the DNS service. This allows BIND to listen on the port under SELinux enforcement:
# semanage port -a -t dns_port_t -p tcp 8053Restart the service:
# systemctl restart namedNext, if it is not already installed, install Podman. This is required to run both the BIND exporter and the node exporter as containers using images provided by Prometheus.
# dnf install podmanTo run Prometheus images for the BIND exporter and node exporter respectively:
# podman run -d --network host --pid host -u 25 \
-v /run/named/named.pid:/tmp/named.pid:z \
quay.io/prometheuscommunity/bind-exporter:v0.8.0 \
--bind.stats-url http://localhost:8053 --web.listen-address=:9119 \
--bind.pid-file=/tmp/named.pid \
--bind.stats-groups "server,view,tasks"
In this command, 25 is the UID for the user named. To verify that everything is working as expected, use the curl command for an OpenMetrics report:
# curl -s http://localhost:9119/metrics | more
## HELP bind_boot_time_seconds Start time of the BIND process since unix epoch in seconds.
## TYPE bind_boot_time_seconds gauge
bind_boot_time_seconds 1.766321322e+09
## HELP bind_config_time_seconds Time of the last reconfiguration since unix epoch in seconds.
## TYPE bind_config_time_seconds gauge
bind_config_time_seconds 1.766321322e+09
## HELP bind_exporter_build_info A metric with a constant '1' value labeled by version, revision, branch, goversion from which bind_exporter was built, and the goos and goarch for the build.
## TYPE bind_exporter_build_info gauge
bind_exporter_build_info{branch="HEAD",goarch="amd64",goos="linux",goversion="go1.23.2",revision="5cc1b62b9c866184193007a0f7ec3b2eb3
1460bf",tags="unknown",version="0.8.0"} 1
[...]
Next, deploy a node exporter to collect metrics from the host running the IdM server. This is primarily used to monitor CPU behavior under load pressures:
# podman run -d --network host --pid host \
-v "/:/host:ro,rslave" quay.io/prometheus/node-exporter:latest \
--path.rootfs=/host     --web.listen-address=:9100
Again, get a OpenMetrics report:
# curl -s http://localhost:9100/metrics | more
## HELP go_gc_duration_seconds A summary of the wall-time pause (stop-the-world) duration in garbage collection cycles.
## TYPE go_gc_duration_seconds summary
go_gc_duration_seconds{quantile="0"} 0
go_gc_duration_seconds{quantile="0.25"} 0
go_gc_duration_seconds{quantile="0.5"} 0
go_gc_duration_seconds{quantile="0.75"} 0
go_gc_duration_seconds{quantile="1"} 0
go_gc_duration_seconds_sum 0
go_gc_duration_seconds_count 0
[...]
At this point, the remaining component on the IdM host is the Prometheus server. Prometheus is responsible for scraping metrics from the exporters, storing them, and exposing a query interface that Grafana uses to build dashboards. To enable this, Prometheus must be configured with the appropriate scrape targets. For example, the configuration can be stored in /etc/prometheus/config.yml and define scrape jobs for both the BIND exporter and the node exporter, as shown below:
# cat /etc/prometheus/config.yml
scrape_configs:
 - job_name: 'bind9-metrics'
   metrics_path: '/metrics'
   scrape_interval: 5s
   static_configs:
    - targets: ['idm.melmac.univ:9119']

 - job_name: 'node-exporter'
   metrics_path: '/metrics'
   scrape_interval: 5s
   static_configs:
    - targets: ['idm.melmac.univ:9100']
In the static_configs targets, you must replace idm.melmac.univ with the actual hostname of the IdM host.
The /metrics endpoint is exposed by the exporters (such as the BIND exporter and node exporter) and is used exclusively by Prometheus to scrape raw metrics. Grafana does not query these endpoints directly. Instead, Grafana connects to the Prometheus server and retrieves data through Prometheus's PromQL query API.
There's a good chance that the cockpit.socket service is already listening on port 9090. However, Prometheus exposes its web interface and PromQL query API on TCP port 9090 by default, which is the port Grafana uses when configuring Prometheus as a data source. To avoid a port conflict, you must first disable the Cockpit socket or update the Prometheus configuration to be exposed over a different port number. For this article, I disabled cockpit.socket:
# systemctl disable --now cockpit.socketOnce the port is available, you can start the Prometheus server:
# podman run -it -d --rm --network host \
-v "/etc/prometheus/config.yml:/etc/prometheus/config.yml" \
quay.io/prometheus/prometheus:latest \
--web.listen-address=0.0.0.0:9090 \
--web.enable-remote-write-receiver \
--config.file=/etc/prometheus/config.yml
At this point, the following three containers are running on the IdM system (of course, the container names must be different on your system):
# podman ps
IMAGE                                        COMMAND            PORTS    NAMES
quay.io/prometh..unity/bind-exporter:v0.8.0  --bind.stats-url   9119/tcp optimistic_feistel
quay.io/prometheus/node-exporter:latest      --path.rootfs=/ho..9100/tcp vibrant_merkle
quay.io/prometheus/prometheus:latest         --web.listen-addr..9090/tcp thirsty_cartwright
Finally, the Prometheus web interface is exposed on port 9090. Enable access to it in firewalld:
# firewall-cmd --add-port=9090/tcp
# firewall-cmd --runtime-to-permanent
Navigate to the Prometheus web interface on your IdM server at http://idm.melmac.univ:9090, then go to Status > Target Health and verify that both the bind9-metrics and node-exporter jobs are successfully scraping their targets. Each job should report a STATE of UP, as shown in Figure 2:

Install Grafana
The Prometheus server running on the Identity Management (IdM) host is accessible on port 9090. When configuring Grafana, we use the IdM host's network-reachable hostname or IP address to connect to Prometheus. Before doing so, you must install the Grafana package. To keep the setup consistent, install Grafana on the same IdM server, and open TCP port 3000 in firewalld:
# dnf install -y grafana
# firewall-cmd --add-port=3000/tcp
# firewall-cmd --runtime-to-permanent
Then enable and start the grafana-server service:
# systemctl enable --now grafana-serverConnect Grafana to Prometheus
By connecting Grafana to Prometheus, you can use this data source to create dashboards that visualize metrics collected from the bind-exporter and node-exporter jobs on ports 9119 and 9100.
First, open the Grafana web interface in a browser, and navigate to Home > Connections > Data Sources.
On the Data Sources page, click the Add data source button and select Prometheus from the list of available types.
To configure the Prometheus connection, enter these values:
- Name: A descriptive name (for example, IdM-Prometheus)
- HTTP URL: The address of the Prometheus server (
http://idm.melmac.univ:9090in this example) - Leave other settings (such as authentication) at their default values
Finally, click the Save & test button. Grafana reports Successfully queried the Prometheus API upon a successful connection.
Create Grafana dashboards
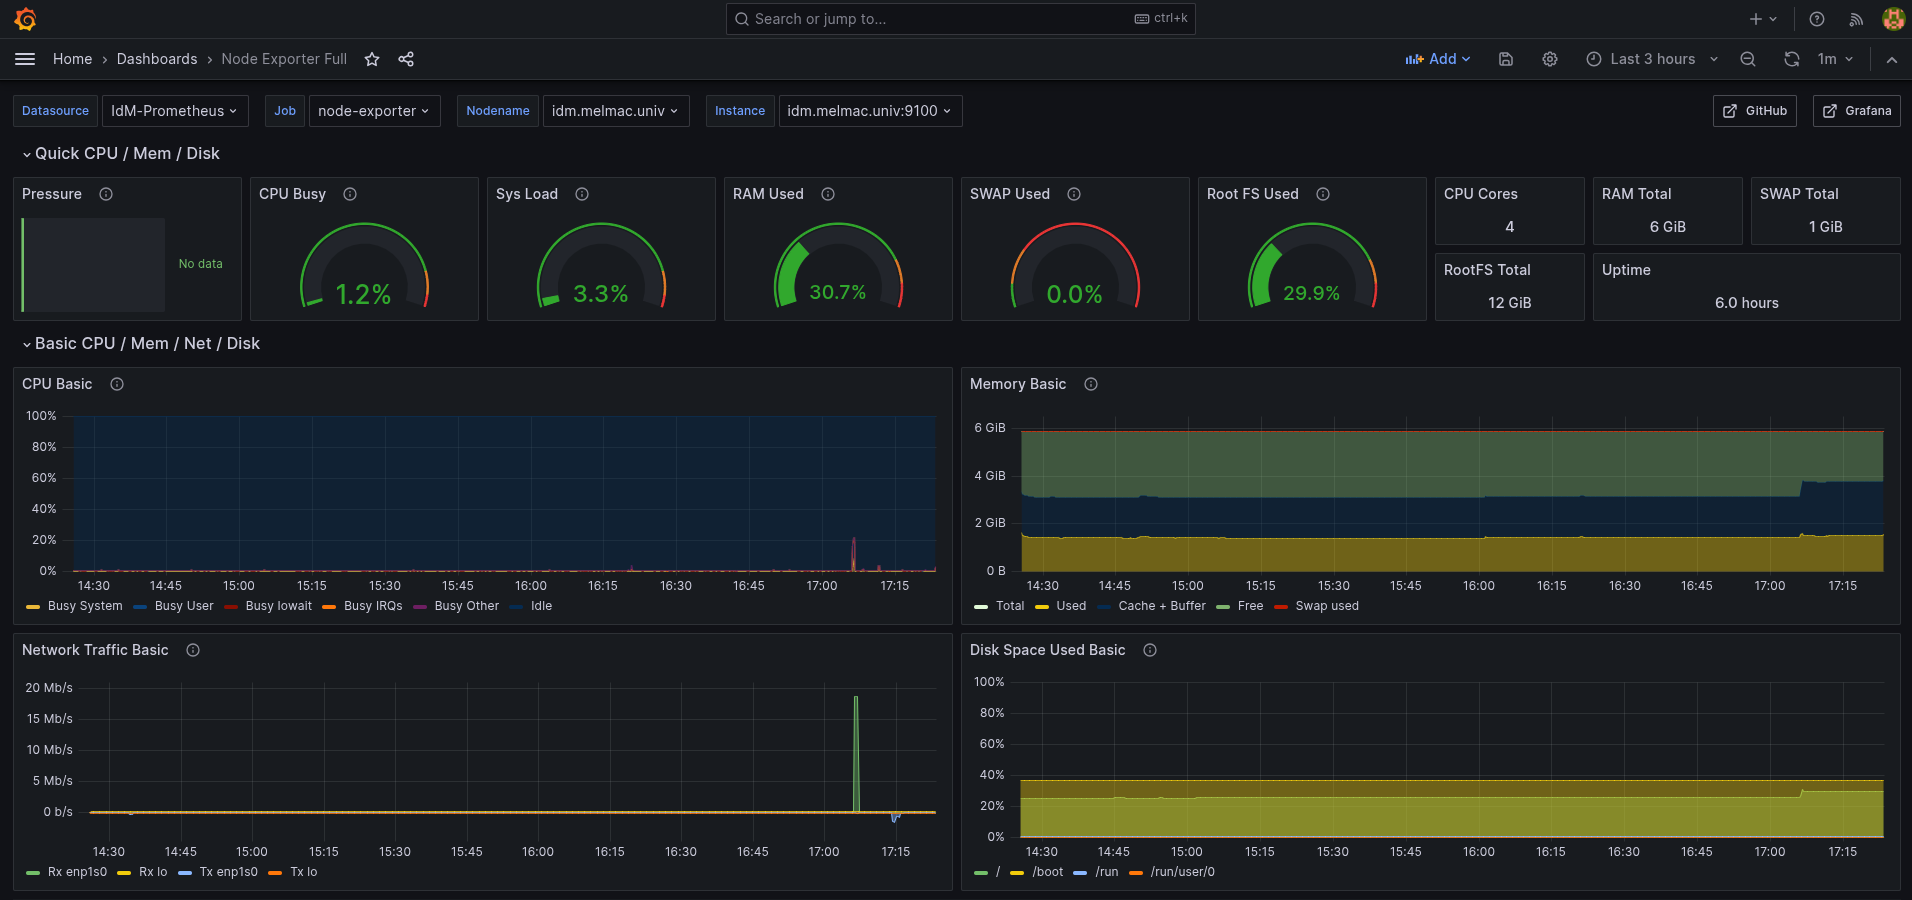
To set up dashboards for the node exporter and BIND exporter, navigate to Home > Dashboards > New > New dashboard and select Import dashboard. Load the dashboard with ID 1860, titled Node Exporter Full. Once imported, the dashboard appears as shown in Figure 3.
There is no predefined dashboard for dnsperf, so we need to create a new one using a JSON model, which you can import into Grafana. You can download an example dashboard that collects performance metrics from this GitHub repository.
Finally, install the dnsperf utility on the client system by configuring a repository with these settings, and then run:
[server]# dnf install dnsperfThe dnsperf tool provides the option to give verbose stats and latency histograms per period. We have developed a simple Python program that's able to gather the results file and load it into Prometheus for further analysis and visualization.
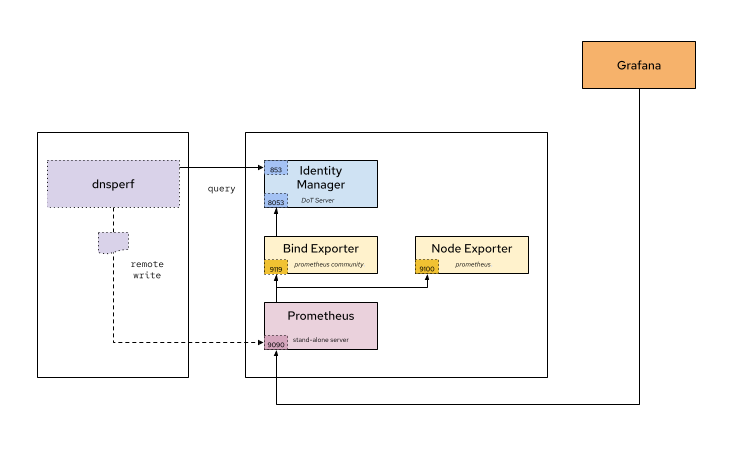
Figure 4 displays an overview of the complete architecture of the test system:
Comparative performance benchmarking
It's time to run the tests. Start with UDP tests.
UDP test
Assuming you have the dnsrecords.txt file in the client joined to an IdM server as described in the section The architecture to test, you can run a DNS UDP test with the following command in the client:
[server]# dnsperf -f inet -m udp -s idm.melmac.univ \
-p53 -T4 -c4 -l120 -d dnsrecords.txt \
-O latency-histogram -O verbose-interval-stats -S1 \
-O suppress=timeout,unexpected > dnsperf-result-udp-4.txt
This test produces the following results:
Interval Statistics:

  Queries sent:         105233
  Queries completed:    105172 (99.94%)
  Queries lost:         0 (0.00%)

  Response codes:       NOERROR 105172 (100.00%)
  Average packet size:  request 43, response 59
  Run time (s):         1.001081
  Queries per second:   105141.000060

  Average Latency (s):  0.000752
  Latency StdDev (s):   0.000547
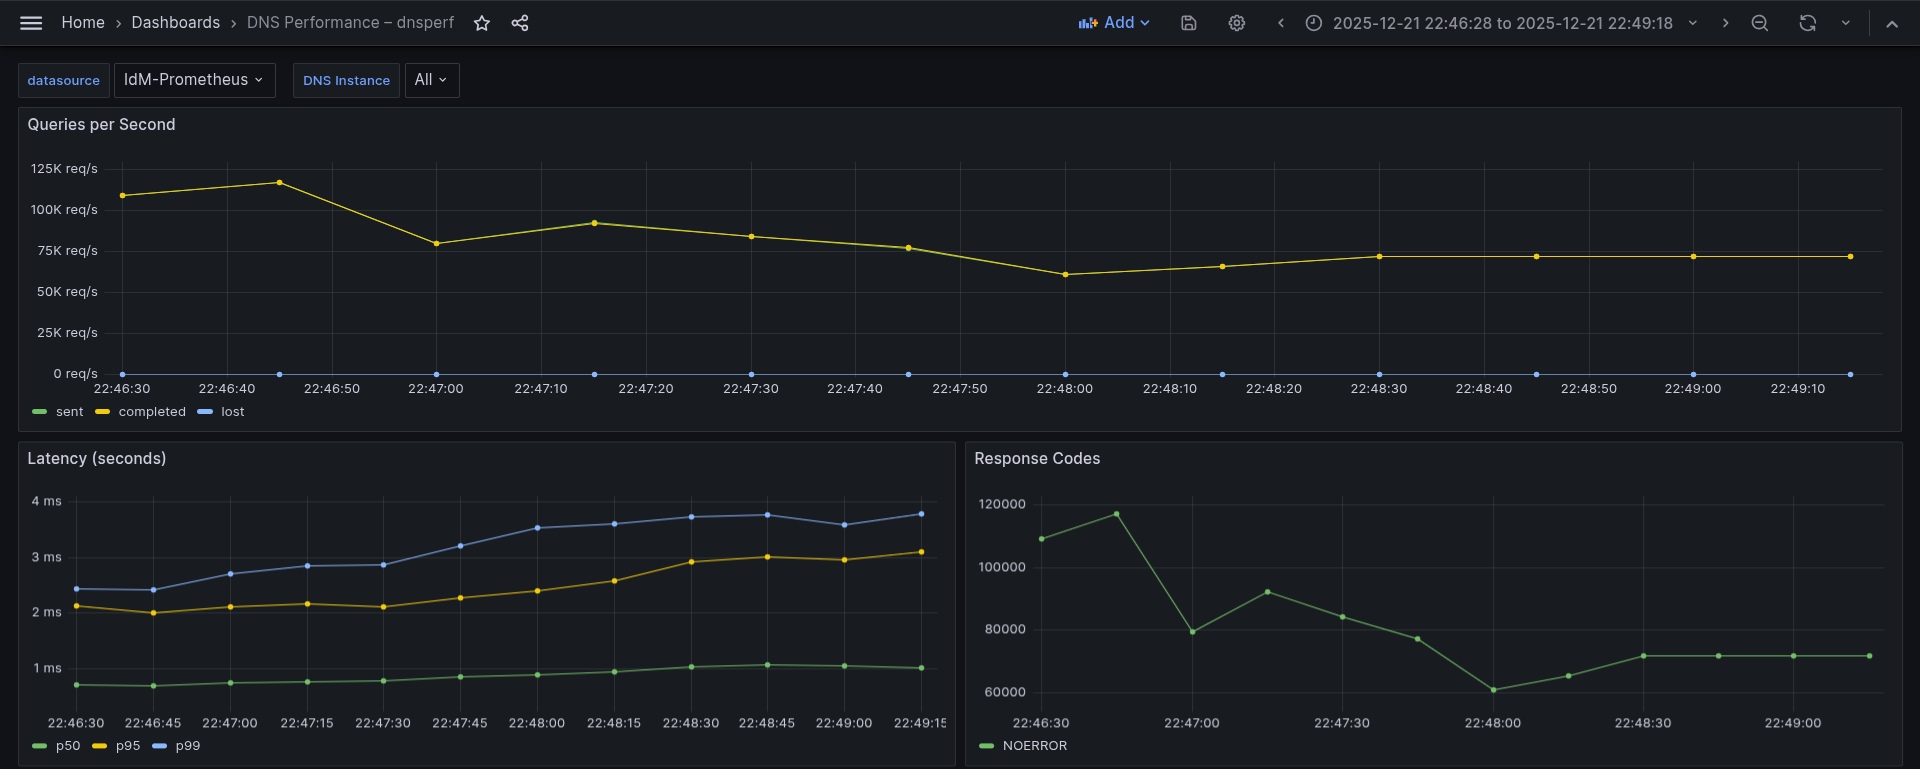
This represents one single 1-second interval, specifically the first interval after dnsperf command started. It's important to note that this is not an average over the whole run. Instead, it reflects the first burst measurement that lasts approximately 10 to 20 seconds. The first intervals are higher than the rest, because it benefits from empty queues, fresh socket buffers, and CPU boost states. The rest of the intervals show a sustained rate, stabilizing after the first 30 seconds or so. This is clearly reflected in the Grafana view, as shown in Figure 5.
This graph shows:
- Initial throughput slightly above 110k QPS
- A gradual decrease over the first minute to around 60–70k QPS
- Stabilization in the 70–75k QPS range toward the end of the run
- Lost queries remain effectively zero
Interpretation:
- The early high values reflect a warm-up phase where the client and server pipelines are not yet saturated.
- As the test progresses, the system transitions to a steady-state throughput.
- The absence of lost queries indicates that the DNS server is handling the offered load without dropping requests.
Conclusion: The system sustains approximately 70–75k QPS under continuous UDP load, with no observable packet loss.
Latency percentiles describe how long queries take to complete, ordered from fastest to slowest. The p50 (median) represents the time within which 50% of queries complete. The p95 indicates that 95% of queries complete within that time, while the p99 shows that 99% of queries finish within the specified latency, meaning that only 1 out of 100 queries takes longer. Based on this, we observed the following behavior:
- p50 latency increases slightly from ≈0.7 ms to ≈1.0 ms
- p95 latency rises gradually from ≈2.0 ms to ≈3.1 ms
- p99 latency remains below ≈4 ms throughout the test
Interpretation:
- The modest increase in latency corresponds to the system reaching steady-state throughput.
- The tight gap between p95 and p99 suggests stable tail latency without spikes or queue buildup.
- No sudden jumps indicate there is no saturation or contention inside the DNS service.
- Even the slowest queries stay under 4 ms.
Conclusion: Latency remains low and predictable even as throughput stabilizes, with tail latency well controlled.
TCP test
For this article, I conducted several experiments using TCP, all of which showed a consistent reduction in QPS. You can run the TCP test yourself:
[server]# dnsperf -f inet -m tcp -s idm.melmac.univ \
-p53 -T4 -c4 -l120 -d dnsrecords.txt \
-O latency-histogram -O verbose-interval-stats -S1 \
-O suppress=timeout,unexpected > dnsperf-result-tcp-4.txt
This produces the following results:
Interval Statistics:

  Queries sent:         92573
  Queries completed:    92474 (99.89%)
  Queries lost:         0 (0.00%)

  Response codes:       NOERROR 92474 (100.00%)
  Average packet size:  request 43, response 59
  Run time (s):         1.001029
  Queries per second:   92378.942069

  Average Latency (s):  0.001051
  Latency StdDev (s):   0.001976
The same general behavior observed in the UDP tests applies here. The test begins with an initial burst reaching approximately 93k QPS, with the first few intervals showing higher throughput than the rest. After approximately 40 seconds, performance stabilizes, a pattern visible in the Grafana dashboard shown in Figure 6.
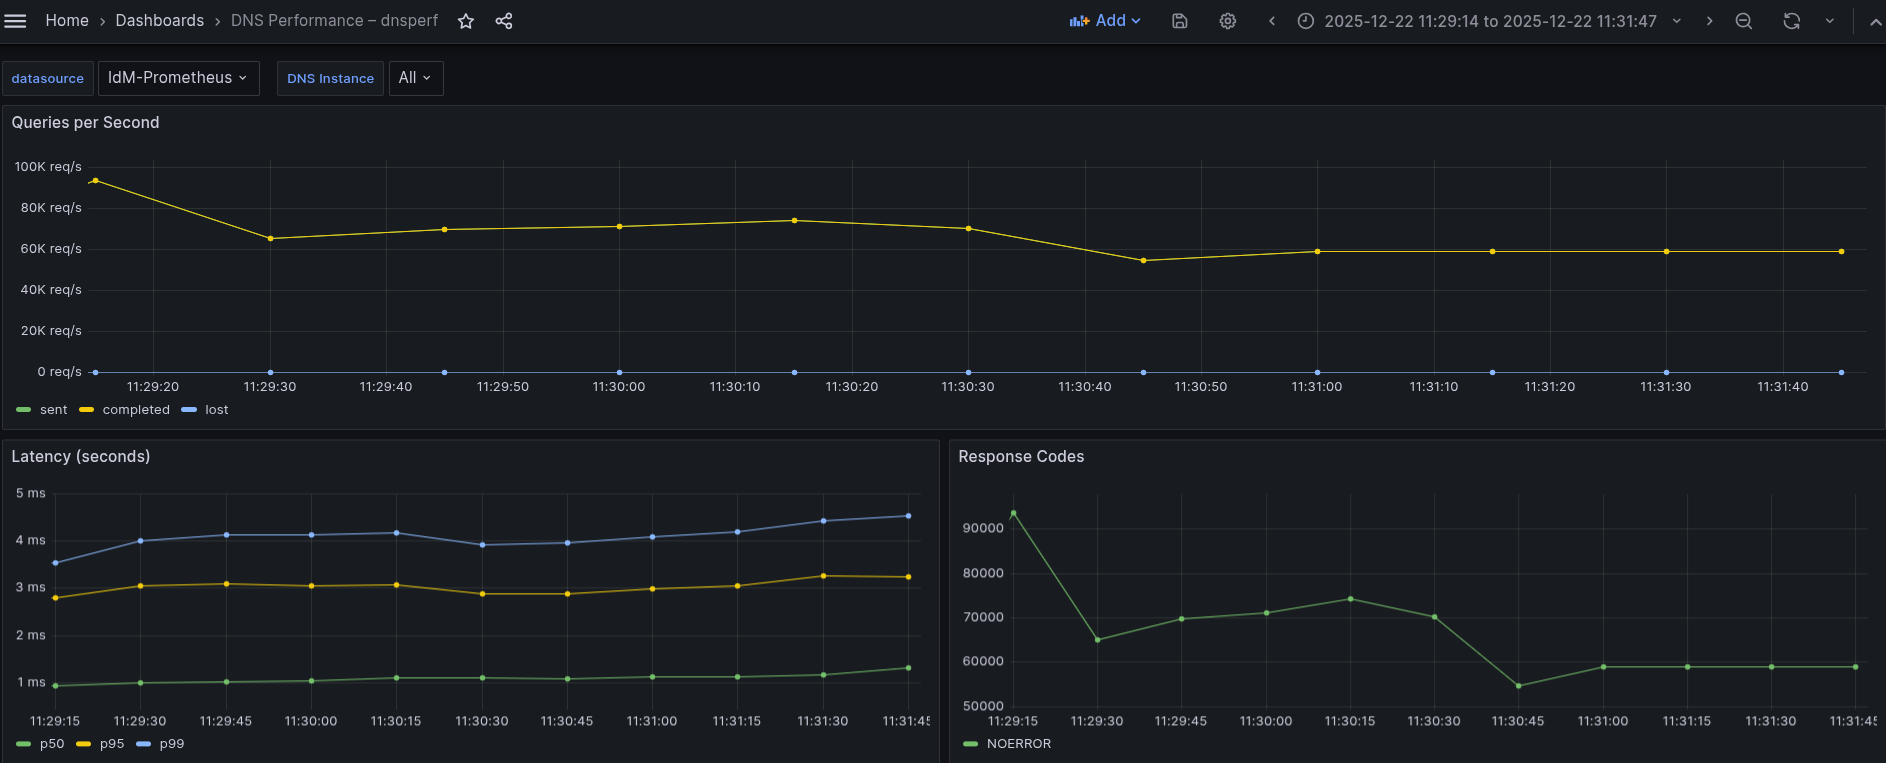
This graph shows:
- An initial peak close to 90–95k QPS
- A sharp drop within the first few intervals to around 65–70k QPS
- A gradual decline followed by stabilization at approximately 55–60k QPS
- Lost queries remain at zero throughout the whole test
Interpretation:
- The initial peak corresponds to a startup burst, where client-side and server-side pipelines are not yet fully constrained.
- As the test progresses, protocol overhead and steady-state resource usage reduce throughput.
- The final flat section indicates a stable sustained throughput.
Conclusion: The system stabilizes at roughly 55-60k QPS, which represents the sustainable throughput under this test configuration.
Regarding latency percentiles, we see the following behavior:
- p50 latency increases slightly from ≈1.0 ms to ≈1.3 ms
- p95 latency stays in the ≈2.8-3.3 ms range
- p99 latency gradually rises from ≈3.5 ms to ≈4.5 ms, without spikes
Interpretation:
- Typical query latency (p50) remains very low and increases only marginally.
- Higher percentiles show the expected cost of sustained load and protocol overhead.
- The absence of sudden jumps or divergence between p95 and p99 indicates controlled queueing and no saturation.
Conclusion: As expected, latency increases compared to the UDP tests. However, it remains stable and predictable, with tail latency consistently below 5 ms, indicating healthy operation under load.
Why does UDP perform better than TCP?
As observed in our tests, UDP consistently outperforms TCP in terms of throughput and latency. This behavior is primarily due to UDP's minimal protocol overhead: it avoids connection management, acknowledgments, congestion control and retransmission logic. As a result, the DNS server can process more queries per second with lower latency.
With UDP, nearly all CPU cycles are devoted to DNS processing rather than transport-layer management, as is the case with TCP. Several factors contribute to this advantage: no negotiation, acknowledgements, congestion, error control, and no maintenance of per-client socket state. UDP is a natural fit for DNS workloads because DNS queries are typically small, idempotent, stateless, and independent.
DNS over TLS (DoT) test
All DNS over TLS (DoT) tests showed a consistent decrease in throughput and an increase in latency compared to TCP, and even more so when compared to UDP. The DoT tests were executed using the following command:
[server]# dnsperf -f inet -m dot -s idm.melmac.univ \
-p853 -T4 -c4 -l120 -d dnsrecords.txt \
-O latency-histogram -O verbose-interval-stats -S1 \
-O suppress=timeout,unexpected > dnsperf-result-dot.txt
The results:
Interval Statistics:

  Queries sent:         80384
  Queries completed:    80289 (99.88%)
  Queries lost:         0 (0.00%)

  Response codes:       NOERROR 80289 (100.00%)
  Average packet size:  request 43, response 59
  Run time (s):         1.001090
  Queries per second:   80201.580277

  Average Latency (s):  0.001079
  Latency StdDev (s):   0.002442
This behavior mirrors the observed in UDP and TCP tests, beginning with an initial burst that reaches a peak of approximately 83k QPS, and then stabilizes after the first 40 seconds or so. This pattern is visible in the Grafana dashboard shown in Figure 7:
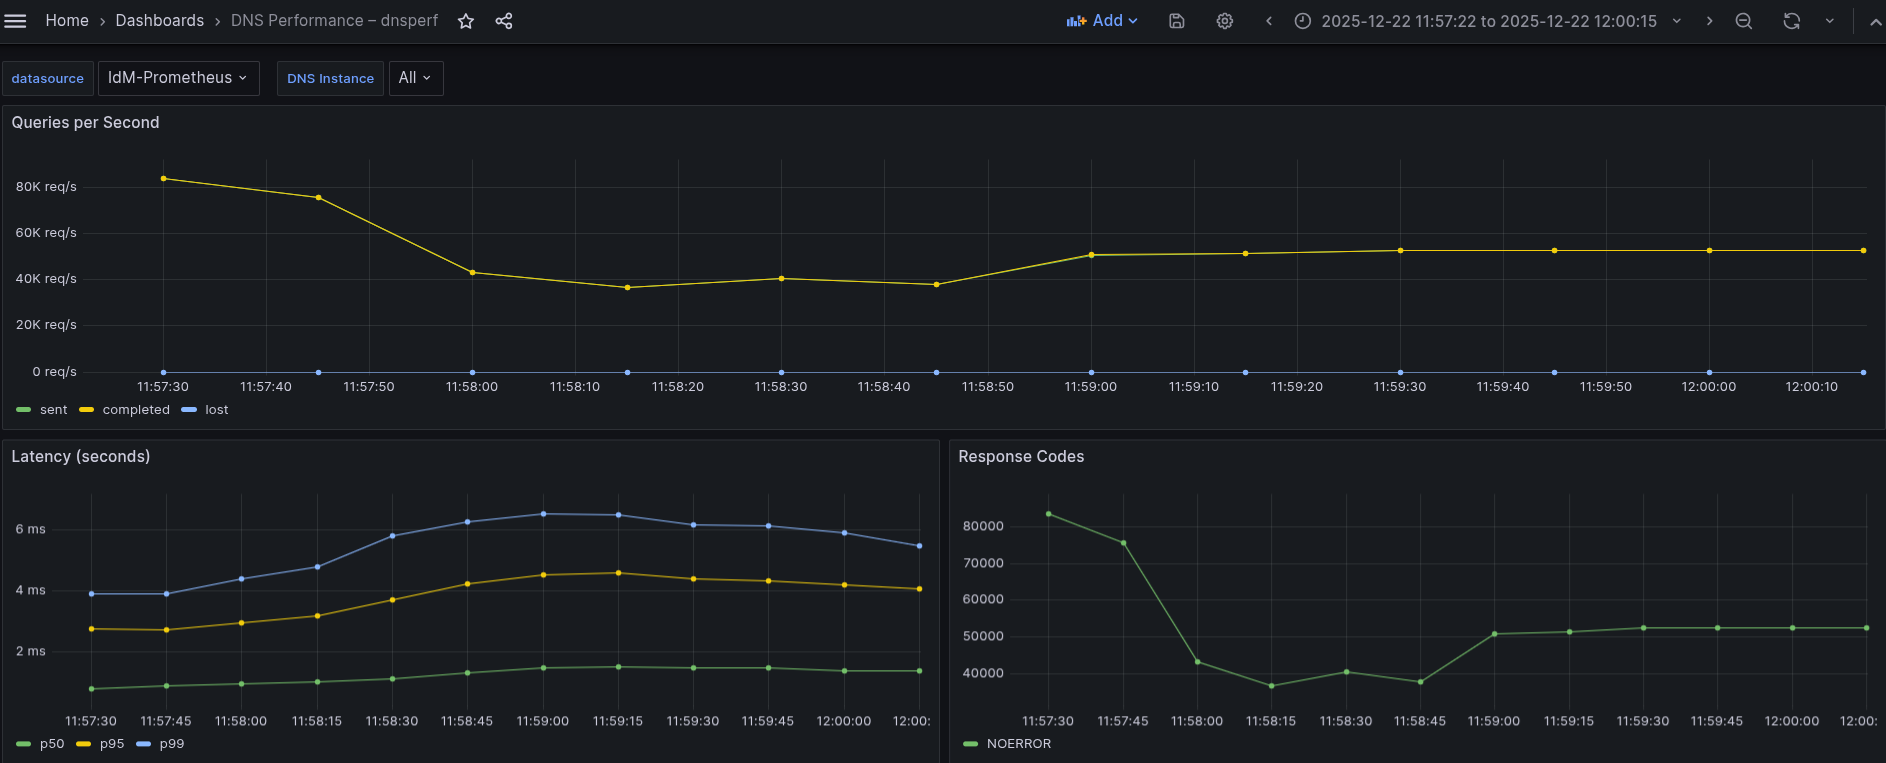
This graph shows:
- An initial burst peaking at roughly 80–83k QPS
- A sharp drop within the first ≈30-40 seconds to around 35-40k QPS
- Gradual recovery and stabilization at approximately 50–52k QPS
- Lost queries, as in all cases, remain at zero
Interpretation:
- The initial peak reflects the usual startup burst seen in all protocols.
- The sharp early drop is more pronounced than in UDP and TCP, due to:
- TLS handshake overhead
- Encryption/decryption costs
- Increased CPU usage
- Once TLS sessions are established and the system reaches steady state, throughput stabilizes.
Conclusion: Under sustained DoT load, the DNS service stabilizes at roughly 50k QPS, which is noticeably lower than TCP and significantly lower than UDP. This is expected, given the additional cryptographic overhead.
Regarding latency percentiles, we observe:
- p50 latency increases from ≈0.8 ms to ≈1.4 ms
- p95 latency rises from ≈2.7 ms to ≈4.5 ms, then slightly decreases
- p99 latency peaks around 6-6.5 ms before trending down toward ≈5.5 ms
Interpretation:
- Typical query latency increases moderately as encryption overhead is applied.
- Higher percentiles reflect the cost of TLS processing under load.
- The slight decrease in p95/p99 toward the end suggests the system reaches a stable encrypted steady state, rather than continuing to degrade.
Conclusion: Although latency is higher than in UDP and TCP tests, it remains stable and predictable, with tail latency consistently below 7 ms, indicating healthy operation under encrypted load.
Comparisons and conclusions
Based on the performance data for the UDP, TCP, and DoT tests, the following conclusions can be made:
The transition to DoT, while providing essential encryption for a zero-trust architecture (ZTA), introduces a measurable performance overhead compared to unencrypted DNS protocols. Comparative performance summary:
- UDP:
- Queries per second: 70-75k
- Query average latency (p50): ≈0.7-1.0 ms
- Tail latency: < 4 ms
- TCP:
- Queries per second: 55-60k
- Query average latency (p50): ≈1.0-1.3 ms
- Tail latency: < 5 ms
- DoT:
- Queries per second: 50-52k
- Query average latency (p50): ≈0.8-1.4 ms
- Tail latency: < 7 ms
The results show a clear and consistent performance ordering across all measured metrics, summarized as follows:
Queries per second
- Each additional protocol layer (UDP, TCP, DoT) introduces extra processing overhead, which directly impacts both throughput and latency. TCP shows a decrease of ≈20% in number of QPS regarding UDP, and DoT suppose a decrease of ≈10% in number of QPS regarding TCP, and also DoT compared to UDP supposes a reduction of ≈30%.
- UDP achieves the highest sustained throughput (70-75k QPS), and benefits from stateless design and minimal protocol overhead.
- TCP shows a noticeable reduction in throughput (55-60k QPS), reflecting the cost of connection management, acknowledgments, and flow control.
- DoT delivers the lowest throughput (50–52k QPS), as TLS encryption and decryption add further CPU and processing overhead on top of TCP.
Conclusion: Security and reliability come at a measurable cost in raw throughput.
Latency percentile (p50)
- UDP exhibits the lowest median latency (≈0.7-1.0 ms), making it the fastest option for typical DNS queries.
- TCP increases median latency slightly (≈1.0-1.3 ms) due to transport-layer overhead.
- DoT shows comparable but slightly higher median latency (≈0.8-1.4 ms), influenced by TLS processing.
Conclusion: For most queries, the latency impact of TCP and DoT is modest and acceptable.
Tail Latency (p99)
- UDP maintains very tight tail latency, with p99 consistently below 4 ms.
- TCP shows a moderate increase in tail latency, staying below 5 ms.
- DoT has the highest tail latency, but remains bounded below 7 ms.
Conclusion: Even under load, all protocols remain stable, with no evidence of saturation that can significantly impact the performance.
Recommendations
Based on the observed throughput and latency characteristics, the choice of DNS transport protocol should be guided by the specific requirements of each deployment environment. Consider these three options:
Use UDP when performance is the primary goal
UDP consistently delivers the highest throughput and lowest latency, making it the best option for environments where maximum performance is critical and the network is reliable. Its stateless design and minimal protocol overhead allow DNS servers to process a higher volume of queries with very low tail latency. UDP is therefore well suited for internal networks, controlled data center environments, and performance-sensitive workloads.
Use TCP when reliability and robustness are required
TCP introduces a moderate performance penalty compared to UDP but provides built-in flow control and congestion management. This makes it a good compromise in scenarios where reliability is more important than raw throughput, such as networks prone to packet loss or environments with complex routing and NAT behavior. TCP maintains stable latency and error-free operation under sustained load.
Use DoT when security and privacy are priorities
DNS over TLS offers strong privacy guarantees by encrypting DNS traffic, protecting it from inspection and manipulation. While DoT incurs additional overhead in both throughput and latency due to TLS processing, the performance remains stable and predictable. DoT is recommended for security-sensitive deployments, public-facing services, and environments where confidentiality outweighs the cost of reduced performance.
Summary
In short, UDP provides the best performance, TCP offers a balanced trade-off between performance and reliability, and DoT delivers enhanced security with an acceptable performance penalty. Selecting the appropriate protocol depends on whether performance, reliability, or security is the dominant requirement.
IdM now relies on the BIND 9.18 version, and a switch is planned to 9.20, which will supposedly be a drastic improvement and better numbers are expected in latency and QPS.
Because IdM is included in your RHEL subscription, you can replicate these tests in your own lab environment without any additional subscriptions. If you are not already a RHEL subscriber, get a no-cost trial from Red Hat.
