With the release of Red Hat build of Cryostat 4.1, you can now perform a set of useful diagnostic operations on Java applications running in Red Hat OpenShift or Kubernetes using the diagnostics card and the new diagnostics/capture page. While previous versions supported invoking garbage collection, with Cryostat 4.1 you can also capture, archive, and download thread and heap dumps.
Troubleshooting tools
The Java Virtual Machine (JVM) supports many diagnostic operations for troubleshooting problems with a running application. Among these operations, thread and heap dumps are important for diagnosing issues with concurrency and memory.
Thread dumps, a profiling tool built into the JVM, allow you to capture a snapshot of all the threads currently running within a JVM process at a specific moment in time. They provide detailed information about each thread to aid in diagnosing performance issues, identifying deadlocks, and determining other problems related to concurrency.
The heap dumps profiling tool allows you to capture a snapshot of all the memory currently in use within a JVM process at a specific moment in time. They provide detailed information about all Java objects and classes residing in heap memory at the time which aids in diagnosing performance issues, memory leaks, and other problems with memory usage.
Capturing a thread dump
To capture a thread dump, Cryostat must have access to a target application. For information on setting up applications for monitoring, go to the Red Hat Product Page or the upstream documentation website. Thread dumps are supported over both JMX and Cryostat Agent HTTP connections.
To begin, navigate to the Diagnostics/Capture page shown in Figure 1:
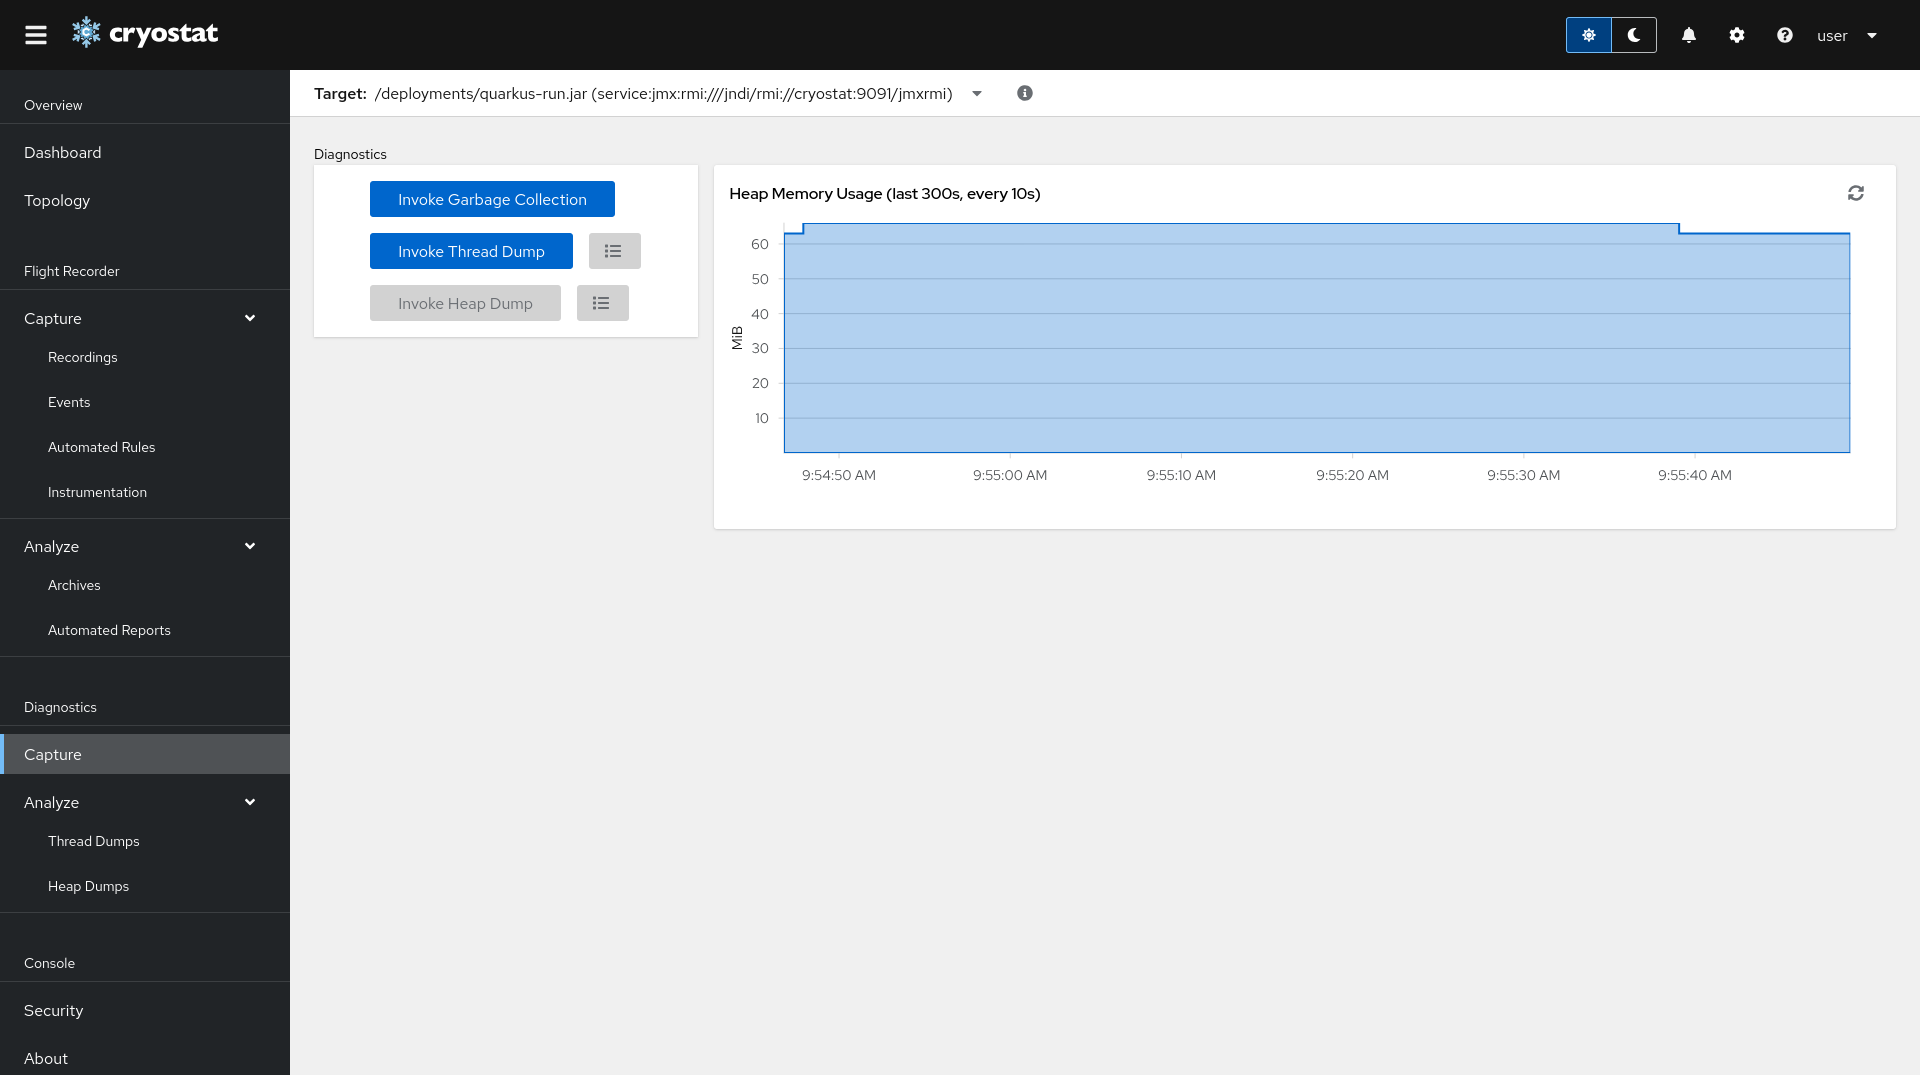
This page provides an overview of heap memory usage by the target, and has a card with the supported diagnostics operations.
You can click the Invoke Thread Dump button in the middle of the card at any time to trigger a thread dump that will then be uploaded to the archives. Following this, you can click the button next to the Invoke Thread Dump button to go to the archives, or navigate there manually by clicking on Thread Dumps under Analyze (Figure 2).
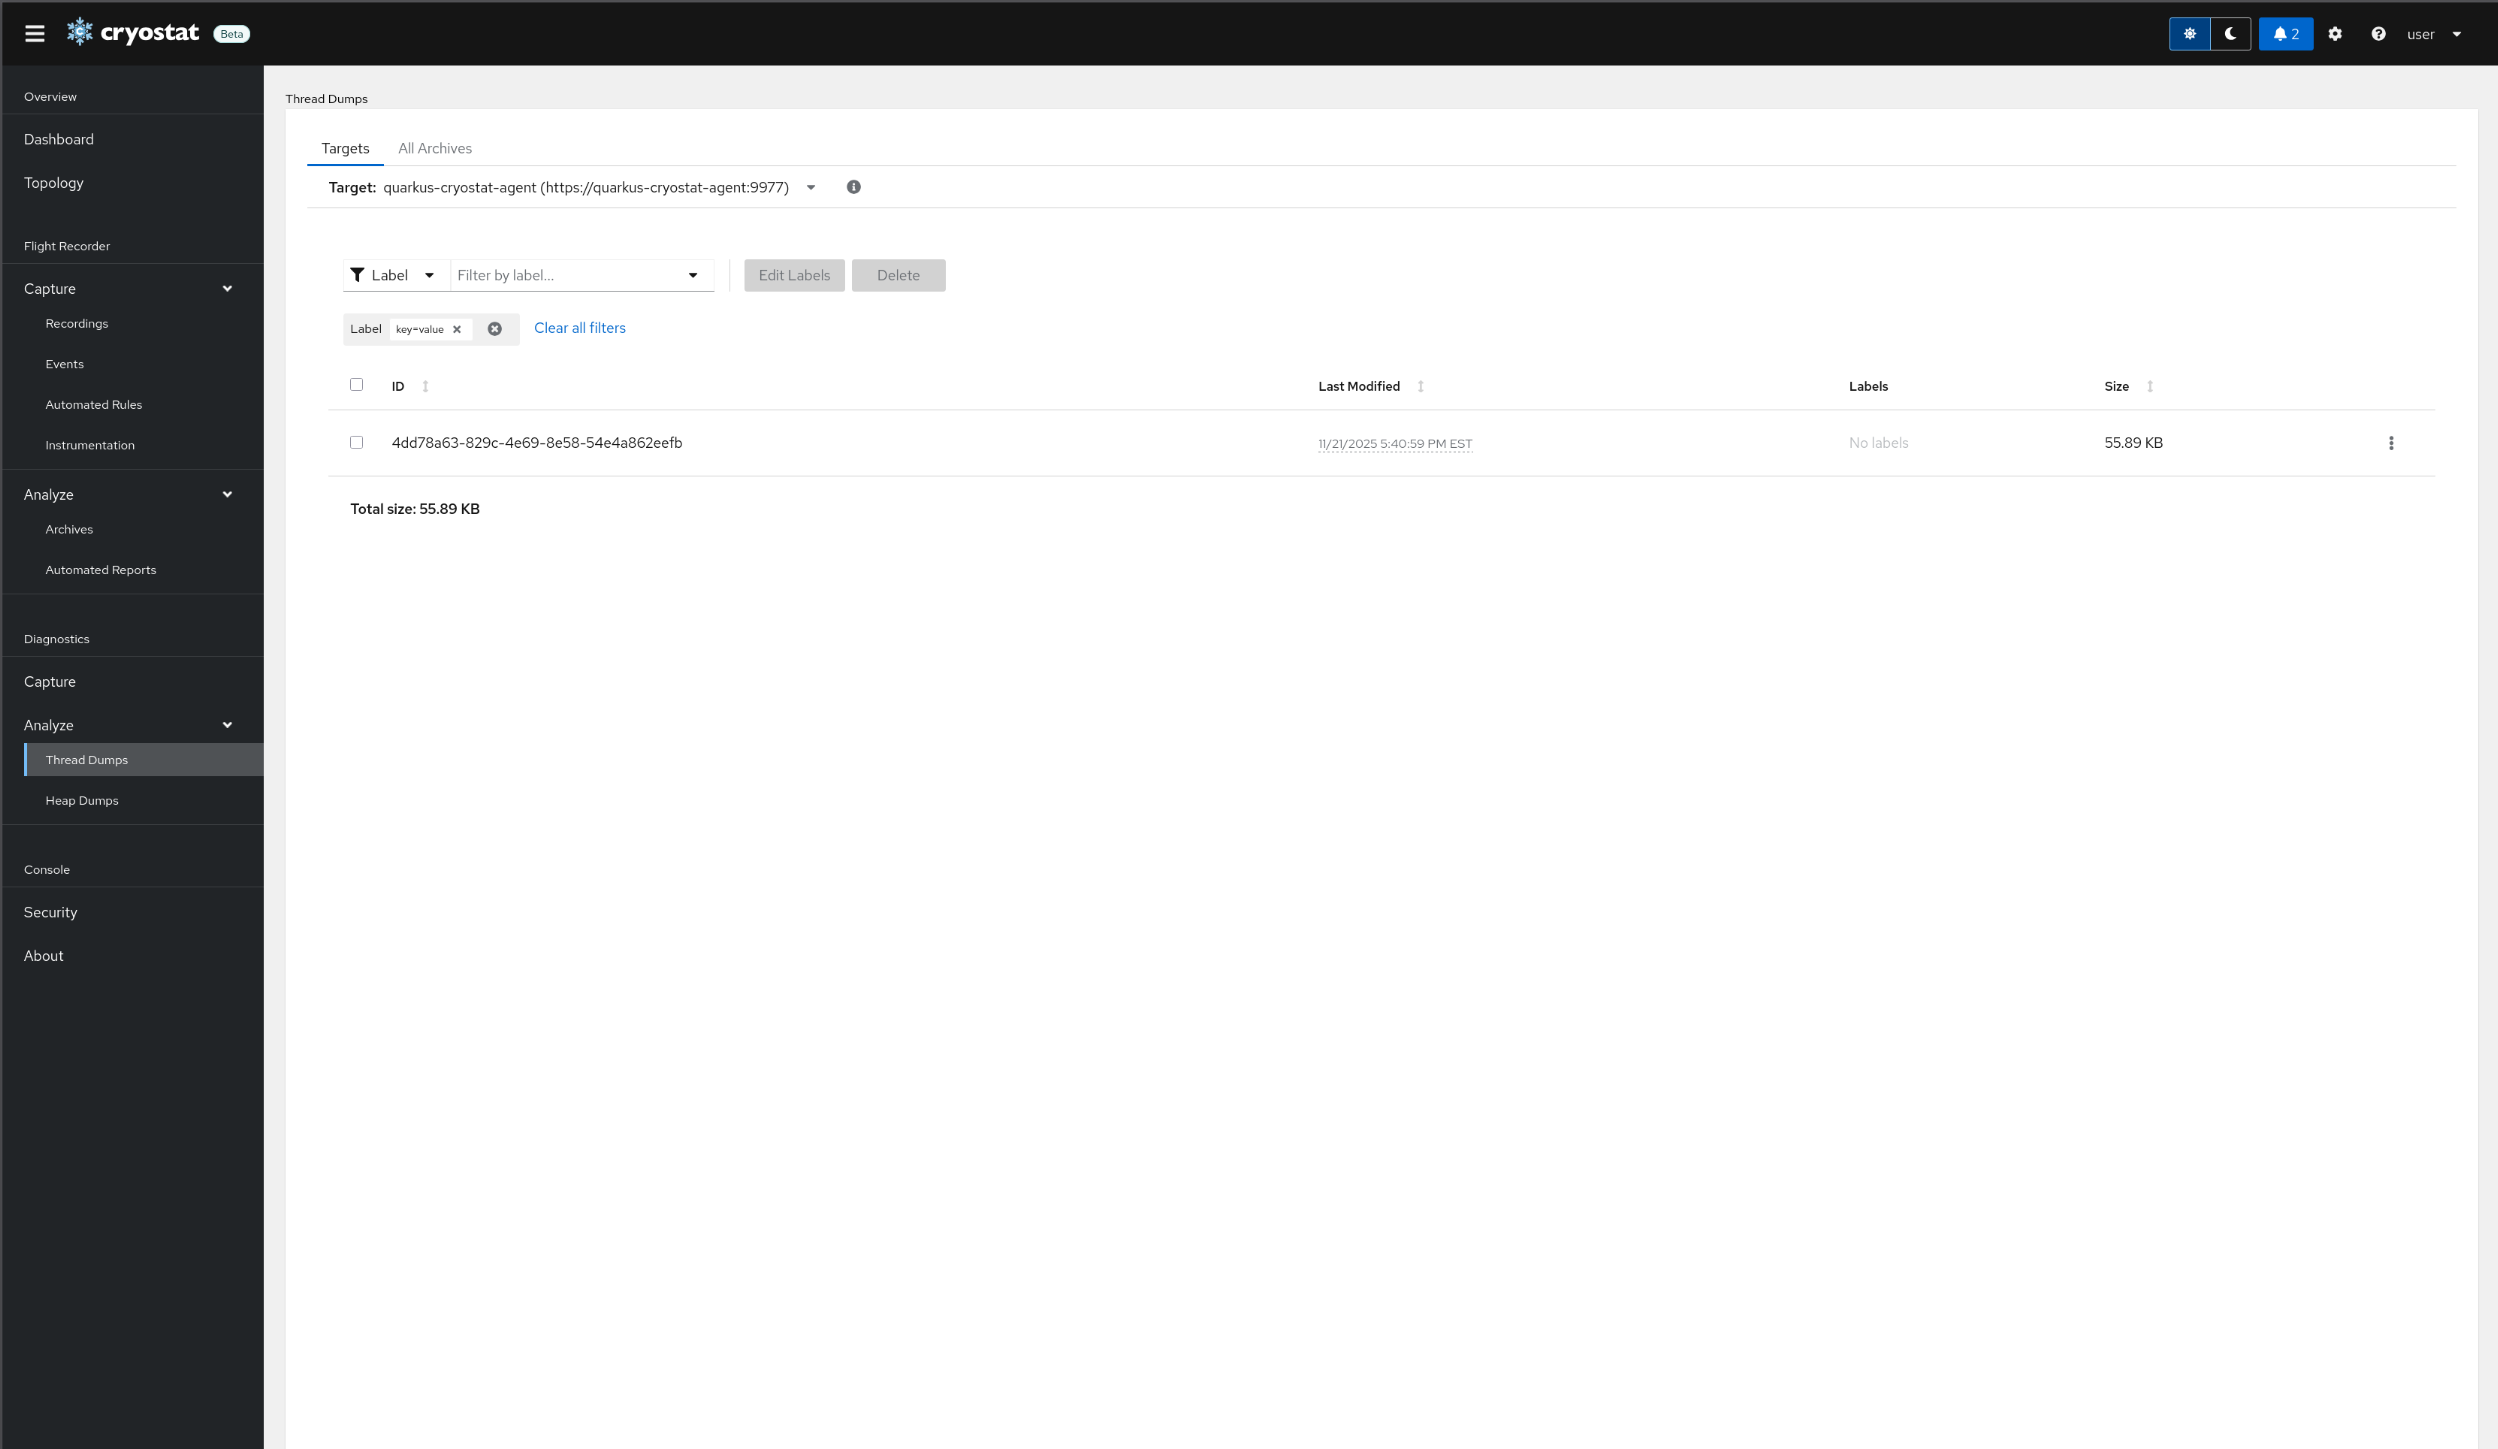
Once the thread dump has been archived, a new entry will appear in the target JVM's Thread Dumps table. All thread dumps that were saved from the current target will be listed here in their own table.
Switching to a different target from the dropdown will list only the thread dumps archived from that source target. Alternatively, clearing the target will provide access to the All-Targets view. There is also an All-Archives view that allows access to all thread dumps currently available in storage.
The name of the thread dumps when downloaded reflects the address of the target application. Thread dumps also support labels for enhanced filtering capabilities.
Capturing a heap dump
To capture a heap dump, Cryostat must have access to a target application. For information on setting up applications for monitoring, refer to the Red Hat Product Page or the upstream documentation website. Heap dumps are only supported over Cryostat Agent HTTP connections. For more information on setting up the cryostat agent, read this article.
To begin, navigate to the Diagnostics/Capture page in Figure 3.
You can click the Invoke Heap Dump button in the middle of the card at any time to trigger a heap dump that will then be uploaded to the archives. Following this, you can click the button next to the Invoke Heap Dump button to be taken to the archives, or navigate there manually by clicking on Heap Dumps under Analyze (Figure 4):
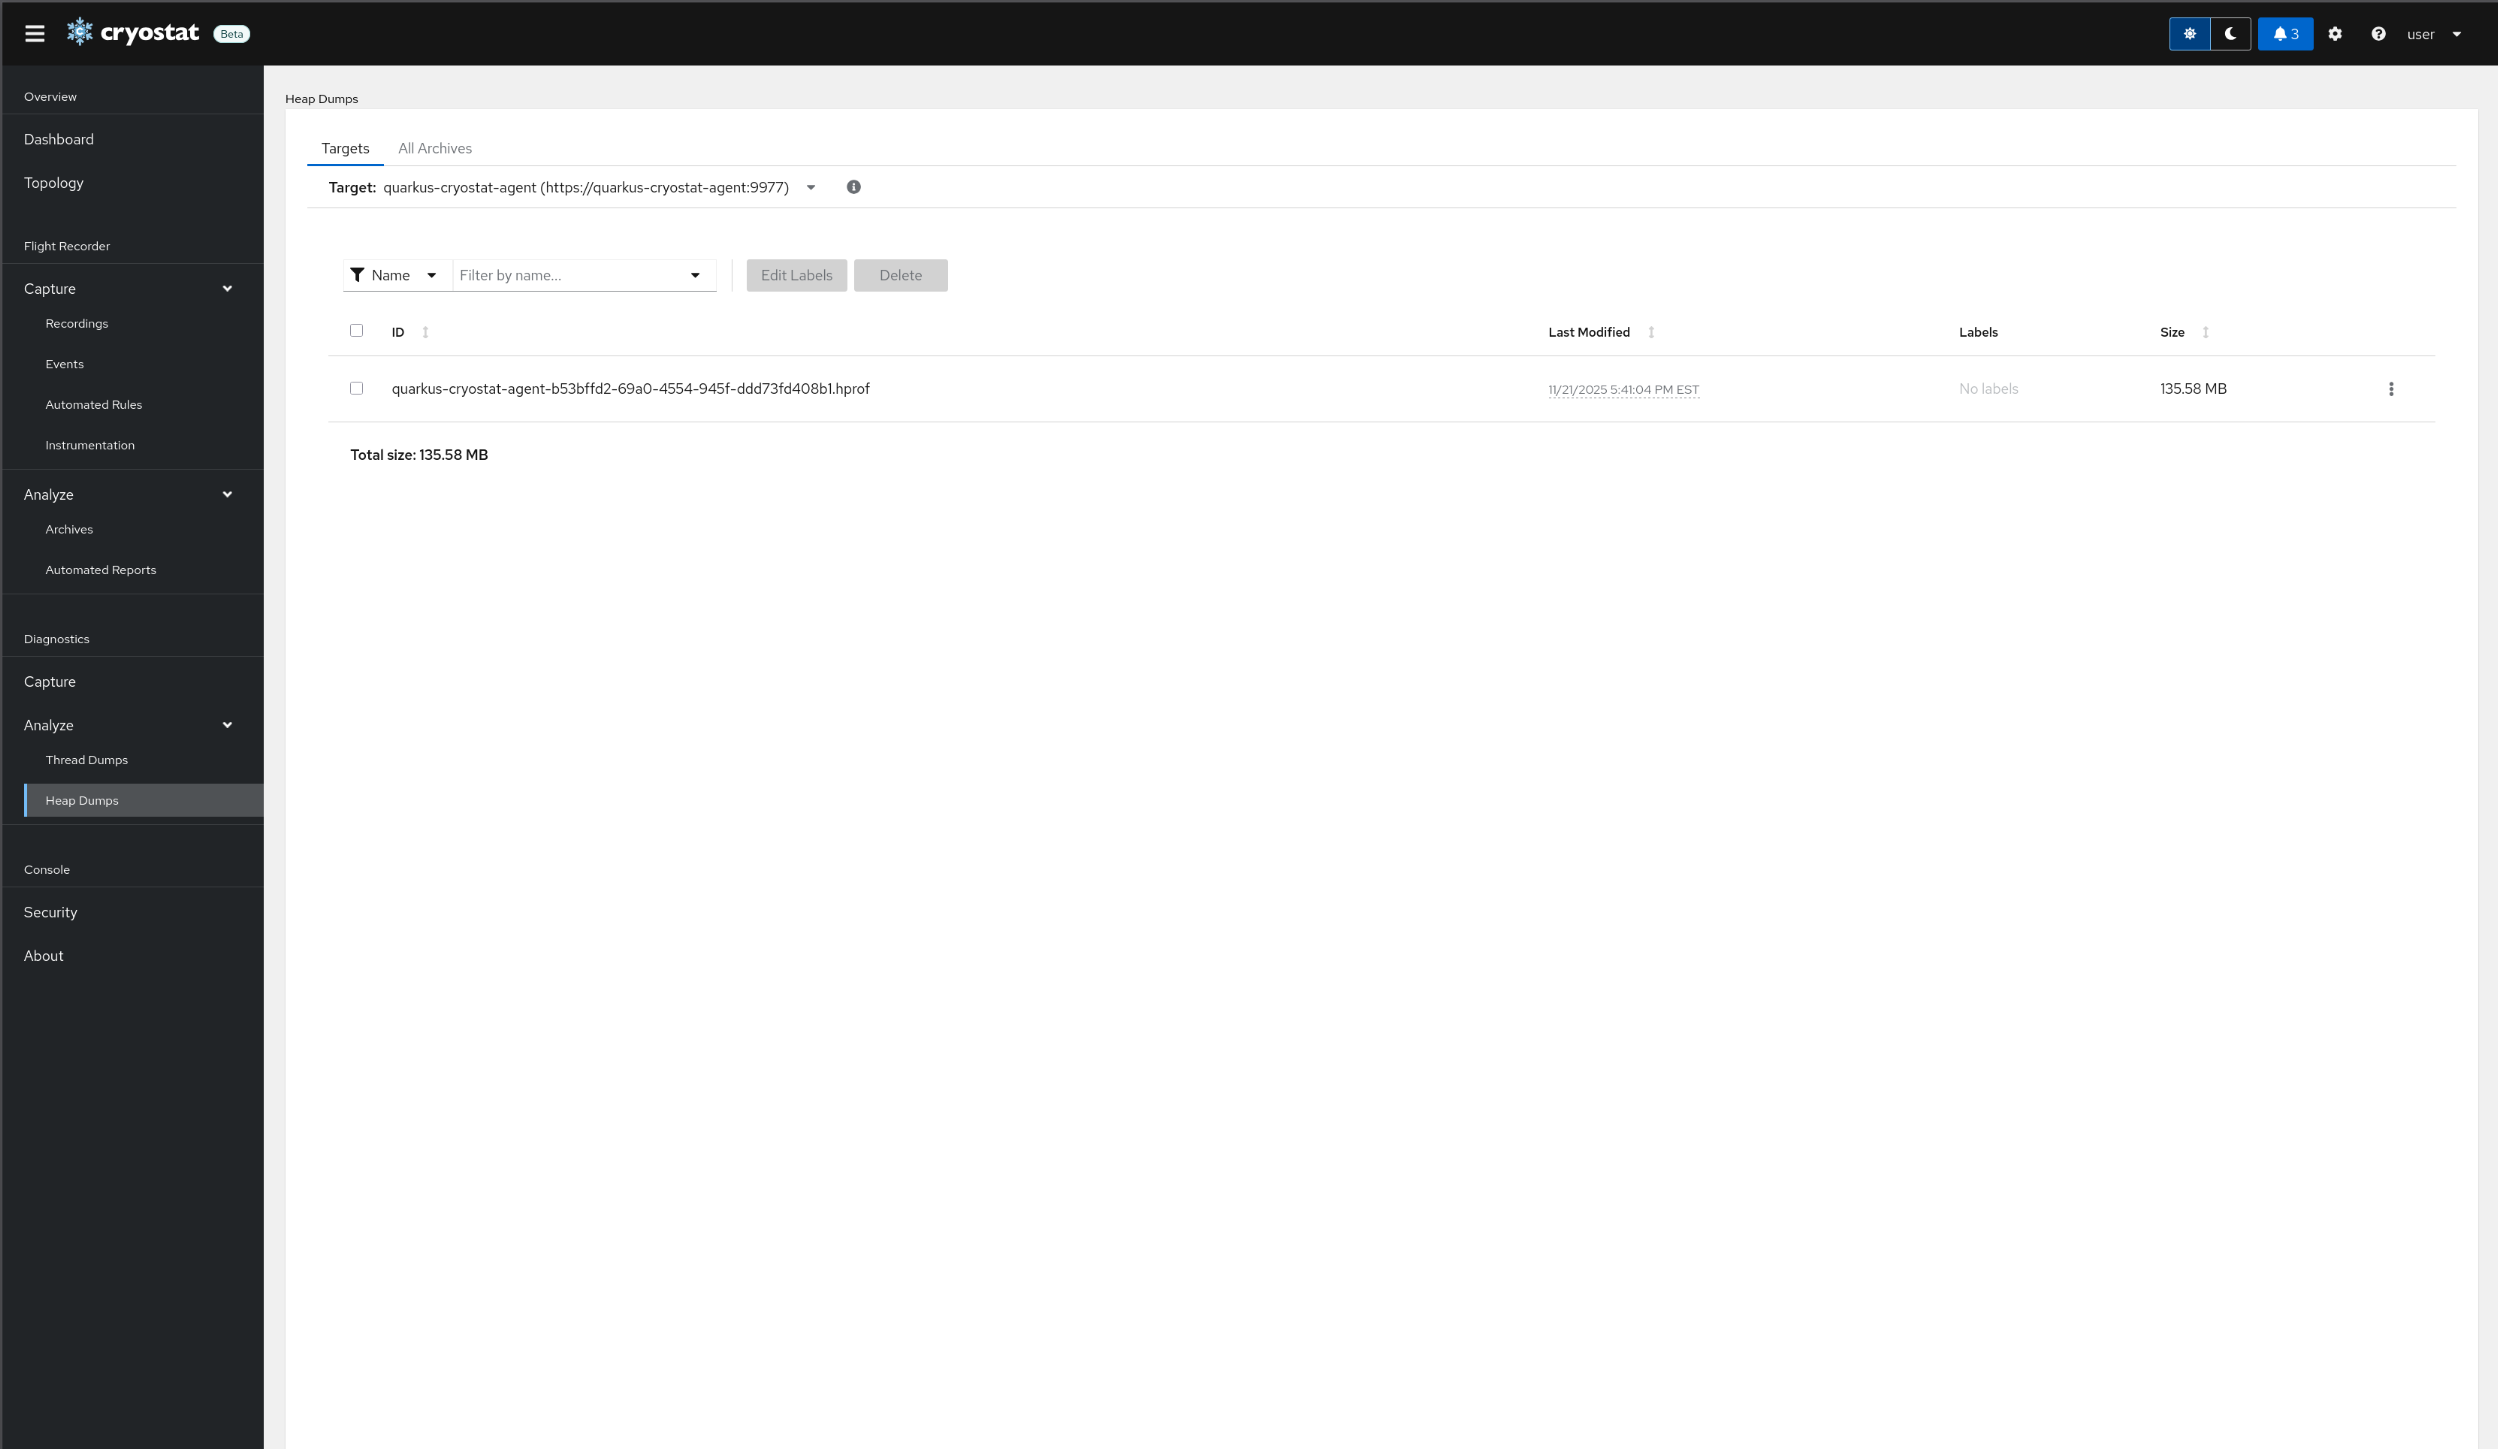
Once the heap dump has been archived, a new entry will appear in the target JVM's Heap Dumps table. All heap dumps that were saved from the current target will be listed here in their own table.
Switching to a different target from the dropdown will list only the heap dumps archived from that source target. Alternatively, clearing the target will provide access to the All-Targets view. There is also an All-Archives view that allows access to all heap dumps currently available in storage. This ensures that even if a target goes offline the heap dumps captured from it are still accessible.
The name of the heap dump in the table reflects the address of the target application. Heap dumps also support labels for enhanced filtering capabilities.
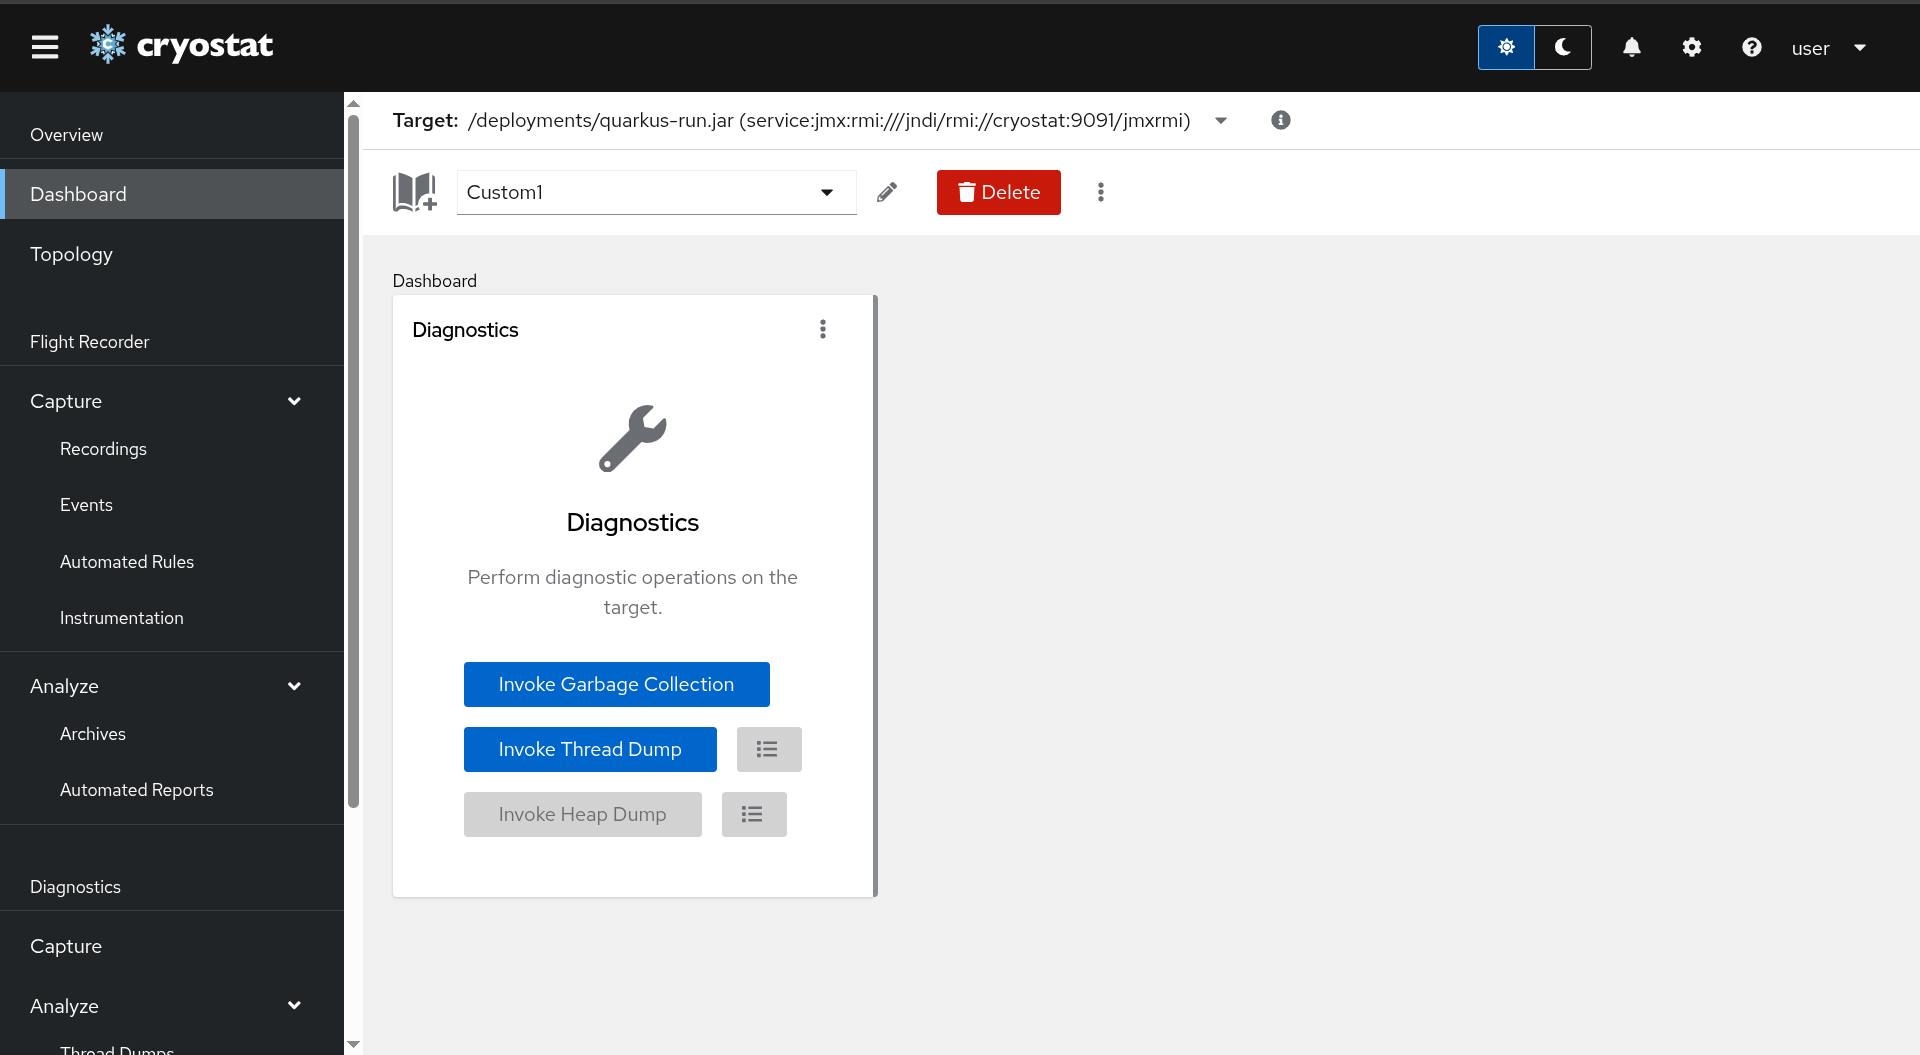
The diagnostics dashboard card
In addition to the dedicated diagnostics page, Cryostat also provides a dashboard card with the diagnostics operations available. This allows you to have a flexible view of a number of metrics and other operations supported by the dashboard cards alongside the diagnostic capabilities (Figure 5).
Wrap up
With the release of Cryostat 4.1, it is now possible to capture advanced diagnostics information about your running applications through thread and heap dumps. For more information and analysis available in Cryostat, refer to the Red Hat Product Page or the upstream documentation website.