Apache Camel has been a well-established integration framework for almost 20 years. The power of the Enterprise Integration Patterns combined with great flexibility and a lightweight execution footprint, makes it a great choice among community and product users. As Camel targets Quarkus and Spring Boot runtimes, it is also a great choice when running integrations on Red Hat OpenShift.
A Camel dashboard on OpenShift
When you're running Camel applications on OpenShift and adopting a microservices-based architecture, the number of workloads can grow to a large number. With a great number of Camel applications running, it may be difficult to have a quick understanding of how your entire fleet of Camel applications behaves and if there is a workload that may require some attention. As part of the operation team, you may be asked to provide a report on all the Camel applications. Without a central point of management, such a task can become cumbersome.
Recently, we've started to develop a side project that can help. The Camel dashboard is the ultimate project to simplify the visualization of all the Camel workloads running in a cluster. It does not add any fancy features, just a quick and simple (but necessary) visualization of what's going on with all your running Camel applications. At any point, you can look at the dashboard and receive immediate alerts if there is something wrong.
Camel observability
In the recent developments of Apache Camel, we have worked on a component that can simplify monitoring activities with zero configuration. It is called camel-observability-services, and it's just a group of existing components that will provide a standardized exposure of metrics the dashboard can check. The presence of this component is not mandatory; however, it is in general highly advisable to use it becuase it instruments the Camel application with the latest components required to provide a full level of observability. You can learn more about our plan to promote observability on Camel applications.
Camel dashboard features
To use the Camel dashboard, you will have to install the Camel dashboard operator and a graphical user interface for the OpenShift plug-in. The operator can discover the Camel applications running in the cluster and scrape certain metrics to understand the health of your applications.
The GUI visualizes the list of the applications running, and the human operator can get a quick understanding of the Camel fleet status. Figure 1 provides a snapshot of how this will look.
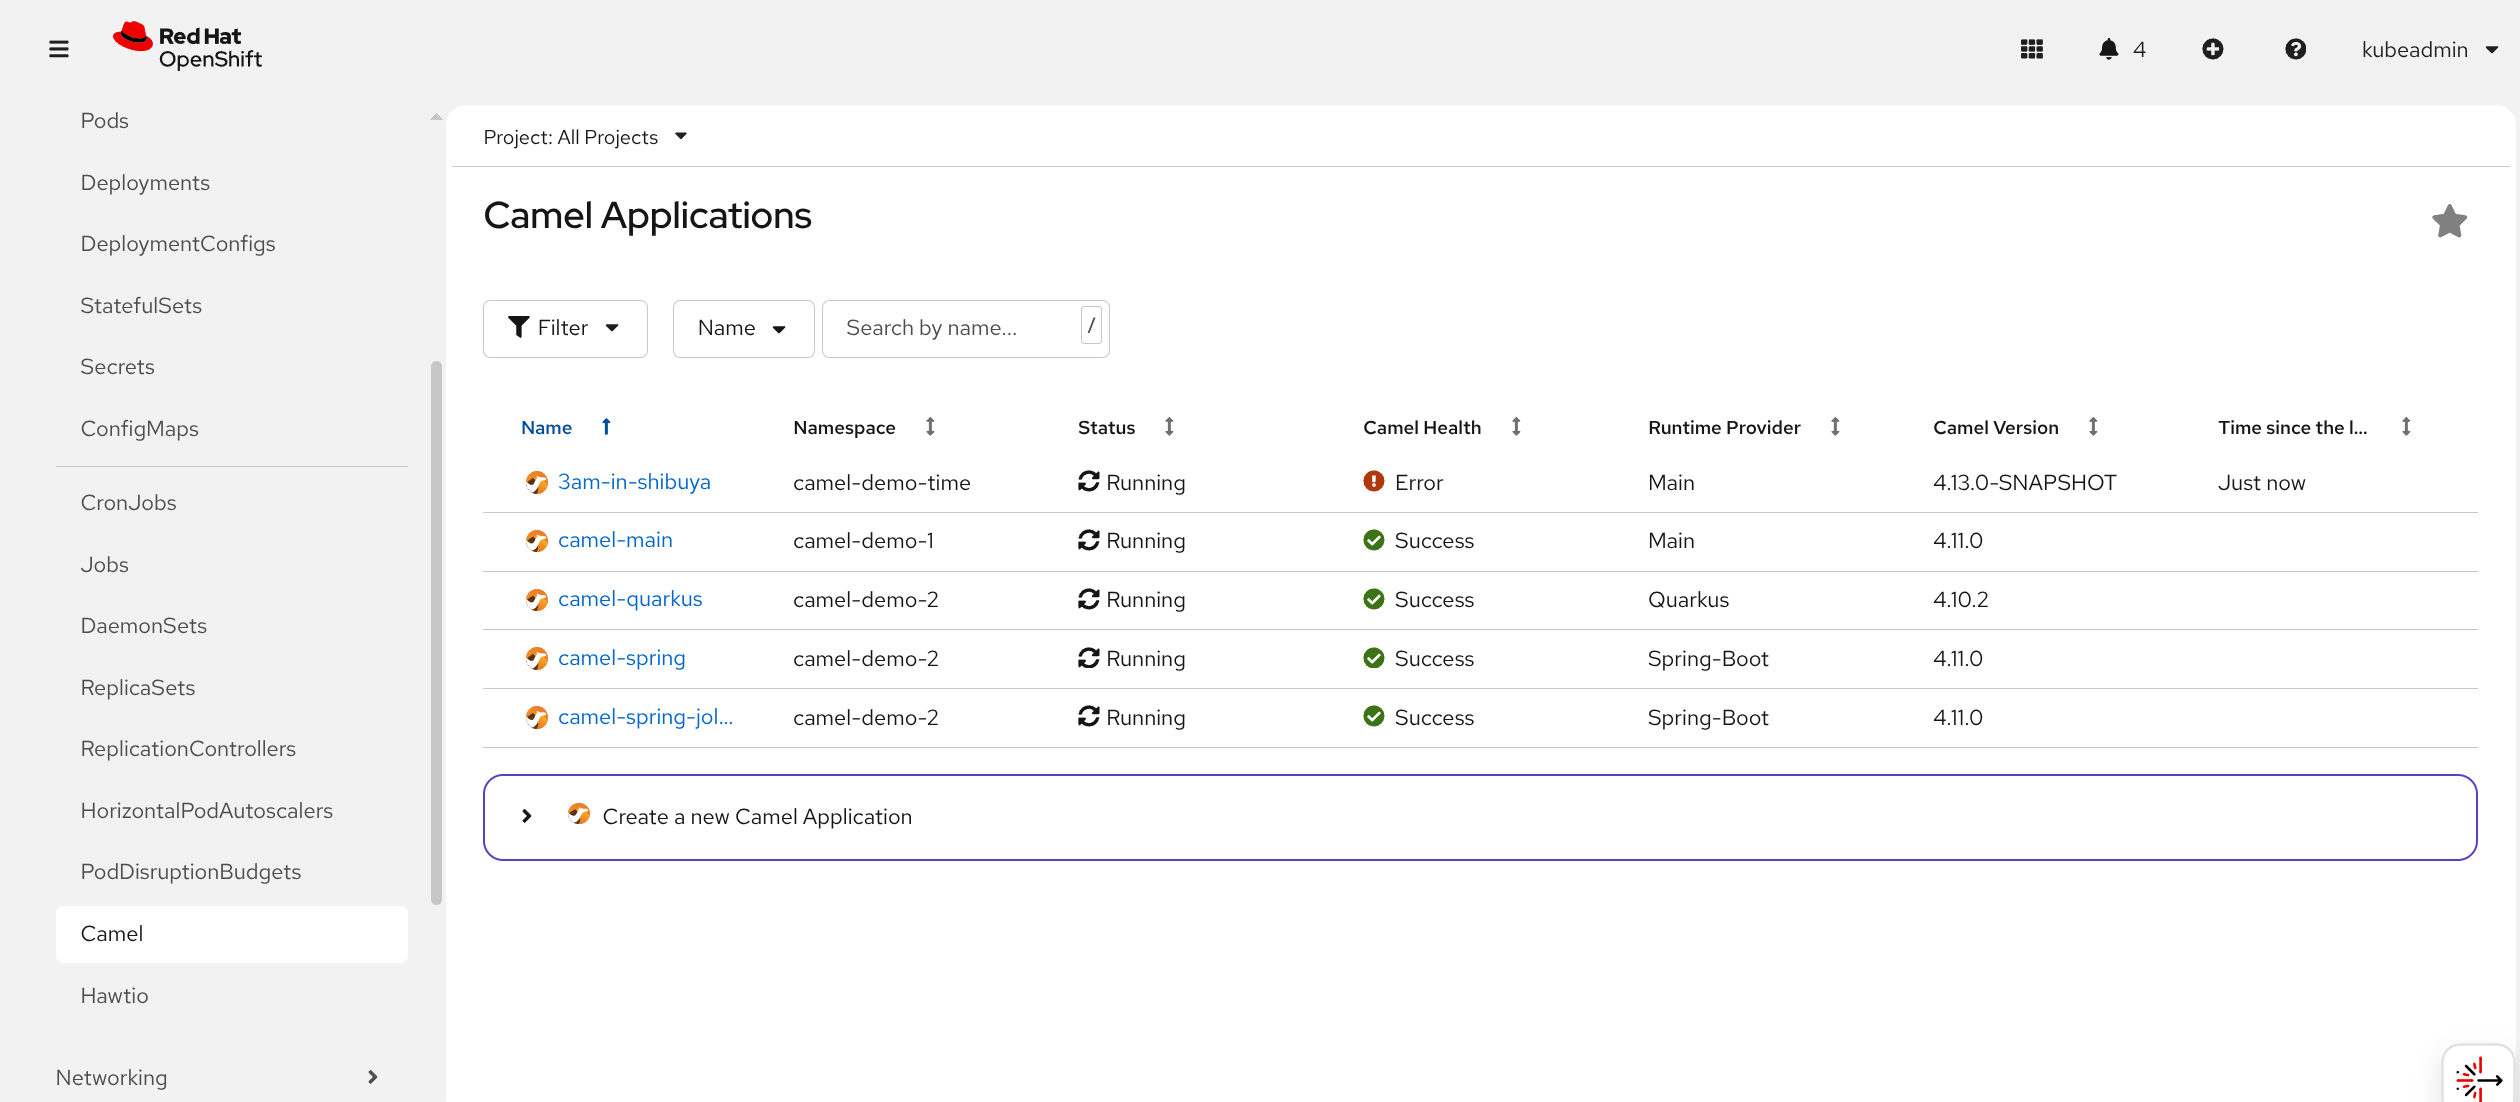
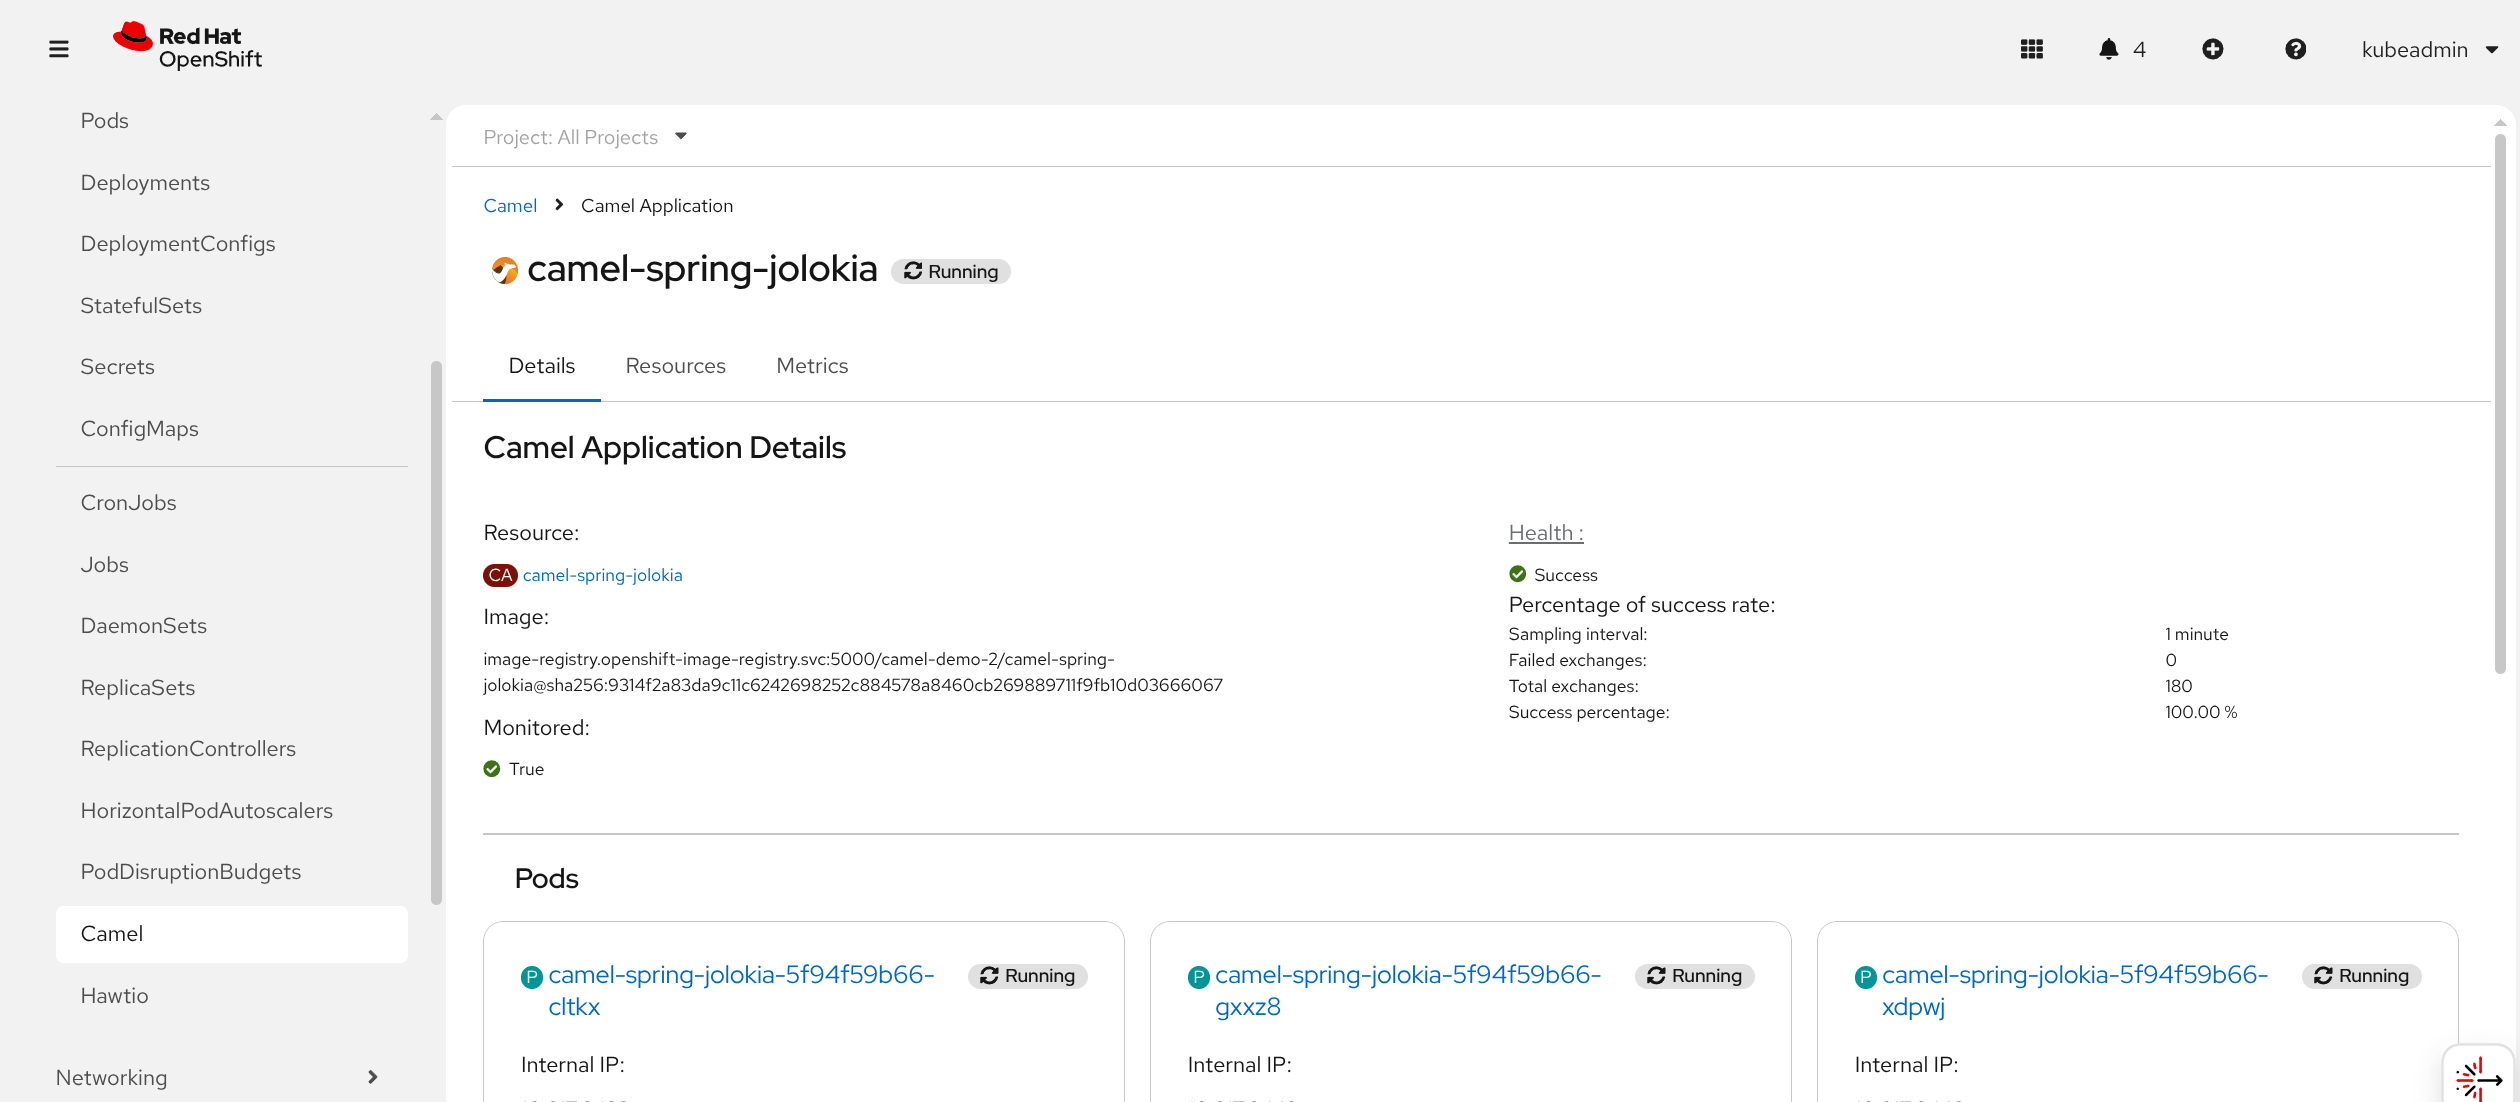
Click the Create Camel application link to learn how to onboard a new Camel application in the dashboard. The nice thing is that you will be able to more deeply inspect the Camel application directly from the GUI with runtime execution parameters (e.g., the number of messages and the last time the application produced/consumed a message), as shown in Figure 2.
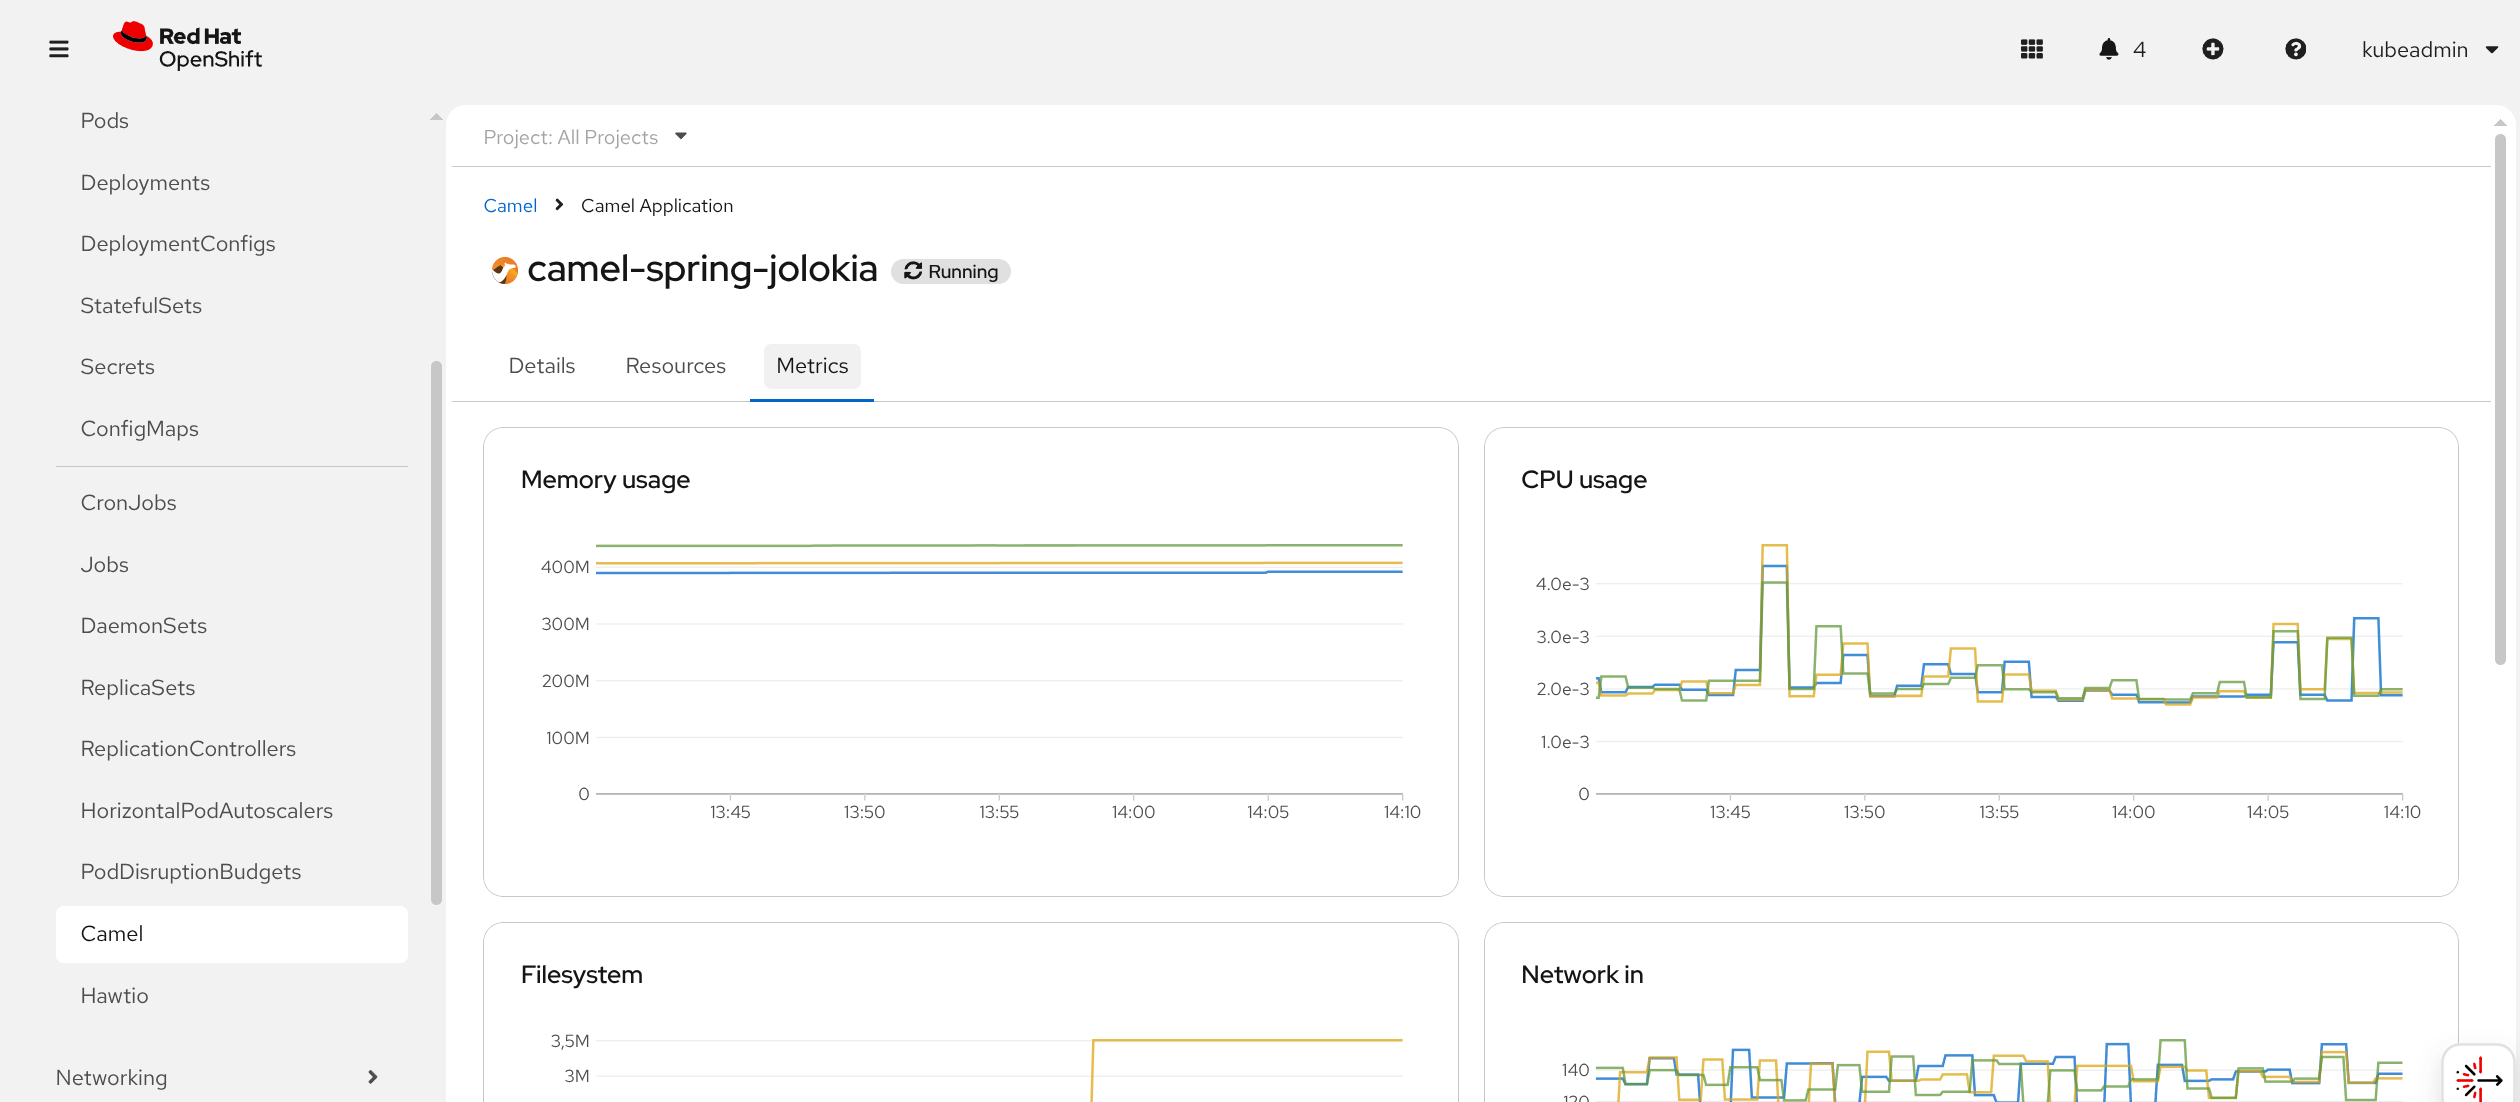
You can also check the monitoring diagrams to view your application performance (Figure 3):
Additionally, you can also inspect even more deeply via the Hawtio console plug-in, as shown in Figure 4.
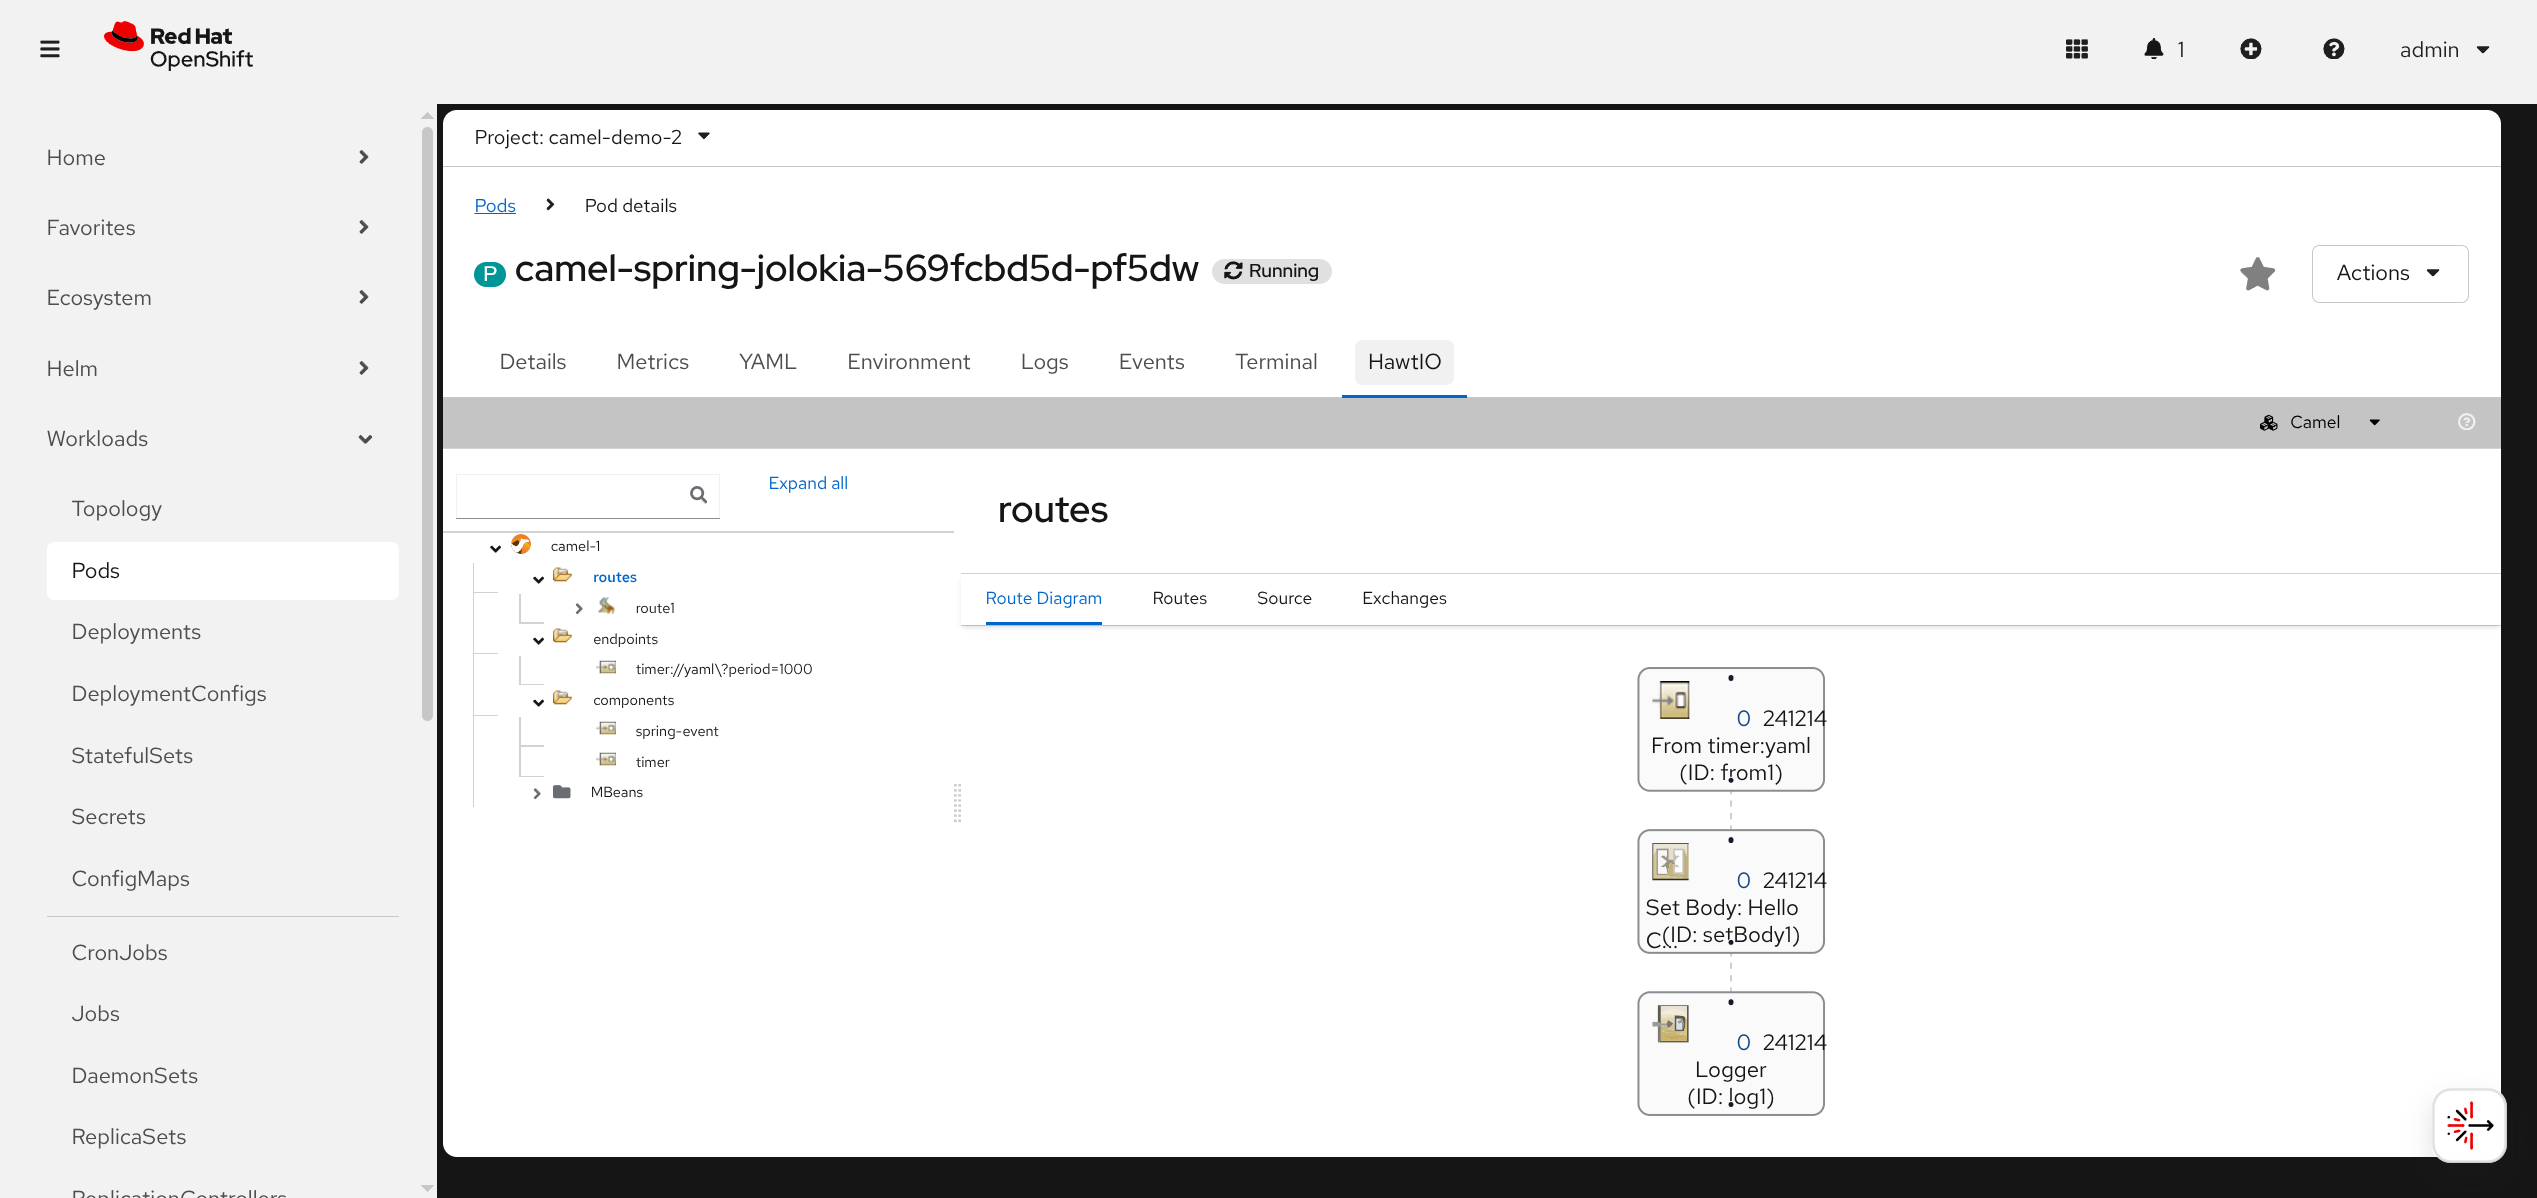
This is a JMX based plug-in, showing insights into the Camel route at a very low level. The two plug-ins can self-discover, so the dashboard will provide a direct link out of the box.
The goal of this dashboard is to provide a quick health check for the applications. You can definitely complement this tool with more advanced tools, such as Prometheus and Grafana.
Exchange service level indicator
The main feature of the Camel dashboard is displaying how many messages (exchanges) are running during each polling interval of time. With this information, you may set up a service level indicator (SLI) and receive notification if such an SLI fails or reaches a warning threshold.
As suggested in the official documentation, the operator automatically calculates the percentage of successful message exchanges over the last polling interval. Based on this success rate, it assigns a status of Success, Warning, or Error. By default, an Error status is returned if more than 10% of exchanges fail, and a Warning is returned if more than 5% fail. You can configure these threshold values.
Another important indicator is how long the application has been idle. This is of great importance when the Camel application is running fine (health is OK), but the upstream producer (e.g., a JMS queue or a Kafka topic) is stuck with some problem, and this Camel workload sits idle waiting for some event.
Install the Camel dashboard
To use the Camel dashboard, you can follow the official upstream installation instructions. You need to install an operator, the OpenShift dashboard console plug-in, and the OpenShift Hawtio console plug-in (if you’re also interested in deeper Camel inspection via JMX).
Onboarding Camel applications
To onboard a Camel application on the dashboard, you can follow the instructions provided in the Camel dashboard quick start. Create a demo Camel application as follows (skip this step if you have any other deployment you want to test):
kubectl create deployment camel-app-main --image=docker.io/squakez/db-app-main:1.0 Label the deployment the dashboard will discover:
kubectl label deployment camel-app-main camel.apache.org/app=camel-app-main The Camel dashboard will almost immediately create a new entry in the Camel applications you can check via the GUI previously shown or via the CLI:
kubectl get camelapps
NAME                PHASE     LAST EXCHANGE   EXCHANGE SLI   IMAGE                                  REPLICAS   INFO
camel-app-413       Running   8m32s           OK             squakez/cdb:4.13                       1          Main - 4.13.0-SNAPSHOT (4.13.0-SNAPSHOT)
In a real environment, you will probably need to automate the onboarding step into your deployment tool (any CI/CD or other application). You will have to configure the operator about how you’re labeling your Camel workloads (or configure your deployment tool with the default labeling expected by the dashboard, as we did in the quick start example).
Next steps
The project is available in the Red Hat build of Apache Camel 4.14 (developer preview). You’re invited to start managing your fleet of Camel applications. We’re eager to receive feedback and requests for future enhancements.
Last updated: December 10, 2025