In large-scale platforms like Red Hat OpenShift, seemingly small regressions in core components can have ripple effects across the cluster. As a performance engineering team, we perform continuous performance testing on builds to ensure stability, scalability, and efficiency. In OpenShift 4.20 payloads, we recently identified a kubelet regression that significantly impacted CPU consumption and pod readiness latency (i.e., time taken for pods to get ready since their creation on a cluster). This article details how we detected, investigated, and resolved this issue.
Problem discovery
While running automated scale tests on a 6-node control plane cluster, we detected a 30% increase in kubelet CPU usage and a 50% increase in pod ready latency.
Our changepoint detection tool Orion automatically flagged these deviations. We have this tool configured on all our CI jobs that run on a cron schedule. We receive notifications about these regressions via our internal Slack CI channel, which was our initial encounter in this case.
Initial clues
We had a few initial observations. We first observed regression when kubelet 1.33 landed in OpenShift during the Kubernetes 1.33 rebase. Rolling back to kubelet 1.32.6 immediately restored normal performance. This indicated a kubelet code change as the root cause.
Each Kubernetes rebase brings new features and improvements, and our performance engineering process ensures that OpenShift delivers these upstream changes while maintaining stability and reliability for our users. To investigate this, we compared the node status JSON of a randomly selected node between the previous stable job and the current unstable job based on our change point detection tool (i.e., Orion) output.
Reproduction and confirmation
We validated the regression using prow jobs. We found that re-triggered CI runs consistently reproduced the regression in 1.33. We also verified that reverting the kubelet restored baseline numbers in the same CI runs. Patch reverts the kubelet version to 1.32.6.
The CPU usage:
- With kubelet 1.33 → ~30–35% higher CPU usage
- With kubelet 1.32.6 → back to ~20–25% baseline
Pod readiness latency:
- With kubelet 1.33 → ~3000 ms
- With kubelet 1.32.6 → ~2000 ms
You can see how the changepoints looked in the CI logs next.
### For CPU usage
+----+--------------------------------------+----------------------+------------------------------------------------------------------------------------------------------------------------------------------------------------------------------------+---------------+------------------+---------------------+
| ID |                UUID                  |       timestamp      |                                                                                          build_url                                                                                 |      value    |  is_changepoint  |        delta        |
+----+--------------------------------------+----------------------+------------------------------------------------------------------------------------------------------------------------------------------------------------------------------------+---------------+------------------+---------------------+
| 28 | 35dbe753-c8c6-4ecf-9070-83e45fede818 | 2025-07-17T07:01:03Z | https://prow.ci.openshift.org/view/gs/origin-ci-test/logs/periodic-ci-openshift-eng-XXXXXX-XXXXXXXXX-ci-main-aws-4.20-nightly-x86-payload-control-plane-6nodes/1945711780562997248 |       34.879  | True             |             29.1073 | -- changepoint
| 29 | 9c77713e-f649-482b-8889-025d2fb3337e | 2025-07-18T06:46:10Z | https://prow.ci.openshift.org/view/gs/origin-ci-test/logs/periodic-ci-openshift-eng-XXXXXX-XXXXXXXXX-ci-main-aws-4.20-nightly-x86-payload-control-plane-6nodes/1946068601798660096 |       30.2378 | False            |              0      |
+----+--------------------------------------+----------------------+------------------------------------------------------------------------------------------------------------------------------------------------------------------------------------+---------------+------------------+---------------------+
### Pod ready latency
+----+--------------------------------------+----------------------+------------------------------------------------------------------------------------------------------------------------------------------------------------------------------------+-----------------------+------------------+---------------------+
| ID |                UUID                  |       timestamp      |                                                                                          build_url                                                                                 |         value         |  is_changepoint  |        delta        |
+----+--------------------------------------+----------------------+------------------------------------------------------------------------------------------------------------------------------------------------------------------------------------+-----------------------+------------------+---------------------+
| 27 | 597be9c6-4d1b-4724-9b87-8ee4968bbbc0 | 2025-07-16T15:24:36Z | https://prow.ci.openshift.org/view/gs/origin-ci-test/logs/periodic-ci-openshift-eng-XXXXXX-XXXXXXXXX-ci-main-aws-4.20-nightly-x86-payload-control-plane-6nodes/1945472195727724544 |                  2000 | False            |                   0 |
| 28 | 35dbe753-c8c6-4ecf-9070-83e45fede818 | 2025-07-17T07:01:03Z | https://prow.ci.openshift.org/view/gs/origin-ci-test/logs/periodic-ci-openshift-eng-XXXXXX-XXXXXXXXX-ci-main-aws-4.20-nightly-x86-payload-control-plane-6nodes/1945711780562997248 |                  3000 | True             |                  50 | -- changepoint
| 29 | 9c77713e-f649-482b-8889-025d2fb3337e | 2025-07-18T06:46:10Z | https://prow.ci.openshift.org/view/gs/origin-ci-test/logs/periodic-ci-openshift-eng-XXXXXX-XXXXXXXXX-ci-main-aws-4.20-nightly-x86-payload-control-plane-6nodes/1946068601798660096 |                  3000 | False            |                   0 |
+----+--------------------------------------+----------------------+------------------------------------------------------------------------------------------------------------------------------------------------------------------------------------+-----------------------+------------------+---------------------+
Deep dive into profiling Kubelet
You can view code changes to capture pprof from one of our workloads on GitHub. The following outlines our findings.
We captured and analyzed pprof CPU profiles across versions:
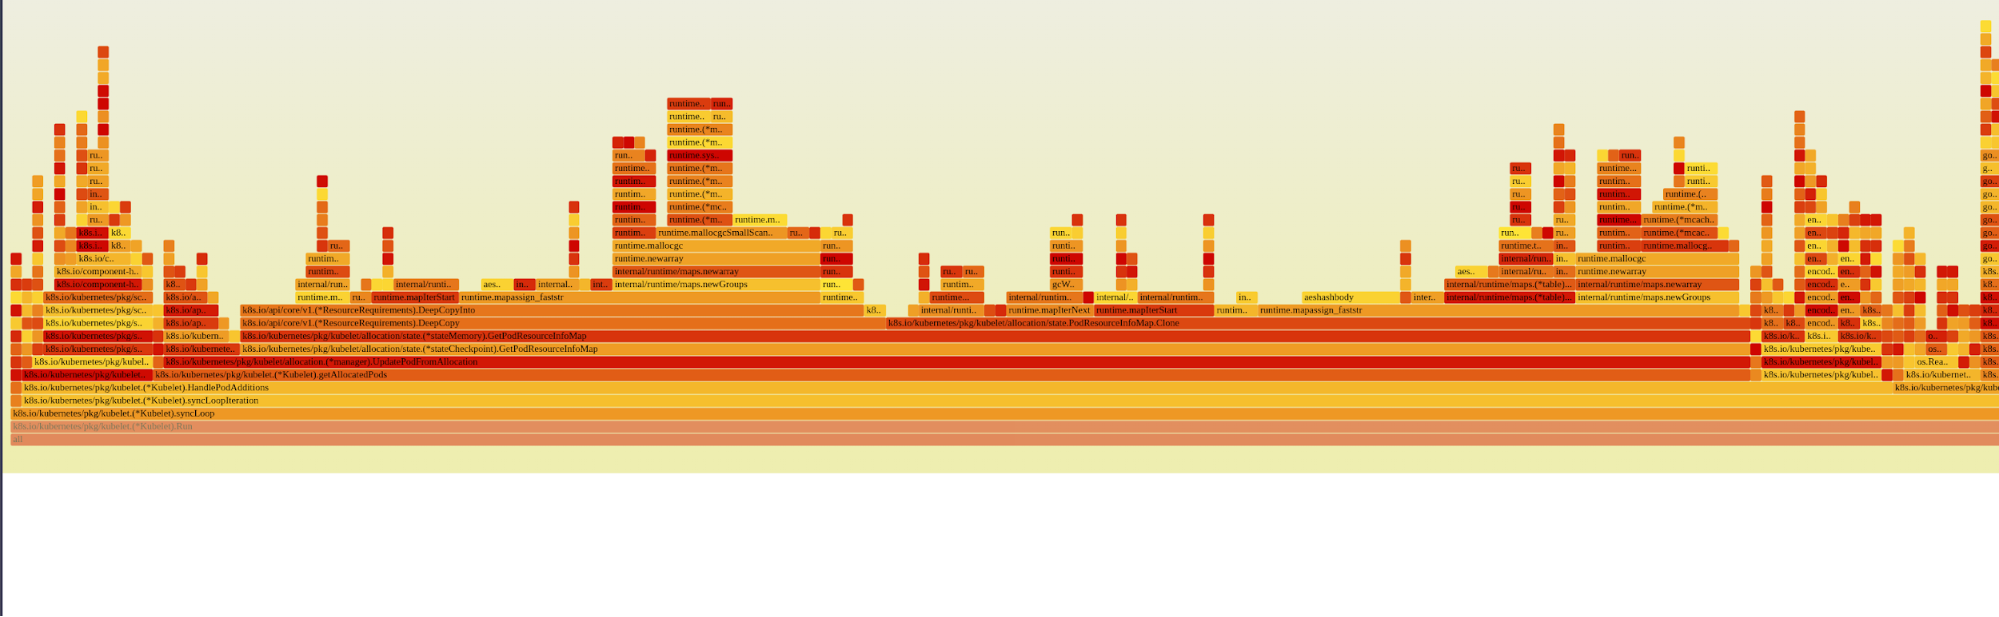
- Introduced a new function getAllocationPods() in kubelet 1.33.
- Profiling revealed it accounted for ~15% additional CPU time.
- Flamegraphs clearly highlighted this change compared to 1.32.
You can find the attached flamegraph extracted from kubelet 1.32 pprof in Figure 1.
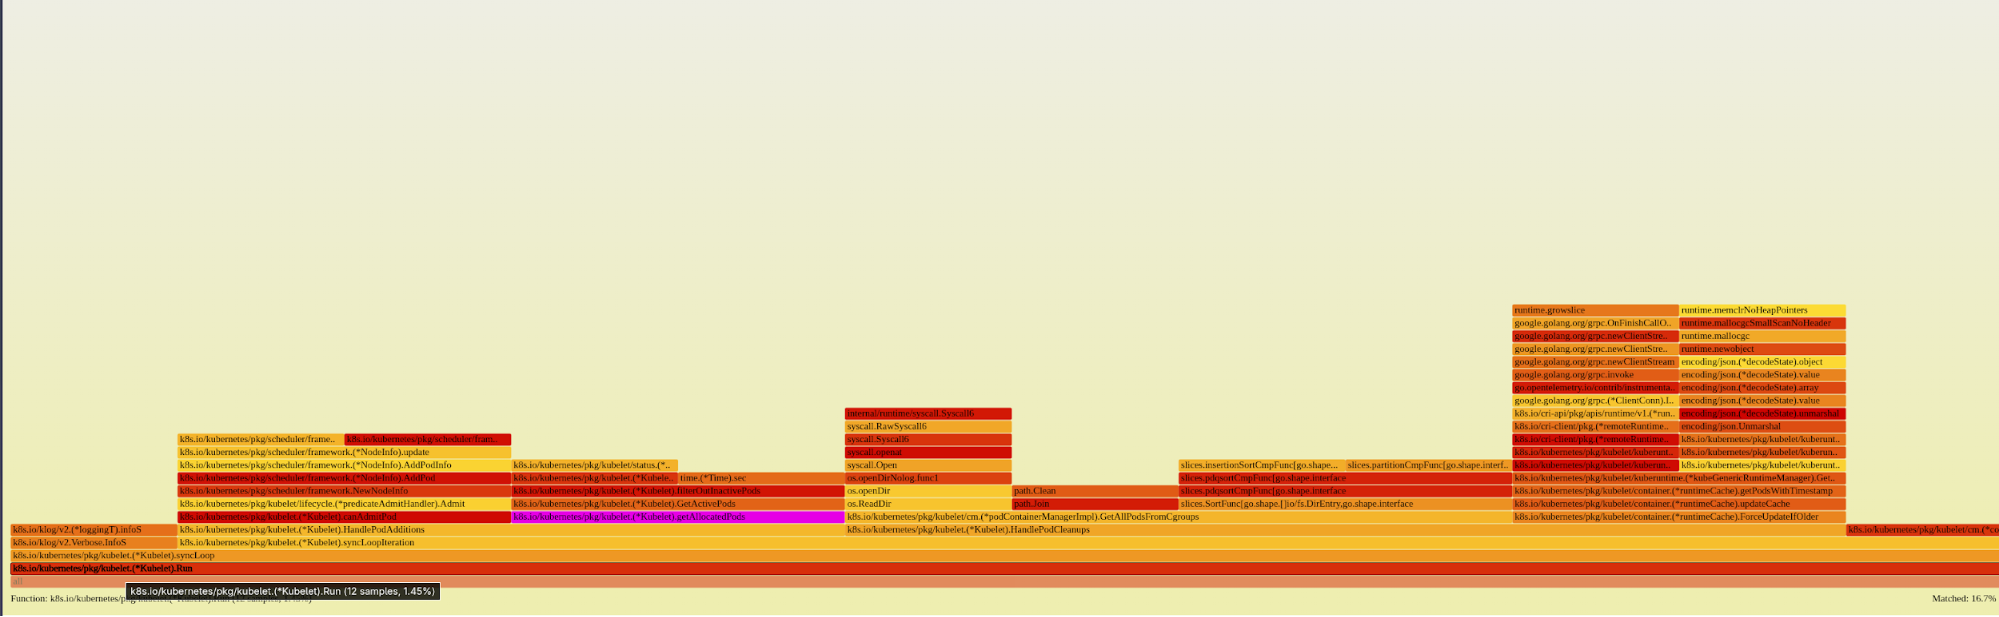
Figure 2 shows the attached flamegraph extracted from kubelet 1.33 pprof data.
Here is the drive link for original pprofs: kubelet 1.33 regression blog content. You can find the tool used for plotting these flamegraphs on GitHub.
### Extract the pprof files form gzips
$ go tool pprof -raw -output before_regression-kubelet.pprof before_kubelet_regression.gz
$ go tool pprof -raw -output after_regression-kubelet.pprof after_kubelet_regression.gz
### Plot the graphs using brendangregg’s FlameGraph tool
$ cat before_regression-kubelet.pprof | ~/code/FlameGraph/stackcollapse-go.pl | ~/code/FlameGraph/flamegraph.pl > before_regression-kubelet.svg
$ cat after_regression-kubelet.pprof | ~/code/FlameGraph/stackcollapse-go.pl | ~/code/FlameGraph/flamegraph.pl > after_regression-kubelet.svg
Note: Alternatively, there are many online pprof visualization tools that help visualizing flamegraphs by just uploading .pprof files.
You can zoom in to view the flamegraph highlighting the new observation in 1.33 here. After digging further into the flamegraphs and checking the upstream source code, we were able to pinpoint the code change responsible for this change here.
Resolution
Thanks to collaboration with the kubelet developers, we identified and merged a patch upstream reverting changes in PR #130796 as fixed.
Follow-up runs confirmed:
- CPU usage normalized to ~25%.
- Pod readiness latency stabilized at ~2000 ms.
- No changepoints detected across multiple nightly builds.
Lessons learned
We learned that continuous performance testing works. The changepoint detection helped us catch this early. We also learned that collaboration across teams is key, as the quick turnaround from node team developers prevented wider impact. Profiling tools are indispensable, such as flamegraphs (which made the regression root cause visible). The upstream feedback loop matters: findings reported upstream ensured wider community benefit.
This regression in kubelet 1.33, though short-lived, highlights the importance of rigorous scale and performance testing in OpenShift. By combining automated detection, targeted profiling, and close collaboration with upstream, we were able to identify, isolate, and fix the issue swiftly. OpenShift users on upcoming releases can be confident that the regression is resolved and performance is back to expected baselines.