Dumping packets from a network interface is a common debugging step. But the ability to dump them from anywhere in the networking stack is a concept that holds significant potential, as described in a previous article. However, excessive and uncontrolled dumping can quickly become overwhelming, in terms of the amount of data and the impact on the inspected system. For this reason, tools like tcpdump and tshark use capture filters, which helps reduce the overhead introduced by a capture session on a live system.
Retis is no exception. In this article, we will explore Retis filtering capabilities, highlighting the differences, similarities, and expectations compared to other existing tools.
Why filtering matters
Filtering is more than just a convenient way for users to narrow down data during capture or mitigate overhead in a production system. It is essential for obtaining correct and complete captures with no missing events.
One primary cause of loss is Retis needing to process too many events. Depending on the starting condition, processing may not be possible if the event count is too high, as shown here:
> sudo retis -p ifdump collect -c skb,dev,ns -o /dev/null
Applying profile ifdump
5 probe(s) loaded
^CReceived signal, terminating...
199152 event(s) processed
WARN  lost 108594 event(s) from net:net_dev_start_xmit
WARN  lost 406816 event(s) from net:netif_receive_skb
WARN  total events lost: 515410
As you can see, Retis does its best to report when events are lost. When lost warnings appear, it likely requires a narrower filter to capture the desired data.
Retis offers two distinct methods for filtering data:
- Packet filtering: Similar to tcpdump capture filters, this method operates by directly inspecting the packet headers.
- Meta-data filtering: Based on the sk_buff fields, a core Linux kernel data structure that represents a network packet. It contains, in addition to the packet data, extensive metadata about it, such as the associated network device, VLAN, checksum information, etc.
Packet filtering
Tools like tcpdump and tshark use capture filters that adhere to the PCAP-FILTER(7) syntax. These tools normally translate a capture filter into a filter program, which is a sequence of the popular legacy bpf instructions, usually called cBPF.
The cBPF pseudo architecture consists of a program counter, an accumulator A, an index register X, a scratch memory area M[], and the instructions in the following fixed-length format (from linux/filter.h):
struct sock_filter {    /* Filter block */
       __u16   code;   /* Actual filter code */
       __u8    jt;     /* Jump true */
       __u8    jf;     /* Jump false */
       __u32   k;      /* Generic multiuse field */
};
The filter machine section of the BPF(4) in FreeBSD man pages thoroughly explains the instructions and what they can do. The following output shows the cBPF instructions translated from a pcap-filter, generated using tcpdump -y EN10MB -d "ip && tcp dst port 80" (comments added for clarity).
(000) ldh [12]                ; A <- P[EtherType:2]
                              ;   Load half word at offset EtherType in reg A
(001) jeq #0x800 jt 2 jf 10   ; pc += (A == EtherType.IPv4) ? 0 : 9
                              ;   if EtherType is IPv4 goto the next
                              ;   instruction, otherwise return with no match.
(002) ldb [23]                ; A <- P[Protocol:1]
                              ;   Load 1 byte at offset ipv4.proto
(003) jeq #0x6 jt 4 jf 10     ; pc += (A == TCP) ? 0 : 8
                              ;   if EtherType is IPv4 proceed,
                              ;   otherwise return signaling no match
(004) ldh [20]                ; A <- P[Flags:2]
                              ;   Load ip.flags + ip.frag_off in reg A
(005) jset #0x1fff jt 10 jf 6 ; pc += (A & 0x1fff) ? 4 : 0
                              ;   if later fragment, return false, else proceed
(006) ldxb 4*([14]&0xf)       ; X <- 4*(P[14:1]&0xf) ;
                              ;   Load one byte from the beginning of the ip header,
                              ;   keep the lower nibble containing the ip.ihl and multiply
                              ;   the result by 4 (IHL is expressed in multiple of 4 bytes)
(007) ldh [x + 16]            ; A <- P[X+16:2]
                              ;   Load 2 bytes from
                              ;   mac.len (14) + ip.len (X) + 2 (offset of dst port
                              ;   in TCP header) in A
(008) jeq #0x50 jt 9 jf 10    ; pc += (A == 80) ? 0 : 1
                              ;   if dst port is 80, return match, else no match
(009) ret #262144             ; return match
(010) ret #0                  ; return no match
Normally, applications such as tcpdump request to attach the cBPF filters to a socket. During this process, the classic BPF (cBPF) instructions are translated into extended BPF (eBPF) instructions. Upon successful conversion, the kernel attaches the filter to the socket that will later run to determine which packets subsequently deliver to the socket.
Retis has adopted many of the aforementioned packet filtering concepts. It uses libpcap to convert PCAP filters into cBPF instructions, implementing its converter of cBPF instructions into eBPF. Then the resulting eBPF binaries are inlined into the target programs that in turn are eventually attached to various probe points throughout the networking stack. This approach is very flexible because it enables filtering at any point in the stack, a capability typically restricted to fixed points in the receive and transmit paths in other tools.
The ability of Retis to attach its programs to any skb-aware function or tracepoint in the kernel is one of the things that makes Retis slightly different from other tools. This level of flexibility, however, introduces unique considerations. The specific events collected will vary significantly based on the probe points chosen, largely dictated by the packet path. While some scenarios may be straightforward, others will diverge from the behavior observed with conventional packet sniffers.
There are cases where the results match what we're used to seeing with tools like tcpdump, as in the following example:
> sudo retis -p ifdump collect -c skb,dev,ns -f "icmp and host 192.168.1.1"
[...]
31676532023225 (14) [ping] 60234 [tp] net:net_dev_start_xmit
 192.168.1.10 > 192.168.1.1 tos 0x0 ttl 64 id 52363 off 0 [DF] len 84 proto ICMP (1) type 8 code 0
 ns 0x1/4026531840 if 2 (eno1)
31676532568924 (9) [swapper/9] 0 [tp] net:netif_receive_skb
 192.168.1.1 > 192.168.1.10 tos 0x0 ttl 64 id 61547 off 0 len 84 proto ICMP (1) type 0 code 0
 ns 0x1/4026531840 if 2 (eno1)
[...]
In the next section, we will see how minor modifications can lead to different outcomes.
Metadata filtering
In the previous section, we demonstrated how using the Retis profile ifdump (-p net:netif_receive_skb and -p net:dev_hard_start_xmit) can yield captures similar to tcpdump. One could argue that, under the right conditions, the ifdump profile closely resembles tcpdump when capturing from all interfaces and in both directions (-i any).
This holds true for the simple case shown in the last example, where locally generated packets traverse a physical interface. However, the situation changes in different scenarios. For instance, let's consider a slightly different setup involving two additional namespaces and bridged veths, as illustrated in Figure 1.
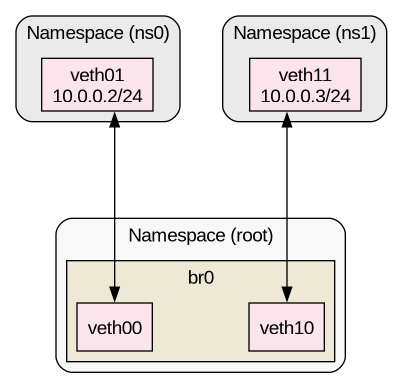
As soon as we start capturing packets traversing multiple network namespaces, we begin to see the first key difference. Retis probes kernel functions directly, and this implies we can find ourselves outside the namespace abstraction; meaning a simple capture can generate events from all of them, as follows:
> sudo retis -p ifdump collect -c skb,dev,ns -f 'icmp and net 10.0.0.0/24'
[...]
59411690053173 (22) [ping] 106735 [tp] net:net_dev_start_xmit
 10.0.0.2 > 10.0.0.3 tos 0x0 ttl 64 id 42483 off 0 [DF] len 84 proto ICMP (1) type 8 code 0
 ns 0x19007/4026535345 if 197 (veth01)
59411690066848 (22) [ping] 106735 [tp] net:netif_receive_skb
 10.0.0.2 > 10.0.0.3 tos 0x0 ttl 64 id 42483 off 0 [DF] len 84 proto ICMP (1) type 8 code 0
 ns 0x1/4026531840 if 198 (veth00)
59411690073882 (22) [ping] 106735 [tp] net:net_dev_start_xmit
 10.0.0.2 > 10.0.0.3 tos 0x0 ttl 64 id 42483 off 0 [DF] len 84 proto ICMP (1) type 8 code 0
 ns 0x1/4026531840 if 200 (veth10) rxif 198
59411690076176 (22) [ping] 106735 [tp] net:netif_receive_skb
 10.0.0.2 > 10.0.0.3 tos 0x0 ttl 64 id 42483 off 0 [DF] len 84 proto ICMP (1) type 8 code 0
 ns 0xc005/4026535413 if 199 (veth11)
59411690090402 (22) [ping] 106735 [tp] net:net_dev_start_xmit
 10.0.0.3 > 10.0.0.2 tos 0x0 ttl 64 id 15229 off 0 len 84 proto ICMP (1) type 0 code 0
 ns 0xc005/4026535413 if 199 (veth11)
59411690095742 (22) [ping] 106735 [tp] net:netif_receive_skb
 10.0.0.3 > 10.0.0.2 tos 0x0 ttl 64 id 15229 off 0 len 84 proto ICMP (1) type 0 code 0
 ns 0x1/4026531840 if 200 (veth10)
59411690098067 (22) [ping] 106735 [tp] net:net_dev_start_xmit
 10.0.0.3 > 10.0.0.2 tos 0x0 ttl 64 id 15229 off 0 len 84 proto ICMP (1) type 0 code 0
 ns 0x1/4026531840 if 198 (veth00) rxif 200
59411690099970 (22) [ping] 106735 [tp] net:netif_receive_skb
 10.0.0.3 > 10.0.0.2 tos 0x0 ttl 64 id 15229 off 0 len 84 proto ICMP (1) type 0 code 0
 ns 0x19007/4026535345 if 197 (veth01)
[...]
In contrast, if we attempt to perform the same action with tcpdump from the root namespace, we observe only packets traversing its interfaces.
> sudo tcpdump -vvi any "icmp and net 10.0.0.0/24"
00:23:38.774201 veth00 P   IP (tos 0x0, ttl 64, id 13908, offset 0, flags [DF], proto ICMP (1), length 84)
   10.0.0.2 > 10.0.0.3: ICMP echo request, id 41706, seq 3, length 64
00:23:38.774214 veth10 Out IP (tos 0x0, ttl 64, id 13908, offset 0, flags [DF], proto ICMP (1), length 84)
   10.0.0.2 > 10.0.0.3: ICMP echo request, id 41706, seq 3, length 64
00:23:38.774229 veth10 P   IP (tos 0x0, ttl 64, id 34754, offset 0, flags [none], proto ICMP (1), length 84)
   10.0.0.3 > 10.0.0.2: ICMP echo reply, id 41706, seq 3, length 64
00:23:38.774237 veth00 Out IP (tos 0x0, ttl 64, id 34754, offset 0, flags [none], proto ICMP (1), length 84)
   10.0.0.3 > 10.0.0.2: ICMP echo reply, id 41706, seq 3, length 64
It’s easy to see that Retis produces a greater number of events in this scenario. To further narrow down the collected events based on criteria that go beyond the packet header (i.e., a network namespace), packet filtering alone is no longer enough. Therefore, we must rely on meta-data filtering.
Meta-filtering is an additional way Retis offers to filter packets before tracking. It is essentially based on BTF, and allows the user to match against sk_buffs and inner data structures fields (e.g., skb->dev->name, skb->mark, etc.) and support the vast majority of field types. Lastly, like packet filtering, the resulting filter is in the form of eBPF bytecode and can combine with packet filtering.
Meta-filtering supports multiple types, allows multiple relational operators, boolean expressions, and precedence override. It also covers fairly advanced uses, including bit masking, casting, and bitfield matching. For further details about basic and advanced meta-filtering capabilities, check out the documentation.
All of this comes with one limitation. Access to any field is safe but unprotected, meaning any external access to specific fields (e.g., protected by a spinlock) is not synchronized. This is normally not an issue for a Retis use case, but it's always good to keep it in mind while debugging.
Returning to our previous example, to limit the captured events to packets traversing the root netns, we may consider filtering on its netns inum and cookie, using the following meta-filtering expression:
sk_buff.dev.nd_net.net.ns.inum == 4026531840 and sk_buff.dev.nd_net.net.net_cookie == 0x1.
We also enable the skb-tracking collector to provide enhanced visibility of the tracking information. Once the capture begins, the first two events show that the ICMP echo request is received on veth00 in the root network namespace, and the same packet is then transmitted from veth10 to its peer:
> sudo retis -p ifdump collect -c skb,dev,ns,skb-tracking -f "icmp and net 10.0.0.0/24" \
    -m "sk_buff.dev.nd_net.net.ns.inum == 4026531840 and sk_buff.dev.nd_net.net.net_cookie == 0x1"
[...]
59603498163280 (22) [ping] 107888 [tp] net:netif_receive_skb #bb86bbe8aeffff8f03defdc200 (skb ffff8f0f97684000)
 10.0.0.2 > 10.0.0.3 tos 0x0 ttl 64 id 22544 off 0 [DF] len 84 proto ICMP (1)
   type 8 code 0
 ns 0x1/4026531840 if 208 (veth00)
59603498172337 (22) [ping] 107888 [tp] net:net_dev_start_xmit #bb86bbe8aeffff8f03defdc200 (skb ffff8f0f97684000)
 10.0.0.2 > 10.0.0.3 tos 0x0 ttl 64 id 22544 off 0 [DF] len 84 proto ICMP (1)
   type 8 code 0
 ns 0x1/4026531840 if 210 (veth10) rxif 208
The next entry shows the peer receiving the packet, an event not belonging to the root netns (with 0xd014/4026535413 identifying ns1). But a closer look at the tracking information (right after the tracepoint identifier) reveals that's exactly what we expect:
59603498175102 (22) [ping] 107888 [tp] net:netif_receive_skb #bb86bbe8aeffff8f03defdc200 (skb ffff8f0f97684000)
 10.0.0.2 > 10.0.0.3 tos 0x0 ttl 64 id 22544 off 0 [DF] len 84 proto ICMP (1)
   type 8 code 0
 ns 0xd014/4026535413 if 209 (veth11)
This is because filtering is not a standalone component; it's tied to Retis's built-in tracking feature. This ensures we can follow a packet's entire journey through the network stack, even if it moves into a different network namespace that no longer matches the original filter. We'll discuss more about this in the next section.
For completeness, the capture shows a similar event sequence for the ICMP echo reply:
59603498193457 (22) [ping] 107888 [tp] net:netif_receive_skb #bb86bc9074ffff8f03defd9080 (skb ffff8f03e1d92e00)
 10.0.0.3 > 10.0.0.2 tos 0x0 ttl 64 id 59703 off 0 len 84 proto ICMP (1)
   type 0 code 0
 ns 0x1/4026531840 if 210 (veth10)
59603498195791 (22) [ping] 107888 [tp] net:net_dev_start_xmit #bb86bc9074ffff8f03defd9080 (skb ffff8f03e1d92e00)
 10.0.0.3 > 10.0.0.2 tos 0x0 ttl 64 id 59703 off 0 len 84 proto ICMP (1)
   type 0 code 0
 ns 0x1/4026531840 if 208 (veth00) rxif 210
59603498197384 (22) [ping] 107888 [tp] net:netif_receive_skb #bb86bc9074ffff8f03defd9080 (skb ffff8f03e1d92e00)
 10.0.0.3 > 10.0.0.2 tos 0x0 ttl 64 id 59703 off 0 len 84 proto ICMP (1)
   type 0 code 0
 ns 0x5006/4026535345 if 207 (veth01)
As we've seen, Retis filters work alongside packet tracking. This ensures, once the filters emits a match verdict, that a packet can be followed even after it is encapsulated, manipulated, or in general its data and metadata no longer match the initial criteria specified in the filtering expressions.
Combining filtering and tracking
We've previously introduced the interaction between filtering and tracking, but without clearly defining what to expect from it. Let's consider our last example, which also filtered by namespace:
> retis collect -p ifdump collect -c skb,dev,ns,skb-tracking -f "icmp and net 10.0.0.0/24" \
   -m 'sk_buff.dev.nd_net.net.ns.inum == 4026531840 and \
   sk_buff.dev.nd_net.net.net_cookie == 0x1'
When the ICMP echo request is sent from ns0, the packet goes through veth01, and Retis processes the echo request as follows:
>> net:net_dev_start_xmit {ns0, veth01}
   <tracking check (miss)>
   <packet filter (no match)>
   <meta filter (no match)>
   <event not sent>
  >> net:netif_receive_skb {rootns, veth00}
     <tracking check (miss)>
     <packet filter (match)>
     <meta filter (match)>
     <packet starts getting tracked>
     <event sent>
    >> net:net_dev_start_xmit {rootns, veth10}
       <tracking check (hit)>
       <event sent>
      >> net:netif_receive_skb {ns1, veth11}
         <tracking check (hit)>
         <event sent>
As this sequence illustrates, filtering occurs for untracked packets. If all the specified filters match, packet tracking starts operating. From this point, Retis generates the new events for the tracked packet, ideally throughout the skb's lifetime across all probes.
Learn more
In this article, we demonstrated how Retis adopts familiar concepts already used by other popular tools. We introduced more concepts behind filtering and the interaction with packet tracking, while clarifying how they work and what to expect. We learned that, when an untracked packet hits the first probe point, it's subjected to packet and metadata filtering. If a packet matches all the applied filters, packet tracking activates, ensuring that monitoring continues throughout the packet journey in the networking stack, regardless of subsequent changes.
As Retis evolves, future iterations may further enhance filtering and tracking granularity, providing users with increased control and power to simplify network troubleshooting. Visit the Retis open source project to review its code.