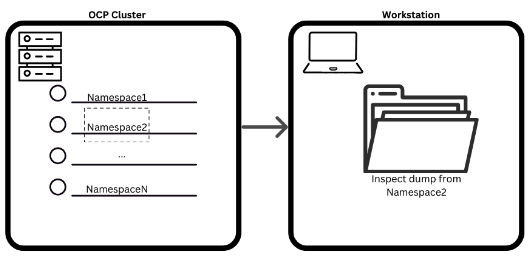
Given a problem with an application in Red Hat OpenShift Container Platform (RHOCP 4) upon opening a case with the support team, our support team might ask for a namespace’s inspect file. The inspect file is a very useful tool for troubleshooting applications and systems deployed in RHOCP 4 and can be extremely useful in a series of situations.
It also avoids the unnecessarily separated collection of data (Pod Logs, route YAML, BuildConfig YAMLs) given it brings everything that is namespace bounded—except custom resources—directly to one goal.
This article covers what the inspect file is, how to collect it, how to use it for troubleshooting, and how it compares to the must-gather file (spoiler: it is not the same thing). This will help clarify why we usually ask for this file during the troubleshooting procedures in middleware products, such as Red Hat JBoss Enterprise Application Platform (JBoss EAP), Red Hat Data Grid, Red Hat JBoss Web Server, and Spring Boot applications (which Red Hat supports for the Spring Boot 3+ community).
inspect
The inspect is a collection of a namespace’s specific files, also known as the project dump, that collects a set of most common namespace-bounded files: DC, pod YAMLs, routes, services, and so much more.
It can be used to discover problems such as:
- On the deployment of a specific pod
- A specific pod issue
- An issue that happens only on that namespace
- An image pull issue happening currently (given a problem with the
BuildConfig) - A
BuildConfigissue or misconfiguration
How to collect the inspect file
The collection of the inspect is pretty straightforward, but requires admin rights on the cluster (which require adm permissions):
$ oc adm inspect namespace namespace_nameContent
The inspect file will contain several namespace-bounded resources, including YAML and pod YAMLs/log. See the complete output of its content below:
├── inspect-logs
│   └── inspect.local.onelocal
│      ├── event-filter.html
│      ├── namespaces
│      │   └── datagrid <------------------------------------ datagrid namespace
│      │       ├── apps
│      │       │   ├── daemonsets.yaml
│      │       │   ├── deployments.yaml
│      │       │   ├── replicasets.yaml
│      │       │   └── statefulsets.yaml
│      │       ├── apps.openshift.io
│      │       │   └── deploymentconfigs.yaml
│      │       ├── autoscaling
│      │       │   └── horizontalpodautoscalers.yaml
│      │       ├── batch
│      │       │   ├── cronjobs.yaml
│      │       │   └── jobs.yaml
│      │       ├── build.openshift.io
│      │       │   ├── buildconfigs.yaml <------------------ buildconfig
│      │       │   └── builds.yaml <------------------------ build
│      │       ├── core
│      │       │   ├── configmaps.yaml <--------------------- config maps
│      │       │   ├── endpoints.yaml
│      │       │   ├── events.yaml <------------------------- events
│      │       │   ├── persistentvolumeclaims.yaml
│      │       │   ├── pods.yaml <--------------------------- pod yamls
│      │       │   ├── replicationcontrollers.yaml
│      │       │   ├── secrets.yaml       <---------------------- secrets
│      │       │   └── services.yaml      <--------------------- services
│      │       ├── image.openshift.io
│      │       │   └── imagestreams.yaml
│      │       ├── pods
│      │       │   ├── infinispan-operator-controller-manager        <------------operator logs
│      │       │   │   ├── infinispan-operator-controller-manager.yaml
│      │       │   │   └── manager
│      │       │   │       └── manager
│      │       │   │           └── logs
│      │       │   │               ├── current.log
│      │       │   │               └── previous.log
│      │       │   ├── prometheus-prometheus <------------------------- prometheus
│      │       │   │   ├── config-reloader
│      │       │   │   │   └── config-reloader
│      │       │   │   │       └── logs
│      │       │   │   │           ├── current.log
│      │       │   │   │           ├── previous.insecure.log
│      │       │   │   │           └── previous.log
│      │       │   │   ├── prometheus
│      │       │   │   │   └── prometheus
│      │       │   │   │       └── logs
│      │       │   │   │           ├── current.log
│      │       │   │   │           └── previous.log
│      │       │   │   └── prometheus-prometheus.yaml
│      │       │   └── datagrid-pod
│      │       │       ├── infinispan
│      │       │       │   └── infinispan
│      │       │       │       └── logs
│      │       │       │           ├── current.log <------------------------- pod logs
│      │       │       │           ├── previous.insecure.log
│      │       │       │           └── previous.log
│      │       │       └── datagrid-cluster.yaml
│      │       ├── policy
│      │       │   └── poddisruptionbudgets.yaml
│      │       ├── datagrid.yaml
│      │       └── route.openshift.io
│      │           └── routes.yaml                  <------------------------- routes yaml
│      └── timestamp
In the inspect directory, it is common to look for more relevant data/configuration available there. Here are some of the directories and file locations more frequently searched into a generated inspect:
Deployment pod logs: Go to the deployment directory name. In this case, the deployment name is
rhdg-cluster:├── inspect-logs │ └── inspect.local.onelocal │ ├── event-filter.html │ ├── namespaces │ │ └── datagrid … │ │ │ └── datagrid │ │ │ ├── infinispan │ │ │ │ └── infinispan │ │ │ │ └── logs │ │ │ │ ├── current.log │ │ │ │ ├── previous.insecure.log │ │ │ │ └── previous.log │ │ │ └── datagrid.yamlDeployment and
StatefulSetsconfiguration: Depending on the deployment process and requirements, a deployment could contain both a deployment and aStatefulSet. Both are located in the same directory:├── inspect-logs │ └── inspect.local.onelocal │ ├── event-filter.html │ ├── namespaces │ │ └── rhdg … │ │ ├── apps │ │ │ ├── daemonsets.yaml │ │ │ ├── deployments.yaml │ │ │ ├── replicasets.yaml │ │ │ └── statefulsets.yamlDeployment core details: Each deployment could contain a set of
ConfigMaps, services, secrets, and so on, that are part of the fine-grained details of the deployment definition. Those configurations are available in thecoredirectory:├── inspect-logs │ └── inspect.local.onelocal │ ├── event-filter.html │ ├── namespaces │ │ └── datagrid … │ │ ├── core │ │ │ ├── configmaps.yaml │ │ │ ├── endpoints.yaml │ │ │ ├── events.yaml │ │ │ ├── persistentvolumeclaims.yaml │ │ │ ├── pods.yaml │ │ │ ├── replicationcontrollers.yaml │ │ │ ├── secrets.yaml │ │ │ └── services.yamlRoutes: The created routes have their own file in a separate directory. Route details are in the
route.openshift.iodirectory:├── inspect-logs │ └── inspect.local.onelocal │ ├── event-filter.html │ ├── namespaces │ │ └── rhdg … │ │ └── route.openshift.io │ │ └── routes.yaml
Tools for debugging
For reviewing those files inside the inspect, there is no need to manually read each one of them or even grep the data because there are tools that do that: you can use OMG and OMC tools to parse both the inspect and the must-gather.
To set for usage:
$ omg use inspect.local.file
.Using:  /home/path/inspect.local.file
To get the pods:
$ omg get pod -n a-namespace-prod
NAME                             READY  STATUS   RESTARTS  AGE
apod-id    1/1    Running  0         4h2m
apod2-id     1/1    Running  0         4h2m
BuildConfig
The inspect becomes a powerful tool to debug and troubleshoot BuildConfig, because each build step will be on the inspect, including the image streams:
BuildConfig- Build
- Pod build logs
ImageStreams- Deployment pods
- Application pods
For investigations on build, get the BuildConfig YAML and verify the specific details on the build, like a Dockerfile. From the build YAML and the build Pod logs, one can see each step of the build to determine any specific step with issues.
Example troubleshooting
The inspect file can be used for numerous issues and provide hints even for RHOCP cluster ones. Below are two examples—a service spec issue and a build configuration issue.
JBoss EAP pods do not cluster , or Service does not have the PublishNotReady spec
Problem: When deploying JBoss EAP 7 and Red Hat Data Grid, the pods must form a proper cluster. To form the cluster those products use JGroups library, which is a Java library for one-to-one and one-to-many communication that forms the clusters.
Cause: In OpenShift Container Platform 4, a service is used to establish the connection between pods; in this case, JGroups will rely on a ping-service that binds the pods together. However, they must be ready immediately after creation—this is a requirement by JGroups, which is done via the spec.publishNotReadyAddresses property. This is a requirement from JGroups itself.
In summary, this service setting will allow the DNS resolution of that pod even when the pods are not ready (as in green-lighted by the readiness probe).
Steps to troubleshoot and fix:
- Collect the
inspect. - When verifying the services YAMLs, it is possible to verify the service YAMLs, then correlate which one is associated with the JBoss EAP pods specifically, and then verify if that service has the correct
spec.publishNotReadyAddresses. - To fix the problem, fix the service's spec section accordingly.
BuildConfig brings different behaviors in two different images, even with the same tag
Building images in RHOCP 4 can be very practical. However, if a problem arises, the inspect file can be a useful tool for discovery.
Problem: When the built image using OpenJDK 17 image, the newest tag (as in the latest images in the registry) had a different behavior than older image tags.
Cause: This was a change on the OpenJDK 17 images specifically rooted in the behavior change on JAVA_OPTS vs JAVA_OPTS_APPEND environment variables in the image, and this was an expected behavior. More information here.
Steps to troubleshoot and fix: Through the collection of the inspect file, and then comparing the images deployed (ImageStream) and the BuildConfig and the build logs, we see that the tag difference (and digest image ID) on the OpenJDK image made the new image behave differently.
Complementary to that, see the following solutions:
- For generic customization parameters for Maven, see Using Maven parameters on BuildConfig in RHOCP 4.
- For troubleshooting steps for JBoss EAP 7's BuildConfig, see Troubleshooting EAP 7 local BuildConfig in RHOCP 4.
- For customizing template
BuildConfig, see Customizing EAP 7 Template BuildConfig deployment in RHOCP 4.
Spring Boot application deployment is unresponsive or slow
Spring Boot is the Tomcat Catalina engine, so it is a Java application.
Problem: When deployed in RHOCP 4 via deployment.yaml, for example, its container's CPU settings must be adequately set to avoid slowness or kernel starvation.
Cause: Spring Boot will bring by default the threads set at 200 threads instead of a value deduced/calculated from the CPU settings.
Steps to troubleshoot and fix: Collecting the inspect file from the pod YAML, we review the CPU containers settings and verify if that's enough. Although the inspect will only state how much it set (not the required for a certain specific application), in some cases—and with enough know-how on the matter/application—it is possible to deduce if the amount is enough to be set.
Inspect versus must-gather (mg)
Comparing the inspect bundle versus the must-gather ($ oc adm must-gather), the namespace’s inspect is not the same as the must-gather; it will contain only specific namespace details and not cluster details. must-gather is a much more complex collection of files, from several namespaces including—and mostly focused—on Openshift cluster system namespaces.
In summary, every must-gather collects inspect + cluster data, must-gather is a collection of specified scripts that collect data from the cluster, which includes output from multiple inspect associated with those namespaces.
The inspect specifically only collects namespace data (or data related to the collected objects).
In this matter, the namespace's inspect file will only namespace information, whereas the must-gather has a collective of information from the cluster.
must-gather:
- Types of problems: Cluster-wide.
- How many namespaces? Several, including system ones.
- Does it have CRs? From some resources, yes.
- The
$ oc adm must-gathercommand is translated foroc run collect-pod --image=mustgatherimage -- sh gather, which creates a simple/single pod that will collect the data and at the end, it will runoc cp <pod>:/mustgather/dir ./For specific details see openshift/must-gather/collection-scripts/gather.
inspect:
- Types of problems: Namespace bounded.
- How many namespaces? One—the one the user selects.
- Does it have CRs? No, only default RHOCP and Kubernetes files.
Conclusion
In this article, we discussed the inspect file—how to get it, what's inside of it, and how to use it for troubleshooting, with two real-life examples. Finally, we compared the inspect bundle with the must-gather, which is another handy tool for cluster-wide issues in Red Hat OpenShift Container Platform 4.
Additional resources
Now you know this tool and how it can be useful for support cases, as detailed in the solution Using inspect for DG 8 troubleshooting.
For any other specific inquiries, please open a case with Red Hat support. Our global team of experts can help you with any issues.