Open vSwitch (OvS), an open source tool for creating virtual Layer 2 networks, relies in some use cases on connection tracking. The recent 3.0.0 release of OvS included this patch series to improve multithread scalability, which makes connection tracking more efficient when OvS is run on multiple CPUs. This article shows how to measure the performance of connection tracking with OvS.
What is connection tracking and why is it critical?
Connection tracking, or conntrack, maintains an internal table of logical network connections (also called flows). The table identifies all packets that make up each flow so that they can be handled consistently.
Conntrack is a requirement for network address translation (NAT)—in IP address masquerading, for example (described in detail in RFC 3022). Conntrack is also required for stateful firewalls, load balancers, intrusion detection and prevention systems, and deep packet inspection. More specifically, OvS conntrack rules are used to isolate different OpenStack virtual networks (aka security groups).
Connection tracking is usually implemented by storing known connection entries in a table, indexed by a bidirectional 5-tuple consisting of a protocol, source address, destination address, source port, and destination port. Each entry also has a state as seen from the connection tracking system. The state (new, established, closed, etc.) is updated every time a packet matching its 5-tuple is processed. If a received packet does not match any existing conntrack entry, a new one is created and inserted into the table.
Performance aspects
There are two aspects to consider when measuring conntrack performance.
- How many new connections can be handled per second? This question depends on the following details:
- What is the cost of looking up an existing connection entry for each received packet?
- Can multiple threads insert and destroy conntrack entries concurrently?
- What is the cost of creating a conntrack entry for a new connection?
- How many packets are exchanged per connection?
- How many concurrent connections can the system support? This question depends on the following details:
- What is the size of the conntrack table?
- What is the duration of each individual connection?
- After a connection has been closed, how long does the conntrack entry linger in the table until it is expunged to make room for new connections? What if the connection is not closed but no longer exchanges traffic (because the client or server crashed or disconnected)?
- What happens when the conntrack table is full?
These two aspects of performance are somewhat connected, because even a low rate of very long new connections causes the conntrack table to fill up eventually.
In order to properly size the connection tracking table, one needs to know the average number of new connections per second and their average duration. Testing also requires tuning the timeout values of the conntrack engine.
Benchmarking process
To take the measurements necessary to answer the questions in the previous section, you need a way to simulate clients and servers. Such a system must specify how many clients and servers to test, how many connections per second they are creating, how long the connections are, and how much data is exchanged in each connection.
A few commercial traffic generators have these capabilities, more or less refined. This article describes how to carry out the simulation with TRex—an open source traffic generator based on the Data Plane Development Kit (DPDK).
TRex has multiple modes of operation. This article uses the advanced stateful (ASTF) mode, which allows TRex to simulate TCP and UDP endpoints. I have tailored a script using the TRex Python API to perform benchmarks in a manner like RFC 2544, but focusing on how many new connections can be created per second.
Basically, this script connects to a running TRex server started in ASTF mode and creates TCP and UDP connection profiles. These profiles are state machines representing clients and servers with dynamic IP addresses and ports. You can define the number of data exchanges and their sizes, add some arbitrary wait time to simulate network latency, etc. TRex takes care of translating your specifications into real traffic.
Here is a stripped down example, in Python, of a TCP connection profile:
client = ASTFProgram(stream=True)
server = ASTFProgram(stream=True)
for _ in range(num_messages):
    client.send(message_size * b"x")
    server.recv(message_size)
    if server_wait > 0:
        server.delay(server_wait * 1000)  # trex wants microseconds
    server.send(message_size * b"y")
    client.recv(message_size)

tcp_profile = ASTFTemplate(
    client_template=ASTFTCPClientTemplate(
        program=client,
        port=8080,
        cps=99, # base value which is changed during the binary search
        cont=True,
    ),
    server_template=ASTFTCPServerTemplate(
        program=server, assoc=ASTFAssociationRule(port=8080)
    ),
)
Setup
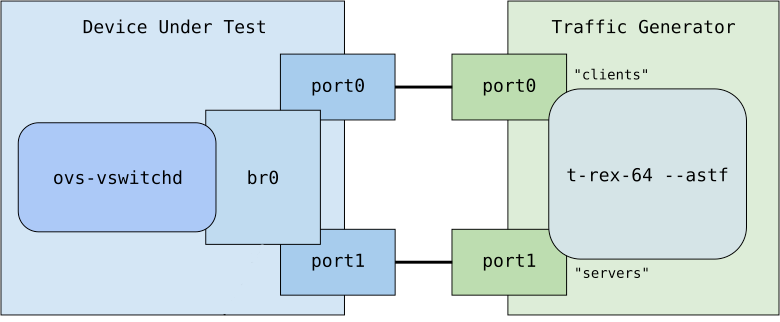
The device under test (DUT) runs the ovs-vswitchd Open vSwitch daemon with the user-space DPDK datapath. The setup can be used to benchmark any connection-tracking device. This procedure is overly simple and does not represent an actual production workload. However, it allows you to stress the connection tracking code path without bothering about the external details.
Figure 1 illustrates the relationship between the DUT and the traffic generator, which the test creates. Traffic simulating the clients travels from port0 to port1 on traffic generator through the DUT. Server traffic travels from port1 to port0 on the traffic generator. Conntrack flows are programmed on br0 to only allow new connections to be established from port0 to port1 (from "clients" to "servers") and also allow the reply packets on established connections from port1 to port0 (from "servers" to "clients") to go through.
Base system
Both the OvS user-space datapath and TRex use DPDK. The settings shown in this section are common to both machines.
DPDK requires compatible network interfaces. The example in this article runs on the last two ports of an Intel X710 PCI network interface. The following commands show the hardware in use:
[root@* ~]# lscpu | grep -e "^Model name:" -e "^NUMA" -e MHz
NUMA node(s):        1
Model name:          Intel(R) Xeon(R) Gold 5118 CPU @ 2.30GHz
CPU MHz:             2700.087
NUMA node0 CPU(s):   0-23
[root@* ~]# grep ^MemTotal /proc/meminfo
MemTotal:       65373528 kB
[root@* ~]# lspci | grep X710 | tail -n2
18:00.2 Ethernet controller: Intel Corporation Ethernet Controller X710 for 10GbE SFP+ (rev 02)
18:00.3 Ethernet controller: Intel Corporation Ethernet Controller X710 for 10GbE SFP+ (rev 02)
Note: To make things simpler, all commands in this article are executed as the root user.
The CPUs used by TRex and OvS need to be isolated in order to minimize disturbance from the other tasks running on Linux. Therefore, the following commands isolate CPUs from the NUMA node where the PCI NIC is connected. CPUs 0 and 12 are left to Linux:
dnf install -y tuned tuned-profiles-cpu-partitioning
cat > /etc/tuned/cpu-partitioning-variables.conf <<EOF
isolated_cores=1-11,13-23
no_balance_cores=1-11,13-23
EOF
tuned-adm profile cpu-partitioning
Finally, DPDK applications require huge pages. It is best to allocate them at boot time to ensure that they are all mapped to contiguous chunks of memory:
cat >> /etc/default/grub <<EOF
GRUB_CMDLINE_LINUX="\$GRUB_CMDLINE_LINUX intel_iommu=on iommu=pt"
GRUB_CMDLINE_LINUX="\$GRUB_CMDLINE_LINUX hugepagesz=1G hugepages=32"
EOF
grub2-mkconfig -o /etc/grub2.cfg
dnf install -y driverctl
driverctl set-override 0000:18:00.2 vfio-pci
driverctl set-override 0000:18:00.3 vfio-pci
# reboot is required to apply isolcpus and allocate hugepages on boot
systemctl reboot
TRex and the traffic generator
TRex needs to be compiled from source. The following commands download and build the program:
dnf install -y python3 git numactl-devel zlib-devel gcc-c++ gcc
git clone https://github.com/cisco-system-traffic-generator/trex-core ~/trex
cd ~/trex/linux_dpdk
./b configure
taskset 0xffffffffff ./b build
We use the following configuration in /etc/trex_cfg.yaml:
- version: 2
  interfaces:
    - "18:00.2"
    - "18:00.3"
  rx_desc: 4096
  tx_desc: 4096
  port_info:
    - dest_mac: "04:3f:72:f2:8f:33"
      src_mac:  "04:3f:72:f2:8f:32"
    - dest_mac: "04:3f:72:f2:8f:32"
      src_mac:  "04:3f:72:f2:8f:33"

  c: 22
  memory:
    mbuf_64: 30000
    mbuf_128: 500000
    mbuf_256: 30717
    mbuf_512: 30720
    mbuf_1024: 30720
    mbuf_2048: 4096

  platform:
    master_thread_id: 0
    latency_thread_id: 12
    dual_if:
      - socket: 0
        threads: [
           1,  2,  3,  4,  5,  6,  7,  8,  9, 10, 11,
          13, 14, 15, 16, 17, 18, 19, 20, 21, 22, 23,
        ]
Finally, we can start TRex:
cd ~/trex/scripts
./t-rex-64 -i --astf
The TRex daemon runs in the foreground. The cps_ndr.py script connects to the daemon via the JSON-RPC API in a separate terminal.
The device under test
First, let's compile and install DPDK:
dnf install -y git meson ninja-build gcc python3-pyelftools
git clone -b v21.11 https://github.com/DPDK/dpdk ~/dpdk
cd ~/dpdk
meson build
taskset 0xffffff ninja -C ~/dpdk/build install
Then compile and install OVS. In the following console excerpt, I explicitly check out version 2.17.2. Version 3.0.0 will be recompiled before running all tests again:
dnf install -y gcc-g++ make libtool autoconf automake
git clone -b v2.17.2 https://github.com/openvswitch/ovs ~/ovs
cd ~/ovs
./boot.sh
PKG_CONFIG_PATH="/usr/local/lib64/pkgconfig" ./configure --with-dpdk=static
taskset 0xffffff make install -j24
/usr/local/share/openvswitch/scripts/ovs-ctl start
Here I enable the DPDK user-space datapath and configure a bridge with two ports. For now, there is only one receive (RX) queue per port, and one CPU is assigned to poll them. I will increase these parameters along the way.
I set the conntrack table size to a relatively large value (5 million entries) to reduce the risk of it getting full during tests. Also, I configure the various timeout policies to match the traffic profiles I am about to send. These aggressive timeouts help prevent the table from getting full. The default timeout values are very conservative—they're too long to achieve high numbers of connections per second without filling the conntrack table:
ovs-vsctl set open_vswitch . other_config:dpdk-init=true
ovs-vsctl set open_vswitch . other_config:pmd-cpu-mask="0x4"
/usr/local/share/openvswitch/scripts/ovs-ctl restart
ovs-vsctl add-br br0 -- set bridge br0 datapath_type=netdev
ovs-vsctl add-port br0 port0 -- \
    set interface port0 type=dpdk options:dpdk-devargs=0000:18:00.2
ovs-vsctl add-port br0 port1 -- \
    set Interface port1 type=dpdk options:dpdk-devargs=0000:18:00.3

ovs-appctl dpctl/ct-set-maxconns 5000000
# creating an empty datapath record is required to add a zone timeout policy
ovs-vsctl -- --id=@m create Datapath datapath_version=0 -- \
    set Open_vSwitch . datapaths:"netdev"=@m
ovs-vsctl add-zone-tp netdev zone=0 \
    udp_first=1 udp_single=1 udp_multiple=30 tcp_syn_sent=1 \
    tcp_syn_recv=1 tcp_fin_wait=1 tcp_time_wait=1 tcp_close=1 \
    tcp_established=30

cat > ~/ct-flows.txt << EOF
priority=1 ip ct_state=-trk                   actions=ct(table=0)
priority=1 ip ct_state=+trk+new in_port=port0 actions=ct(commit),normal
priority=1 ip ct_state=+trk+est               actions=normal
priority=0 actions=drop
EOF
Test procedure
The cps_ndr.py script that I have written has multiple parameters to control the nature of the generated connections:
- Ratio of TCP connections to UDP connections
- Number of data messages (request + response) exchanged per connection (excluding protocol overhead)
- Size of data messages in bytes (to emulate the TCP maximum segment size)
- Time in milliseconds that the simulated servers wait before sending a response to a request
In the context of this benchmark, I intentionally keep the size of data messages fixed to 20 bytes, to avoid being limited by the 10Gbit bandwidth.
I run two types of test: One with short-lived connections and the other with long-lived connections. Both the short-lived and long-lived connection profiles are tested against OVS versions 2.17.2 and 3.0.0. Different configurations are tested to check whether performance scales with the number of CPUs and receive queues.
Short-lived connections
The parameters of this test consist of sending 40 data bytes per connection (1 request + 1 reply of 20 bytes each), with no wait by the server before sending the replies. These parameters stress the conntrack creation and destruction code path.
An example run follows:
[root@tgen scripts]# ./cps_ndr.py --sample-time 30 --max-iterations 8 \
>    --error-threshold 0.02 --udp-percent 1 --num-messages 1 \
>    --message-size 20 --server-wait 0 -m 1k -M 100k
... iteration #1: lower=1.0K current=50.5K upper=100K
▼▼▼ Flows: active 26.8K (50.1K/s) TX: 215Mb/s (345Kp/s) RX: 215Mb/s (345Kp/s) Size: ~4.5B
err dropped: 1.6K pkts (1.6K/s) ~ 0.4746%
... iteration #2: lower=1.0K current=25.8K upper=50.5K
▲▲▲ Flows: active 12.9K (25.7K/s) TX: 112Mb/s (179Kp/s) RX: 112Mb/s (179Kp/s) Size: ~4.5B
... iteration #3: lower=25.8K current=38.1K upper=50.5K
▲▲▲ Flows: active 19.1K (38.1K/s) TX: 166Mb/s (266Kp/s) RX: 166Mb/s (266Kp/s) Size: ~4.5B
... iteration #4: lower=38.1K current=44.3K upper=50.5K
▼▼▼ Flows: active 22.2K (44.2K/s) TX: 192Mb/s (307Kp/s) RX: 191Mb/s (307Kp/s) Size: ~4.5B
err dropped: 1.3K pkts (125/s) ~ 0.0408%
... iteration #5: lower=38.1K current=41.2K upper=44.3K
▲▲▲ Flows: active 20.7K (41.2K/s) TX: 178Mb/s (286Kp/s) RX: 178Mb/s (286Kp/s) Size: ~4.5B
... iteration #6: lower=41.2K current=42.8K upper=44.3K
▼▼▼ Flows: active 21.5K (42.6K/s) TX: 185Mb/s (296Kp/s) RX: 185Mb/s (296Kp/s) Size: ~4.5B
err dropped: 994 pkts (99/s) ~ 0.0335%
... iteration #7: lower=41.2K current=42.0K upper=42.8K
▼▼▼ Flows: active 21.0K (41.8K/s) TX: 181Mb/s (290Kp/s) RX: 181Mb/s (290Kp/s) Size: ~4.5B
err dropped: 877 pkts (87/s) ~ 0.0301%
... iteration #8: lower=41.2K current=41.6K upper=42.0K
▲▲▲ Flows: active 20.9K (41.4K/s) TX: 180Mb/s (289Kp/s) RX: 180Mb/s (289Kp/s) Size: ~4.5B
Long-lived connections
The parameters of this test consist of sending 20K data bytes per connection (500 requests + 500 replies of 20 bytes each) over 25 seconds. These parameters stress the conntrack lookup code path.
An example run follows:
[root@tgen scripts]# ./cps_ndr.py --sample-time 120 --max-iterations 8 \
>    --error-threshold 0.02 --udp-percent 1 --num-messages 500 \
>    --message-size 20 --server-wait 50 -m 500 -M 2k
... iteration #1: lower=500 current=1.2K upper=2.0K
▼▼▼ Flows: active 48.5K (1.2K/s) TX: 991Mb/s (1.5Mp/s) RX: 940Mb/s (1.4Mp/s) Size: ~13.3B
err dropped: 1.8M pkts (30.6K/s) ~ 2.4615%
... iteration #2: lower=500 current=875 upper=1.2K
▲▲▲ Flows: active 22.5K (871/s) TX: 871Mb/s (1.3Mp/s) RX: 871Mb/s (1.3Mp/s) Size: ~13.3B
... iteration #3: lower=875 current=1.1K upper=1.2K
▼▼▼ Flows: active 33.8K (1.1K/s) TX: 967Mb/s (1.4Mp/s) RX: 950Mb/s (1.4Mp/s) Size: ~13.3B
err dropped: 621K pkts (10.3K/s) ~ 0.7174%
... iteration #4: lower=875 current=968 upper=1.1K
▲▲▲ Flows: active 24.9K (965/s) TX: 961Mb/s (1.4Mp/s) RX: 962Mb/s (1.4Mp/s) Size: ~13.3B
... iteration #5: lower=968 current=1.0K upper=1.1K
▼▼▼ Flows: active 29.8K (1.0K/s) TX: 965Mb/s (1.4Mp/s) RX: 957Mb/s (1.4Mp/s) Size: ~13.3B
err dropped: 334K pkts (5.6K/s) ~ 0.3830%
... iteration #6: lower=968 current=992 upper=1.0K
▼▼▼ Flows: active 25.5K (989/s) TX: 964Mb/s (1.4Mp/s) RX: 964Mb/s (1.4Mp/s) Size: ~13.3B
err dropped: 460 pkts (460/s) ~ 0.0314%
... iteration #7: lower=968 current=980 upper=992
▼▼▼ Flows: active 25.3K (977/s) TX: 962Mb/s (1.4Mp/s) RX: 962Mb/s (1.4Mp/s) Size: ~13.3B
err dropped: 397 pkts (397/s) ~ 0.0272%
... iteration #8: lower=968 current=974 upper=980
▲▲▲ Flows: active 25.1K (971/s) TX: 969Mb/s (1.5Mp/s) RX: 969Mb/s (1.5Mp/s) Size: ~13.3B
Performance statistics
This section presents results of runs with varying numbers of CPUs and queues on my test system. The numbers that I measured should be taken with a grain of salt. Connection tracking performance is highly dependent on hardware, traffic profile, and overall system load. I provide the statistics here just to give a general idea of the improvement brought by OVS 3.0.0.
Baseline results for comparison
For reference, the tests were executed with a cable connecting port0 and port1 of the traffic generator machine. This is the maximum performance TRex is able to achieve with this configuration and hardware.
| Type | Connection rate | Active flows | Bandwidth | Packet rate |
|---|---|---|---|---|
| Short-lived | 1.8M conn/s | 1.7M | 8.4G bit/s | 12.7M pkt/s |
| Long-lived | 11.1K conn/s | 898K | 8.0G bit/s | 11.4M pkt/s |
1 CPU, 1 queue per port, without connection tracking
The results in this section were achieved with the following DUT configuration:
ovs-vsctl set open_vswitch . other_config:pmd-cpu-mask="0x4"
ovs-vsctl set Interface port0 options:n_rxq=1
ovs-vsctl set Interface port1 options:n_rxq=1
ovs-ofctl del-flows br0
ovs-ofctl add-flow br0 action=normal
| Version | Short-lived connections | Active flows | Bandwidth | Packet rate | Difference |
|---|---|---|---|---|---|
| 2.17.2 | 1.0M conn/s | 524.8K | 4.5G bit/s | 7.3M pkt/s | |
| 3.0.0 | 1.0M conn/s | 513.1K | 4.5G bit/s | 7.1M pkt/s | -1.74% |
| Version | Long-lived connections | Active flows | Bandwidth | Packet rate | Difference |
|---|---|---|---|---|---|
| 2.17.2 | 3.1K conn/s | 79.9K | 3.1G bit/s | 4.7M pkt/s | |
| 3.0.0 | 2.8K conn/s | 71.9K | 2.8G bit/s | 4.2M pkt/s | -9.82% |
There is a drop in performance, without connection tracking enabled, between versions 2.17.2 and 3.0.0. This drop is completely unrelated to the conntrack optimization patch series I am focusing on. It might be caused by some discrepancies in the test procedure, but it might also have been introduced by another patch series between the two tested versions.
1 CPU, 1 queue per port
The results in this section were achieved with the following DUT configuration:
ovs-vsctl set open_vswitch . other_config:pmd-cpu-mask="0x4"
ovs-vsctl set Interface port0 options:n_rxq=1
ovs-vsctl set Interface port1 options:n_rxq=1
ovs-ofctl del-flows br0
ovs-ofctl add-flows br0 ~/ct-flows.txt
| Version | Short-lived connections | Active flows | Bandwidth | Packet rate | Difference |
|---|---|---|---|---|---|
| 2.17.2 | 39.7K conn/s | 20.0K | 172.0M bit/s | 275.8K pkt/s | |
| 3.0.0 | 48.2K conn/s | 24.3K | 208.9M bit/s | 334.9K pkt/s | +21.36% |
| Version | Long-lived connections | Active flows | Bandwidth | Packet rate | Difference |
|---|---|---|---|---|---|
| 2.17.2 | 959 conn/s | 24.7K | 956.6M bit/s | 1.4M pkt/s | |
| 3.0.0 | 1.2K conn/s | 31.5K | 1.2G bit/s | 1.8M pkt/s | +28.15% |
Already here, we can see that the patch series improves the single-threaded performance of connection tracking during the creation, destruction, and lookup code paths. Keep these results in mind when looking at improvements in multithreaded performance.
2 CPUs, 1 queue per port
The results in this section were achieved with the following DUT configuration:
ovs-vsctl set open_vswitch . other_config:pmd-cpu-mask="0x2002"
ovs-vsctl set Interface port0 options:n_rxq=1
ovs-vsctl set Interface port1 options:n_rxq=1
ovs-ofctl del-flows br0
ovs-ofctl add-flows br0 ~/ct-flows.txt
| Version | Short-lived connections | Active flows | Bandwidth | Packet rate | Difference |
|---|---|---|---|---|---|
| 2.17.2 | 39.9K conn/s | 20.0K | 172.8M bit/s | 277.0K pkt/s | |
| 3.0.0 | 46.8K conn/s | 23.5K | 202.7M bit/s | 325.0K pkt/s | +17.28% |
| Version | Long-lived connections | Active flows | Bandwidth | Packet rate | Difference |
|---|---|---|---|---|---|
| 2.17.2 | 885 conn/s | 22.7K | 883.1M bit/s | 1.3M pkt/s | |
| 3.0.0 | 1.1K conn/s | 28.6K | 1.1G bit/s | 1.7M pkt/s | +25.19% |
It is worth noting that assigning twice as many CPUs to do packet processing does not double the performance. Far from it, in fact. The numbers are exactly the same (if not lower) than with only one CPU.
This surprising result might be caused because there is only one RX queue per port and each CPU processes a single port.
2 CPUs, 2 queues per port
The results in this section were achieved with the following DUT configuration:
ovs-vsctl set open_vswitch . other_config:pmd-cpu-mask="0x2002"
ovs-vsctl set Interface port0 options:n_rxq=2
ovs-vsctl set Interface port1 options:n_rxq=2
ovs-ofctl del-flows br0
ovs-ofctl add-flows br0 ~/ct-flows.txt
| Version | Short-lived connections | Active flows | Bandwidth | Packet rate | Difference |
|---|---|---|---|---|---|
| 2.17.2 | 48.3K conn/s | 24.3K | 208.8M bit/s | 334.8K pkt/s | |
| 3.0.0 | 65.9K conn/s | 33.2K | 286.8M bit/s | 459.9K pkt/s | +36.41% |
For short-lived connections, we begin to see improvement beyond the single-threaded performance gain. Lock contention was reduced during the insertion and deletion of conntrack entries.
| Version | Long-lived connections | Active flows | Bandwidth | Packet rate | Difference |
|---|---|---|---|---|---|
| 2.17.2 | 1.1K conn/s | 29.1K | 1.1G bit/s | 1.7M pkt/s | |
| 3.0.0 | 1.4K conn/s | 37.0K | 1.4G bit/s | 2.2M pkt/s | +26.77% |
With two CPUs and two queues, if we take the single-threaded performance out of the picture, there seems to be no improvement in conntrack lookup for long-lived connections.
4 CPUs, 2 queues per port
The results in this section were achieved with the following DUT configuration:
ovs-vsctl set open_vswitch . other_config:pmd-cpu-mask="0x6006"
ovs-vsctl set Interface port0 options:n_rxq=2
ovs-vsctl set Interface port1 options:n_rxq=2
ovs-ofctl del-flows br0
ovs-ofctl add-flows br0 ~/ct-flows.txt
| Version | Short-lived connections | Active flows | Bandwidth | Packet rate | Difference |
|---|---|---|---|---|---|
| 2.17.2 | 47.4K conn/s | 23.9K | 206.2M bit/s | 330.6K pkt/s | |
| 3.0.0 | 49.1K conn/s | 24.7K | 212.1M bit/s | 340.1K pkt/s | +3.53% |
The short-lived connection rate performance has dropped in 3.0.0. This is not a fluke: The numbers are consistent across multiple runs. This drop warrants some scrutiny, but does not invalidate all the work that has been done.
| Version | Long-lived connections | Active flows | Bandwidth | Packet rate | Difference |
|---|---|---|---|---|---|
| 2.17.2 | 981 conn/s | 25.2K | 977.7M bit/s | 1.5M pkt/s | |
| 3.0.0 | 2.0K conn/s | 52.4K | 2.0G bit/s | 3.1M pkt/s | +108.31% |
With four CPUs and two queues per port, long-lived connections tracking is starting to scale up.
4 CPUs, 4 queues per port
The results in this section were achieved with the following DUT configuration:
ovs-vsctl set open_vswitch . other_config:pmd-cpu-mask="0x6006"
ovs-vsctl set Interface port0 options:n_rxq=4
ovs-vsctl set Interface port1 options:n_rxq=4
ovs-ofctl del-flows br0
ovs-ofctl add-flows br0 ~/ct-flows.txt
| Version | Short-lived connections | Active flows | Bandwidth | Packet rate | Difference |
|---|---|---|---|---|---|
| 2.17.2 | 66.1K conn/s | 33.2K | 286.4M bit/s | 459.2K pkt/s | |
| 3.0.0 | 100.8K conn/s | 50.6K | 437.0M bit/s | 700.6K pkt/s | +52.55% |
| Version | Long-lived connections | Active flows | Bandwidth | Packet rate | Difference |
|---|---|---|---|---|---|
| 2.17.2 | 996 conn/s | 25.9K | 994.2M bit/s | 1.5M pkt/s | |
| 3.0.0 | 2.6K conn/s | 67.0K | 2.6G bit/s | 3.9M pkt/s | +162.89% |
8 CPUs, 4 queues per port
The results in this section were achieved with the following DUT configuration:
ovs-vsctl set open_vswitch . other_config:pmd-cpu-mask="0x1e01e"
ovs-vsctl set Interface port0 options:n_rxq=4
ovs-vsctl set Interface port1 options:n_rxq=4
ovs-ofctl del-flows br0
ovs-ofctl add-flows br0 ~/ct-flows.txt
| Version | Short-lived connections | Active flows | Bandwidth | Packet rate | Difference |
|---|---|---|---|---|---|
| 2.17.2 | 62.2K conn/s | 31.3K | 269.8M bit/s | 432.5K pkt/s | |
| 3.0.0 | 90.1K conn/s | 45.2K | 390.9M bit/s | 626.7K pkt/s | +44.89% |
| Version | Long-lived connections | Active flows | Bandwidth | Packet rate | Difference |
|---|---|---|---|---|---|
| 2.17.2 | 576 conn/s | 17.1K | 567.2M bit/s | 852.5K pkt/s | |
| 3.0.0 | 3.8K conn/s | 97.8K | 3.8G bit/s | 5.7M pkt/s | +562.76% |
8 CPUs, 8 queues per port
The results in this section were achieved with the following DUT configuration:
ovs-vsctl set open_vswitch . other_config:pmd-cpu-mask="0x1e01e"
ovs-vsctl set Interface port0 options:n_rxq=8
ovs-vsctl set Interface port1 options:n_rxq=8
ovs-ofctl del-flows br0
ovs-ofctl add-flows br0 ~/ct-flows.txt
| Version | Short-lived connections | Active flows | Bandwidth | Packet rate | Difference |
|---|---|---|---|---|---|
| 2.17.2 | 50.6K conn/s | 25.5K | 219.5M bit/s | 351.9K pkt/s | |
| 3.0.0 | 100.9K conn/s | 50.7K | 436.0M bit/s | 698.9K pkt/s | +99.36% |
| Version | Long-lived connections | Active flows | Bandwidth | Packet rate | Difference |
|---|---|---|---|---|---|
| 2.17.2 | 541 conn/s | 14.0K | 539.2M bit/s | 810.3K pkt/s | |
| 3.0.0 | 4.8K conn/s | 124.1K | 4.8G bit/s | 7.2M pkt/s | +792.83% |
Performance improvements in version 3.0.0 of Open vSwitch
Using the tools in this article, I have been able to record advances made in version 3.0.0 in scaling and in handling long-lived connections.
Scaling
Figure 2 shows how many insertions and deletions per second were achieved on different system configurations for short-lived connections.
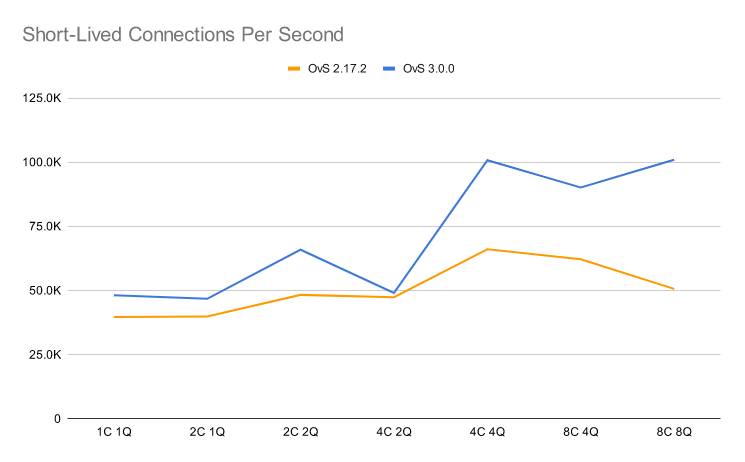
Apart from the small blip with 4 CPUs and 2 queues per port, the conntrack insertion and deletion code path has improved consistently in OvS 3.0.0. The multithreaded lock contention remains, but is less noticeable than with OvS 2.17.2.
Figure 3 shows how many insertions and deletions per second were achieved on different system configurations for long-lived connections.
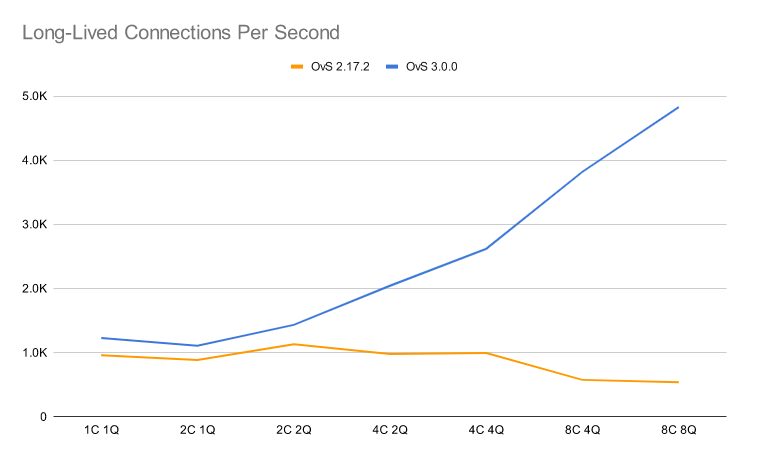
Long-lived connections tracking is where the optimizations done in OvS 3.0.0 really shine. The reduction in multithreaded lock contention with conntrack lookup makes the performance scale significantly better with the number of CPUs.
Performance during high traffic
The following commands generate profiling reports using the Linux kernel's perf command. I measured the performance of both version 2.17.2 and version 3.0.0 for 8 CPUs and 8 RX queues under a maximum load for long-lived connections, with conntrack flows enabled. Only the events of a single CPU were captured:
perf record -g -C 1 sleep 60
perf report -U --no-children | grep '\[[\.k]\]' | head -15 > profile-$version.txt
In the subsections that follow, I have manually annotated lines that are directly related to acquiring mutexes so that they start with a * character. When a CPU is waiting for a mutex acquisition, it is not processing any network traffic, but waiting for another CPU to release the lock.
Performance in version 2.17.2
The profiled CPU spends almost 40% of its cycles acquiring locks and waiting for other CPUs to release locks:
* 30.99%  pmd-c01/id:5  libc.so.6          [.] pthread_mutex_lock@@GLIBC_2.2.5
  12.27%  pmd-c01/id:5  ovs-vswitchd       [.] dp_netdev_process_rxq_port
   5.18%  pmd-c01/id:5  ovs-vswitchd       [.] netdev_dpdk_rxq_recv
   4.24%  pmd-c01/id:5  ovs-vswitchd       [.] pmd_thread_main
   3.93%  pmd-c01/id:5  ovs-vswitchd       [.] pmd_perf_end_iteration
*  3.63%  pmd-c01/id:5  libc.so.6          [.] __GI___pthread_mutex_unlock_usercnt
   3.62%  pmd-c01/id:5  ovs-vswitchd       [.] i40e_recv_pkts_vec_avx2
*  2.76%  pmd-c01/id:5  [kernel.kallsyms]  [k] syscall_exit_to_user_mode
*  0.91%  pmd-c01/id:5  libc.so.6          [.] __GI___lll_lock_wait
*  0.18%  pmd-c01/id:5  [kernel.kallsyms]  [k] __x64_sys_futex
*  0.17%  pmd-c01/id:5  [kernel.kallsyms]  [k] futex_wait
*  0.12%  pmd-c01/id:5  [kernel.kallsyms]  [k] entry_SYSCALL_64_after_hwframe
*  0.11%  pmd-c01/id:5  libc.so.6          [.] __GI___lll_lock_wake
*  0.08%  pmd-c01/id:5  [kernel.kallsyms]  [k] do_syscall_64
*  0.06%  pmd-c01/id:5  [kernel.kallsyms]  [k] do_futex
Performance in version 3.0.0
It is obvious that 3.0.0 has much less lock contention and therefore scales better with the number of CPUs:
  15.30%  pmd-c01/id:5  ovs-vswitchd       [.] dp_netdev_input__
   8.62%  pmd-c01/id:5  ovs-vswitchd       [.] conn_key_lookup
   7.88%  pmd-c01/id:5  ovs-vswitchd       [.] miniflow_extract
   7.75%  pmd-c01/id:5  ovs-vswitchd       [.] cmap_find
*  6.92%  pmd-c01/id:5  libc.so.6          [.] pthread_mutex_lock@@GLIBC_2.2.5
   5.15%  pmd-c01/id:5  ovs-vswitchd       [.] dpcls_subtable_lookup_mf_u0w4_u1w1
   4.16%  pmd-c01/id:5  ovs-vswitchd       [.] cmap_find_batch
   4.10%  pmd-c01/id:5  ovs-vswitchd       [.] tcp_conn_update
   3.86%  pmd-c01/id:5  ovs-vswitchd       [.] dpcls_subtable_lookup_mf_u0w5_u1w1
   3.51%  pmd-c01/id:5  ovs-vswitchd       [.] conntrack_execute
   3.42%  pmd-c01/id:5  ovs-vswitchd       [.] i40e_xmit_fixed_burst_vec_avx2
   0.77%  pmd-c01/id:5  ovs-vswitchd       [.] dp_execute_cb
   0.72%  pmd-c01/id:5  ovs-vswitchd       [.] netdev_dpdk_rxq_recv
   0.07%  pmd-c01/id:5  ovs-vswitchd       [.] i40e_xmit_pkts_vec_avx2
   0.04%  pmd-c01/id:5  ovs-vswitchd       [.] dp_netdev_input
Final words
I hope this gave you some ideas for benchmarking and profiling connection tracking with TRex and perf. Please leave any questions you have in comments on this article.
Kudos to Paolo Valerio and Gaëtan Rivet for their work on optimizing the user space OvS conntrack implementation.
Last updated: May 30, 2024