Measuring stuff is harder than you may think. Even in math, there is such a thing as non-measurable sets and Banach-Tarski paradox, which shows that a three-dimensional ball of radius 1 can be dissected into 5 parts, which can be magically reassembled to form two balls of radius 1. Now imagine what kind of mess we've got in software engineering.
This may sound somewhat philosophical, so let's get down to earth and talk about BPF programs. BPF, which originally stood for Berkeley Packet Filter, is a general-purpose execution engine that can be used for a variety of purposes, including networking, observability, and security. What we'll be discussing in this article was initially called extended BPF (eBPF) to differentiate from the classic BPF, but now this technology is often referred to as just BPF, and that's what we'll call it here.
Having full visibility throughout the systems we build is a well established best practice. Usually, one knows which metrics to collect, and how and what to profile or instrument to understand why the system exhibits certain levels of performance. But all of this becomes more challenging as soon as the BPF layer is included. Despite years of development, it is still a black box in many ways.
But do not despair: this article will show, with some amount of creativity, that one can reveal what is going on under the hood. The article will begin with a userspace service that uses BPF programs attached to various syscalls to inspect system activity. It does the job, but what we really want is to understand the overhead of the BPF programs themselves. How do you look inside? That's the problem that we will ultimately tackle.
Anatomy of a system call
There is a tradition of capturing explanations of system calls (syscalls) under the title "anatomy of a system call," which we diligently follow. Since we acquire most of the information from syscalls, the first step is understanding how they work.
Each architecture application binary interface (ABI) has requirements influencing how system calls work. Let’s limit our discussion to x86_64. The standard ABI for how x86_64 is to put the system call number into the RAX register and the other parameters into specific registers, then issue the SYSCALL instruction, goes something like this:
SYSCALL invokes an OS system call handler at privilege level 0. It does so by loading RIP from the IA32_LSTAR MSR after saving the address of the instruction following syscall into RCX. The WRMSR instruction ensures that the IA32_LSTAR MSR always contains a canonical address.
At system startup, the kernel provides a custom entry_SYSCALL_64 function for handling syscalls and writes the address of this handler function to the MSR_LSTAR register. The final step is to call the function pointer from the system call table using the number stored in RAX.
Now, there could be a set of hooks specified, to be invoked before the execution of the actual syscall. It could be a custom probe registered for the corresponding static tracepoint or dynamic kprobe. We need to use them to instrument our application. Here is where things get tricky.
Who traces the tracer?
The main problem with measuring performance is measuring the right thing. In the case of measuring the performance of a program responsible for tracing another, this can be quite challenging. Consider sys_enter and sys_exit tracepoints that fire before or after a syscall is executed. We have BPF programs performing some activity when triggering those tracepoints. The exercise is to measure time spent in those programs.
There is some machinery in the kernel itself to collect statistics about BPF program runtime that give us cumulative time and number of runs for a particular program:
$ sysctl -w kernel.bpf_stats_enabled=1
$ bpftool prog
[...] 379: raw_tracepoint [...] run_time_ns 35875602162 run_cnt 160512637
Such aggregated numbers are good for sanity checks; but usually, they are not enough.
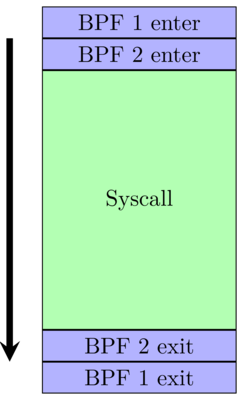
Another naive approach is to follow the same strategy as instrumenting normal userspace applications. Trace the same points, looking at any difference in performance (i.e., overall syscall latency) between the tracing program running and not running. All things considered, this approach could work, but only if you can guarantee that the performance-measuring probe is executed at the right time: before the start of the tracing program, and after it finishes (see Figure 1).
But alas, this will never happen because BPF programs are designed to be independent. So it barely makes sense to talk about their ordering.
Given the difficulty of getting the execution timing right, can we measure from a different point? Our first thought was to measure inside the probes themselves instead. That way, we could ignore all the cruft of the kernel running the syscall and focus on our execution. If we can measure that correctly, then that should give us the overhead. Simple, right? In theory, yes. But in practice, it was a bit more complicated.
The main difficulty was getting the information out of the BPF probe or the kernel module. Initially, we tried a quick and dirty approach of writing a message to the trace pipe and then consuming and processing those events to get the data.
 //somewhere inside your BPF prog
bpf_trace_printk("Start timestamp: %lld", ts);
$ cat /sys/kernel/debug/tracing/trace_pipe
$ bpftool prog tracelog
This gave us promising initial results. However, it was not practical because it introduced significant measurement overhead.
Another point to measure could be a kernel function on the way to the syscall. We wondered whether there was kernel code around the syscall that we can attach to instead, guaranteeing the desirable probe execution order. By examining stacktraces captured via ftrace, we found that there is a small function that does just that. On amd64, it is called do_syscall_64. It is slightly higher in the call stack than sys_enter and sys_exit, so we can measure latency from the start of do_syscall_64 to the end of the function, which will include any overhead from our probes. Is this ideal, or not?
Tale of two probes
One minor inconvenience with do_syscall_64 is that on kernels newer than 5.6, it can’t be used for this measurement because of a notrace marking. In this sense, we end up at the mercy of kernel internals. But there are more annoying problems along the way.
When we first fired up the measurements using kprobe and kretprobe to attach to the start/finish, we noticed that while the kprobe fired consistently, there was only a small number of kretprobe executions. Obviously, this didn’t make any sense because the calls were definitely complete, and there was no problem in userspace indicating that the syscalls were running correctly. Luckily, the kernel documentation provided some answers.
A kprobe implements a kretprobe on the function entry. That probe stores the return address of the function and overwrites it with a trampoline address. When the function returns, the trampoline calls into the user-provided probe (i.e., our performance measuring BPF program). So why don’t we see all the returns?
While the probed function is executing, an object of type kretprobe_instance stores its return address. Before calling register_kretprobe(), the user sets the maxactive field of the kretprobe struct to specify how many instances of simultaneous probing for the specified function can be probed simultaneously. register_kretprobe() pre-allocates the indicated number of kretprobe_instance objects.
The problem is that there is a limit to the number of simultaneously stored return addresses. If you're running on a very busy codepath (like on every system call), then you're going to fill up this list very quickly and inevitably drop many events. The first experiments utilized bpftrace, which uses the perf API and does not support specifying maxactive. However, configuration is possible in a custom bcc script. In our case, we had to set it to a large value to capture all the events that occurred.
If you are curious, there is an alternative approach. The functions kfunc and kretfunc in bpftrace use the fentry/fexit mechanism and BPF trampolines to do the same process, and they are not affected by kprobe machinery with maxactive.
When you find a good solution, look for a better one
This solution is good, but not perfect. It is a reasonable way to collect the measurements. It covers not only BPF programs but also the underlying syscall. This brings a lot of variance and annoying noise into the captured data. Is there a way to make the measurements narrower?
The answer: BPF Type Format (BTF).
When BTF information is available for the BPF program, the kernel JIT compiler emits instructions for providing fentry/fexit (seems like jumps 0xE9 ). We could use those to attach two more monitoring BPF programs to the start/finish of our target BPF program and collect various events in between. In this way, one measures only a particular BPF program without including anything else. In fact, bpftool prog profile and new perf stat -b work in the same way.
Profiling BPF programs
So far, this discussion has revolved around getting counters between two points. But we can profile our BPF programs to understand what is happening at the instruction level.
We can profile a BPF program as part of any other kernel activity, but there seems to be no way to profile only one program. However, there is one possible approach to acquiring the tag of the BPF program: record samples of kernel activity, then annotate only those parts.
$ bpftool prog id 5
5: tracepoint name <tp_name> tag 19c24c00f06f9dce gpl
$ perf record ...
$ perf annotate -l -P bpf_prog19c24c00f06f9dce
[...]
// bpf_prog_19c24c00f06f9dce[48]
13.56 :   48:callq  0xffffffffc5dfe8cc
 0.00 :   4d:mov -0x8(%rbp),%edi
 0.00 :  50:and  $0x2,%rdi
 0.00 :  54:test %rdi,%rdi
[...]
The resulting annotated instructions match exactly to the JITed dump of the BPF program from bpftool.
Summary
Hopefully, the information described here helps to shed some light on the darkest corners of your system. There is still much more to learn and develop, but a journey of a thousand miles begins with a first step.