Introduction
As the OpenShift Virtualization Performance & Scale team, we get access to hardware provided by our Red Hat Scale Lab that allows us to perform very high scale cluster testing. During this testing, we push the boundaries of both the control plane through heavy VM deployment tests, as well as the data plane while testing different VM workload scenarios at scale. We also work to find any component bottlenecks by pushing VM live migration limits to high values and performing parallel node drains and cluster upgrades with varying VM load. We often get asked how to "validate" the performance and scalability of a cluster, in this blog series we’ll cover some of this testing in more detail and provide examples that can be adapted to meet testing needs in other environments.
In the first part of our HighScale testing series, we will talk about our work to validate the current supported limit of 10,000 VMs per cluster, looking for any regressions, while stressing a large 100 node cluster at the same time. In this example we are evaluating VM startup latency and corresponding resource usage across the cluster.
Cluster Setup
Hardware
The Red Hat Scale Lab provided us with the following set of nodes to make up our cluster of 3 control plane nodes and 100 worker nodes:
- 67 Dell R650
- 2x Intel Xeon Gold 6330
- 56 total cores, 112 threads
- 512GB
- 25 Gb private network
- Storage
- 1x 500GB SATA SSD (rhcos rootdisk)
- 2x 2TB SAS SSD (1 configured as swap device, 1 providing Prom & AlertManager persistent storage)
- 1x 3TB NVMe (ODF disk)
- 36 Dell R660
- 2x Intel Xeon Gold 5420
- 56 total cores, 112 threads
- 512GB
- 25 Gb private network
- Storage:
- 1x 500GB SATA SSD (rhcos rootdisk)
- 2x 2TB SAS SSD (1 configured as swap device, 1 providing Prom & AlertManager persistent storage)
- 1x 3TB NVMe (ODF disk)
In the testing described below, we used the following versions:
- OpenShift 4.19.3
- OpenShift Virtualization 4.19.0
- OpenShift Data Foundation 4.18.6
Operators
We configured the following operators to support our workload use cases, noting any changes beyond normal product defaults.
OpenShift Virtualization
Virtualization was installed using operator defaults.
Note: the total number of virt-api pods automatically scales based on the total worker count (1 per 10 nodes), in this case with 100 nodes we have 10 virt-api pods running in the openshift-cnv namespace.
As recommended by the Tuning & Scaling Guide, we also applied the following cluster tunings:
- Enabled the virt control plane
highBursttuning to scale the QPS (Queries per Second) and Burst RateLimits for the virt client components - Applied a kubeletConfig on the workers to enable:
autoSizingReserved: truewhich is a good practice to protect the host node from memory pressure related failuresnodeStatusMaxImages: -1which is a scheduler tuning that may be needed when balanced resources across nodes is most desired (Kubernetes initial scheduling placement is based on VM/pod resource requests, disabling this MaxImages limit allows the scoring to favor these resource values even for nodes with >50 container images)failSwapOn: falseto enable swap for later memory overcommit testing
Note: applying a new kubeletConfig replaces the last applied version so make sure to include all tunings in the kubeletConfig definition, even if previously applied.
apiVersion: machineconfiguration.openshift.io/v1
kind: KubeletConfig
metadata:
  name: maximages-wasp
spec:
  machineConfigPoolSelector:
      matchLabels:
        pools.operator.machineconfiguration.openshift.io/worker: ""
  autoSizingReserved: true
  kubeletConfig:
      failSwapOn: false
      nodeStatusMaxImages: -1
Also note that in our case we had mixed CPU models, but wanted to allow VMs to freely migrate across all available workers, so we configured a base CPU model in the Hyperconverged config, in our case:
defaultCPUModel: Icelake-Server-v2
Local Storage Operator
The Local Storage Operator (LSO) was installed using operator defaults.
We labeled 99 workers with:
oc label node $node cluster.ocs.openshift.io/openshift-storage= --overwrite
And configured two different storage classes: 1) localblock storage for OpenShift Data Foundation to use and 2) localfile which was used for cluster Monitoring persistent storage. First we configured LocalVolumeDiscovery across the worker nodes:
apiVersion: local.storage.openshift.io/v1alpha1
kind: LocalVolumeDiscovery
metadata:
  name: auto-discover-devices
  namespace: openshift-local-storage
spec:
  nodeSelector:
    nodeSelectorTerms:
      - matchExpressions:
        - key: cluster.ocs.openshift.io/openshift-storage
          operator: In
          values:
            - ""
The following LocalVolumeSet was configured across all nodes for localblock, minSize was set based on the target NVMe disk size:
apiVersion: local.storage.openshift.io/v1alpha1
kind: LocalVolumeSet
metadata:
  name: local-block
  namespace: openshift-local-storage
spec:
  nodeSelector:
    nodeSelectorTerms:
      - matchExpressions:
          - key: cluster.ocs.openshift.io/openshift-storage
            operator: In
            values:
              - ""
  storageClassName: localblock
  volumeMode: Block
  maxDeviceCount: 1  # <-- Maximum number of devices per node to be used
  deviceInclusionSpec:
    deviceTypes:
    - disk     # <--  Full disks only
    deviceMechanicalProperties:
    - NonRotational
    minSize: 2Ti  # NVMe is 2.9T, exclude <2T SSDs
And the following LocalVolume example was used to configure localfile on a subset of nodes using a particular disk “by-path” id (4 nodes were chosen to provide 2 Prometheus PVCs and 2 AlertManager PVCs):
apiVersion: local.storage.openshift.io/v1
kind: LocalVolume
metadata:
  name: local-file
  namespace: openshift-local-storage
spec:
  nodeSelector:
    nodeSelectorTerms:
    - matchExpressions:
        - key: kubernetes.io/hostname
          operator: In
          values:
          - d16-h06-000-r650
          - d21-h25-000-r650
          - d26-h15-000-r650
          - e45-h07-000-r650
  storageClassDevices:
    - storageClassName: localfile
      forceWipeDevicesAndDestroyAllData: false
      volumeMode: Filesystem
      fsType: xfs
      maxDeviceCount: 1
      devicePaths:
        - /dev/disk/by-path/pci-0000:67:00.0-scsi-0:2:1:0
OpenShift Data Foundation
The OpenShift Data Foundation (ODF) operator was installed using defaults and we configured a block-only storage cluster for our VM use case (which does not require Object or FS mode).
Since we are using a hyperconverged configuration (where all workers provide storage and run workloads), and in this case our cluster size is larger at 100 nodes, we chose to implement a best practice 3 "zone" topology which ODF will automatically align to when setting up storage failure domains -- this will allow us to safely drain multiple workers in parallel within the same zone. The maxUnavailable setting in the MachineConfigPool controls how many nodes are allowed to drain at once, and by default the MachineConfigOperator will naturally start draining the first topology zone before moving to the next zone. For example, to configure 5 nodes draining in parallel:
# oc edit machineconfigpool worker

spec:
 configuration:
[...]
 machineConfigSelector:
   matchLabels:
     machineconfiguration.openshift.io/role: worker
 maxUnavailable: 5
Finally, ODF Pod Disruption Budgets will automatically block any "unsafe" drains in terms of storage failure domains, automatically unblocking when quorum is reached to continue node drains in the next zone.
To configure this type of zone topology, before installing the ODF operator, divide all storage nodes into 3 zone labels:
- topology.kubernetes.io/zone=zone1
- topology.kubernetes.io/zone=zone2
- topology.kubernetes.io/zone=zone3
For example:
oc label node $node topology.kubernetes.io/zone=zone1 --overwrite
After the ODF operator was installed and running, we applied this example block-only StorageCluster configuration, adjusting the count based on our 99 total devices across replica 3 mode:
apiVersion: ocs.openshift.io/v1
kind: StorageCluster
metadata:
  name: ocs-storagecluster
  namespace: openshift-storage
spec:
  enableCephTools: true
  manageNodes: false
  monDataDirHostPath: /var/lib/rook
  managedResources:
    cephBlockPools:
      reconcileStrategy: manage
    cephFilesystems:
      reconcileStrategy: ignore
    cephObjectStoreUsers:
      reconcileStrategy: ignore
    cephObjectStores:
      reconcileStrategy: ignore
    storageClasses:
      reconcileStrategy: manage
  multiCloudGateway:
    reconcileStrategy: ignore
  storageDeviceSets:
  - count: 33       #  <-- For each set of 3 disks increment the count by 1.
    dataPVCTemplate:
      spec:
        accessModes:
        - ReadWriteOnce
        resources:
          requests:
            storage: "1"  # <-- will be determined by localvolume PV size
        storageClassName: localblock
        volumeMode: Block
    name: ocs-deviceset
    placement: {}
    portable: false
    replica: 3
The operator will bring up the Ceph cluster based on this configuration and automatically configure the Block RBD StorageClasses.
Note: we did observe during early scale testing that the odf-csi-addons component could hit OOM (out of memory) conditions when performing very high numbers of clone operations. For the testing described here we applied the following tuning, as described in this Knowledgebase Solution, to bump up the memory limit of this component to 2Gi:
oc patch subscriptions.operators.coreos.com -n openshift-storage odf-csi-addons-operator-stable-4.18-redhat-operators-openshift-marketplace -p '{"spec":{"config":{"resources":{"limits":{"memory":"2Gi","cpu":"1000m"},"requests":{"memory":"2Gi","cpu":"10m"}}}}}' --type merge
Follow this bug to track future optimizations to this component’s memory usage so that this tuning will no longer be required in high scale environments: https://issues.redhat.com/browse/DFBUGS-3653
Monitoring
To configure persistent storage for cluster monitoring so we could retain metric data across node drains and reboots, we applied this ConfigMap to utilize the LSO localfile storage class (note: this will restart the running prometheus pods):
apiVersion: v1
kind: ConfigMap
metadata:
  name: cluster-monitoring-config
  namespace: openshift-monitoring
data:
  config.yaml: |
   prometheusK8s:
    retention: 15d    #  <- can be lowered if storage is growing too large
    volumeClaimTemplate:
      metadata:
        name: prometheusdb
      spec:
        storageClassName: localfile
        volumeMode: Filesystem
        resources:
          requests:
            storage: 1400Gi
   alertmanagerMain:
    volumeClaimTemplate:
      metadata:
        name: alertmanager
      spec:
        storageClassName: localfile
        volumeMode: Filesystem
        resources:
          requests:
            storage: 1400Gi
Dashboards
Finally, we configured various engineering dashboards to evaluate cluster metric data. These upstream examples are used for internal test configs, although may provide useful metric query examples:
- OpenShift control plane: https://github.com/cloud-bulldozer/performance-dashboards/tree/master/templates
- Kubevirt control plane: https://github.com/kubevirt/monitoring/blob/main/dashboards/grafana/kubevirt-control-plane.json
- CNV perf & scale dashboard: https://github.com/gqlo/ocp-workspace/blob/main/dashboard/cnv.json
- OpenShift Data Foundation: https://github.com/redhat-performance/odf-grafana
VM Density Testing
In our VM density tests, sometimes called VM "bootstorms", we are stress testing both the cluster control plane as well as the Virtualization operator control plane components, and each worker node’s kubelet and container scalability with roughly 100 VMs running per node.
In our workload examples, VMs are configured with runStrategy: Always meaning when the VM definitions are created the guest OS immediately starts booting. If desired, the runStrategy could be configured to only measure the VM container setup time without starting up the guest OS. In these kube-burner tests the VMIRunning measurements are reported in milliseconds when the VMI (VM Instance) object reaches Running phase which means the virt-launcher container has gone through the normal Pod startup steps, attached any requested resources (including storage PVCs), started up the qemu process, and the guest OS is starting to boot up.
While not directly covered here, in some cases it may also be desirable to test ssh access to VMs (ssh script examples are provided in the virt-clone upstream test), this method can vary based on the network attachment configuration. Another testing option to consider is adding workload startup commands in the VM cloudInit section to test a specific type of load.
Ephemeral Storage
To start with, we use the kube-burner-ocp virt-density test to measure the basic control plane component scalability using ephemeral containerDisk VMs which are mounted in each worker’s container storage space (most often the rootdisk), where the majority of the VM startup time is spent in container startup steps.
An example run command for this test case:
kube-burner-ocp virt-density --vms-per-node=100 --metrics-profile=/root/metrics-profiles/all-metrics.yml --vmi-ready-threshold=1200s --profile-type=regular --es-server=https://<user>:<pw>@<search>.com:443 --es-index=$index_name
The kube-burner-ocp tool evaluates the number of worker nodes and the --vms-per-node parameter to create 10,000 total VMs in a single namespace in this case. The metrics collected can be customized, the provided upstream example metrics profile is here.
In our test, the end results are summarized in the benchmark logs:
Job virt-density took 17m52s
So in this case the cluster was able to spin up 10,000 VMs using a containerDisk volume in under 18 minutes total. In the next section, we’ll go a bit deeper into VM deployment analysis using a more realistic VM configuration.
Persistent Storage - ODF
In the next test, VM startup latency includes the time needed to set up persistent storage attachments and clone a common source image for the VM boot drive. In these tests we’ve configured OpenShift Data Foundation to provide the StorageClass for VMs.
The aim of providing this example scenario is to give users the information needed to customize the kube-burner workload config in order to test any source image cloning patterns and specific VM definitions needed to evaluate the given cluster environment. Also see this more in-depth post about customizing kube-burner VM deployment workloads for more information.
For this customized test case we’ve again defined 10,000 total VMs across the cluster, this time backed by persistent storage and in this case each VM’s rootdisk is cloned from a "golden" source image, which is included in the final measurement. We chose to run VMs across 20 total namespaces, each namespace providing 1 VolumeSnapshot source image and 500 VMs per namespace clone that source PVC.
This repo provides the exact example configurations used: https://github.com/jeniferh/virt-dv-scale-density
This example defines the DataVolume (DV) inside the VM definition using the dataVolumeTemplates section of the VM spec. This means the DV follows the same lifecycle as the VM -- if you wish to separate out the DV lifecycle from the VM object itself, you can choose to create a standalone DV definition like the dv-clones.yaml example (note this is not used in the current workload config, only provided as an example). Also in this implementation, the workload config adds a 1 minute jobIterationDelay which means the tool will pause 1m in between each namespace creation (which the tool calls "iterations").
An example run command for this test case:
ES_INDEXING=true ES_INDEX=$index_name ES_SERVER="https://<user>:<pw>@<search>.com:443" ITERATIONS=20 OBJ_REPLICAS=500 kube-burner-ocp init -c dvvmclone.yml
Some measurement highlights from the benchmark output log from our cluster config:
Job virt-density took 2h28m54s
virt-density: VMIRunning 99th: 7286952 max: 7303650 avg: 5431755 (in ms)
So in about 2.5hrs we have 10,000 VMs started up after cloning the same source image for each rootdisk, across 20 different namespaces. Next, let’s take a deeper look at some of the cluster metric data during this deployment test.
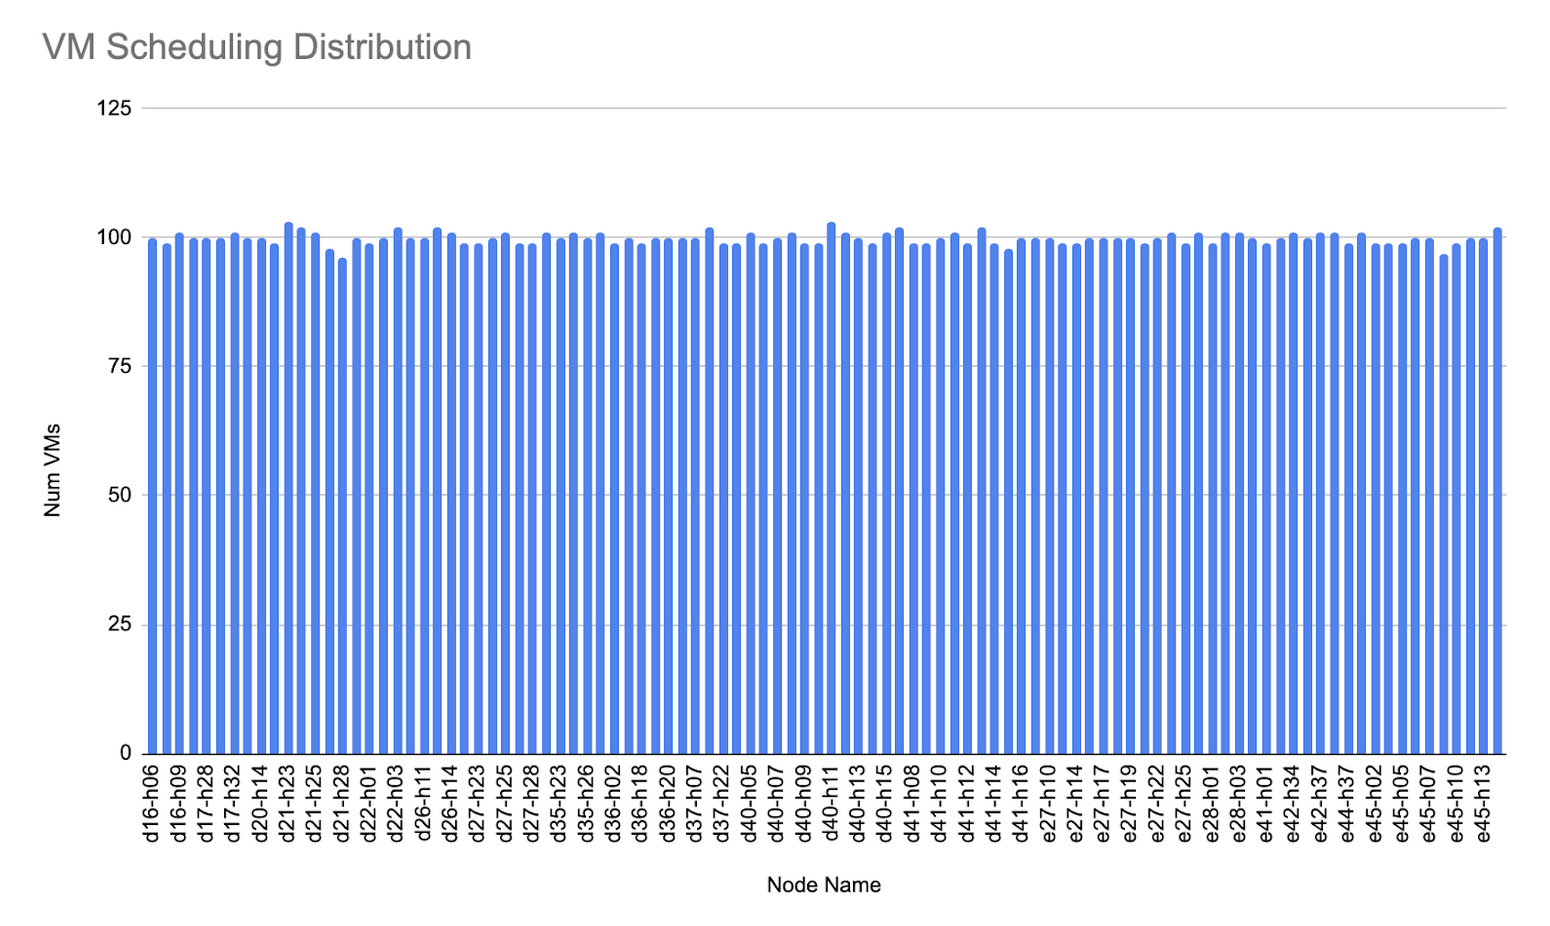
First, looking at the number of VMs running per node, the scheduling is fairly “balanced” across all 100 workers:
Control Plane Metrics
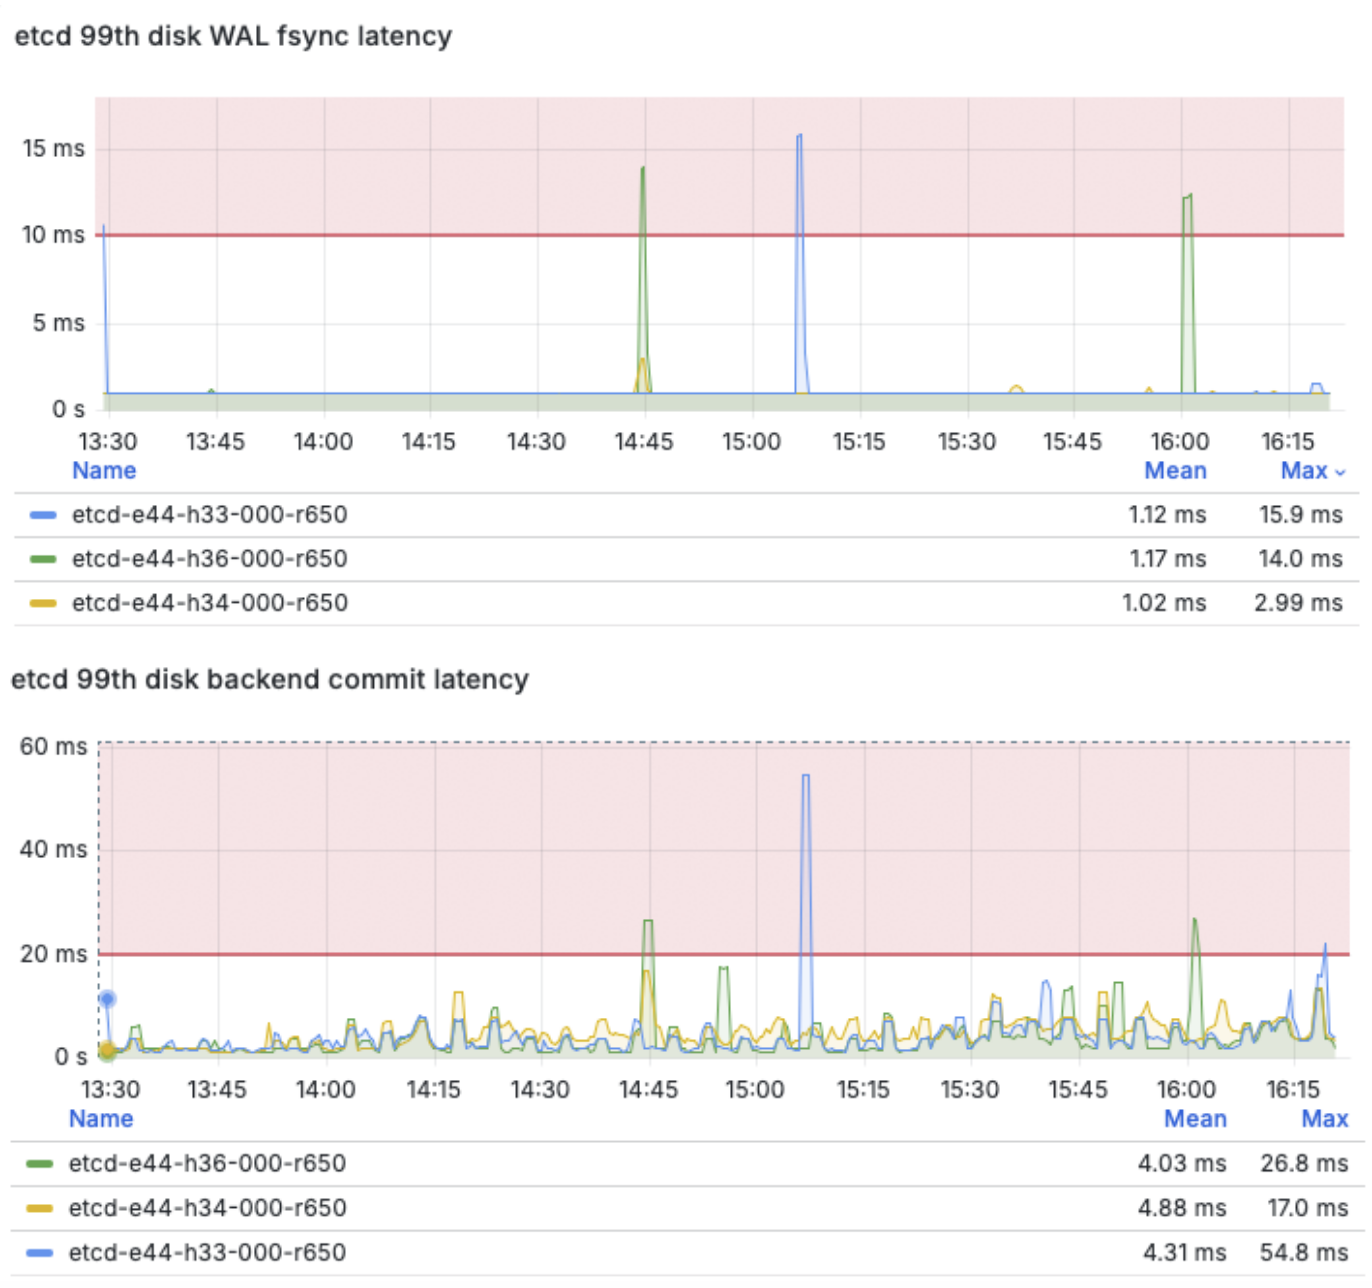
Looking at an etcd performance dashboard, during heavy deployment periods as DV clones were becoming ready and then VMIs were starting, we did slightly peak into higher fsync and commit latencies (see this article for more information on latency recommendations), however latencies remained stable for most of the test period. In this cluster configuration we have etcd pods running on sata SSDs, moving etcd storage to even faster local NVMe drives could be an optimization to consider for use cases with even higher control plane stress requirements.
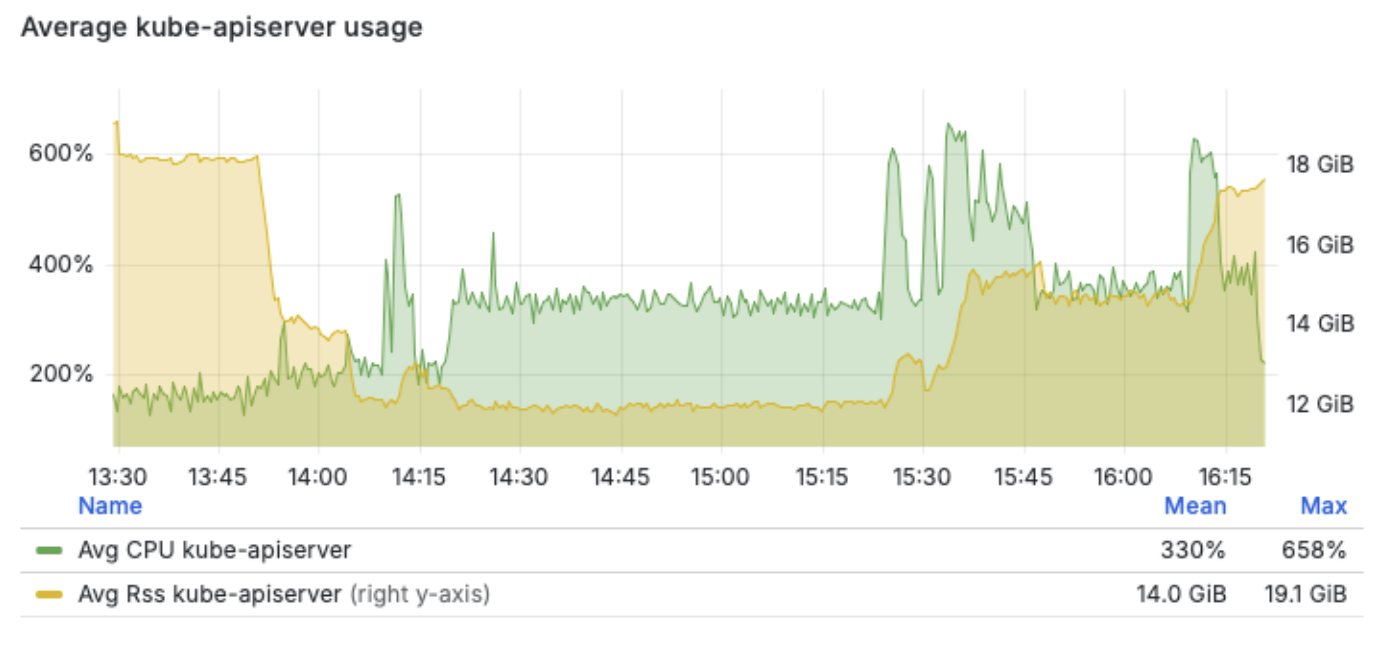
Looking at the cluster API server utilization, this test case peaked around 6.5 cpus and 19 GB of usage on the control plane nodes:
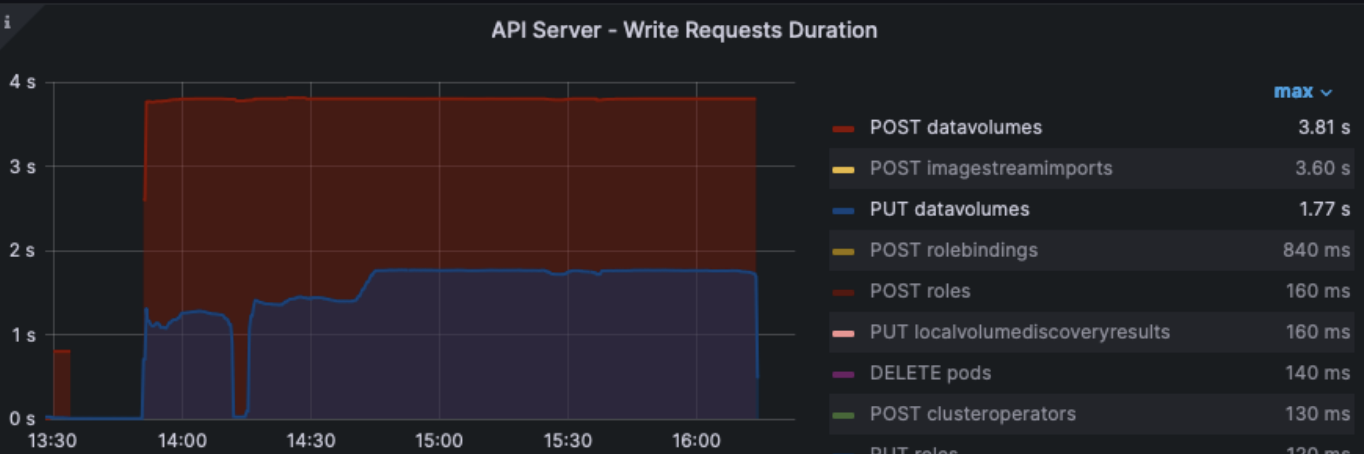
Also looking at the API server write request duration metric, we can see the Data Volume POST and PUT actions were the heaviest drivers of API write load:
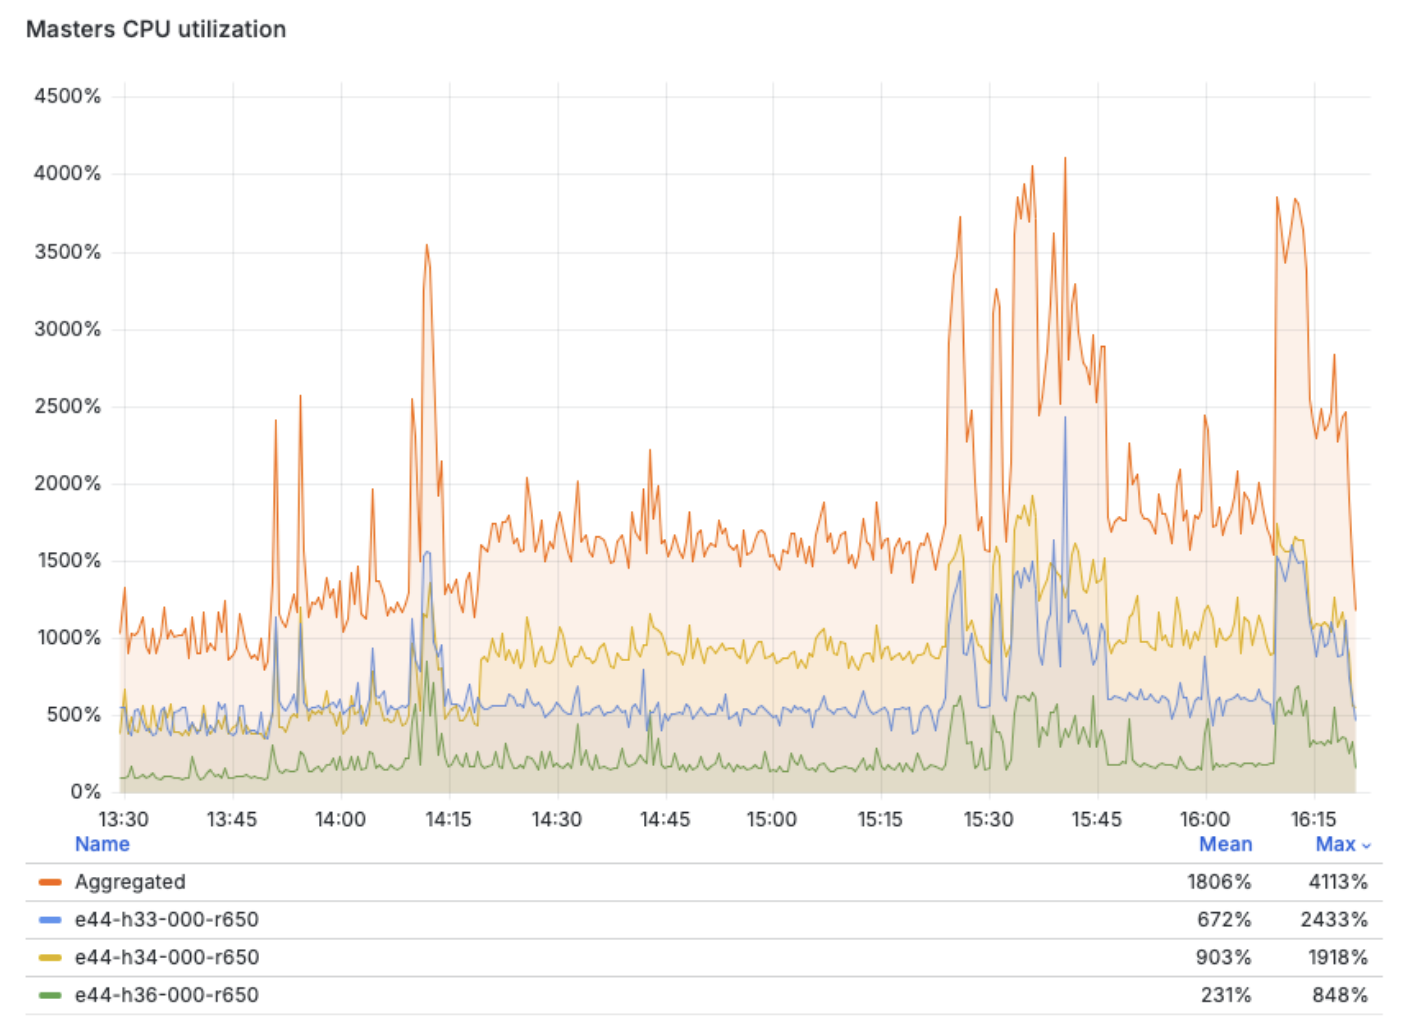
Master node utilization
Next we can see the overall control plane node utilization during the test period, with one node briefly peaking to 24 cpus utilized, but mostly staying under 10 cpus on average for this test case.
Virt Control Plane
Now digging into per-component usage, starting with the Virtualization control plane components, we can see most cpu and memory usage comes from the virt-controller component, peaking around 3 cpus and 6 GB worth of the master node usage.
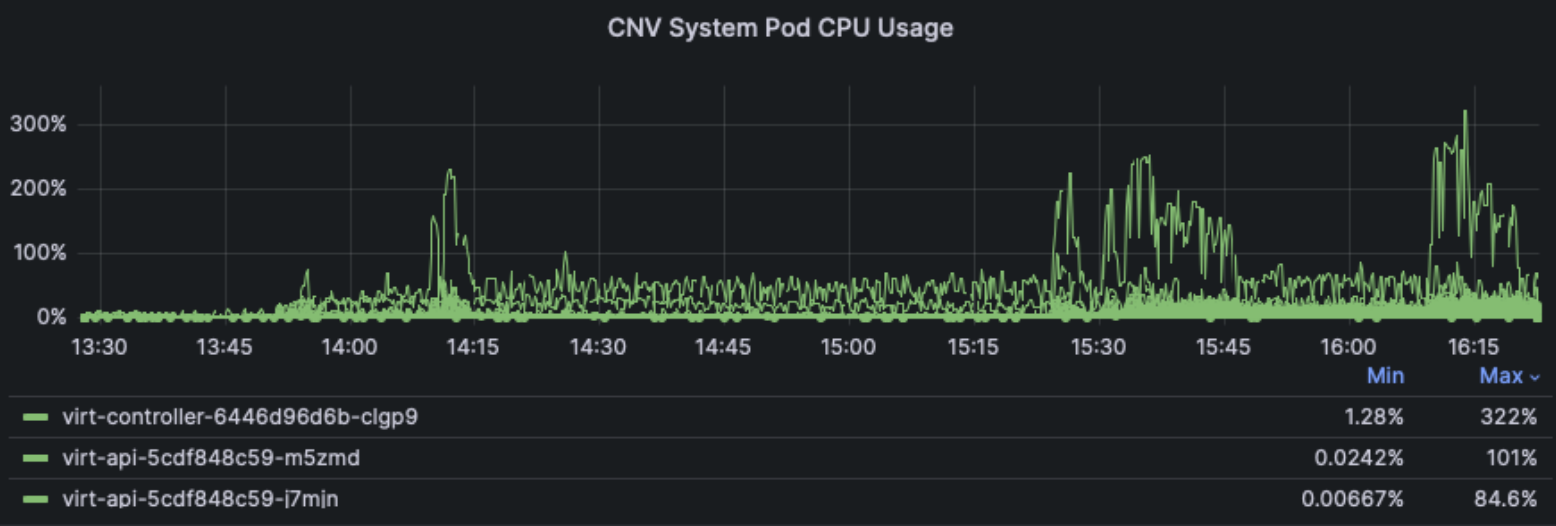
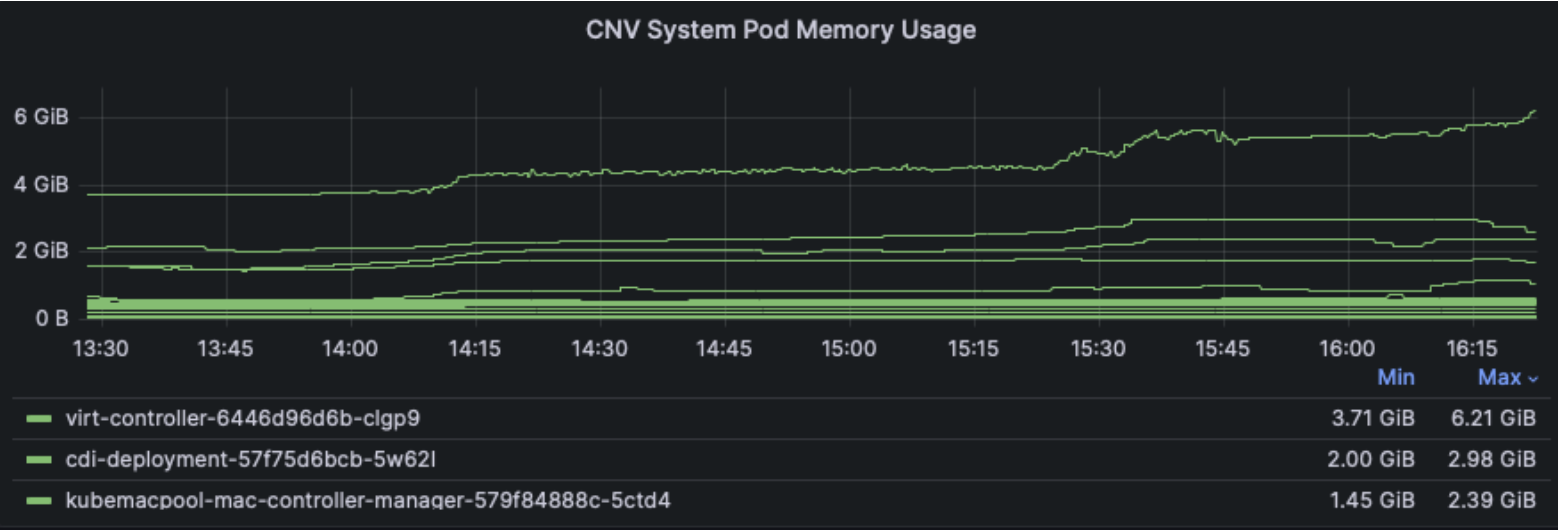
Note these dashboard panels are only displaying the top 3 components using resources, other Virt components like virt-handler and virt-operator used less cpu and memory.
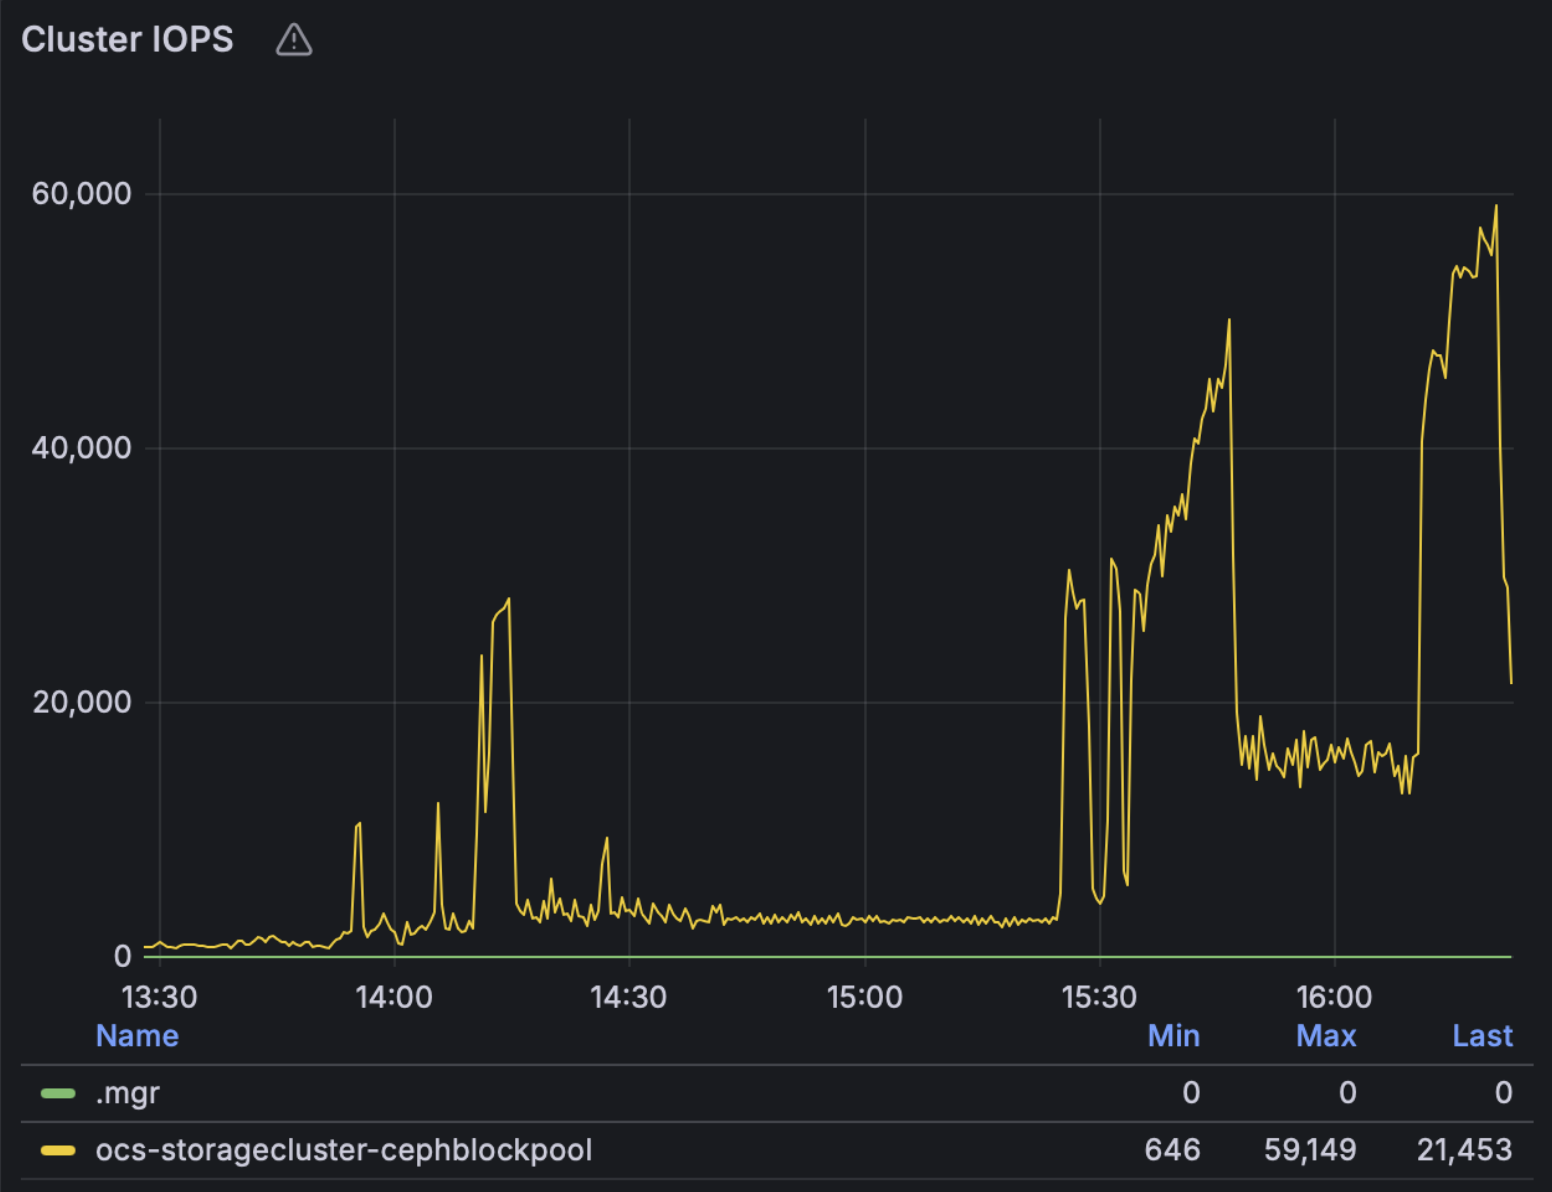
ODF Storage
Next, looking at the ODF storage dashboard metrics, we can see how Ceph CPU usage and IOPS change during the stages of the test, peaking once the VMIs are starting up in higher densities towards the last third of the test period, achieving around 60,000 total IOPS in this configuration:
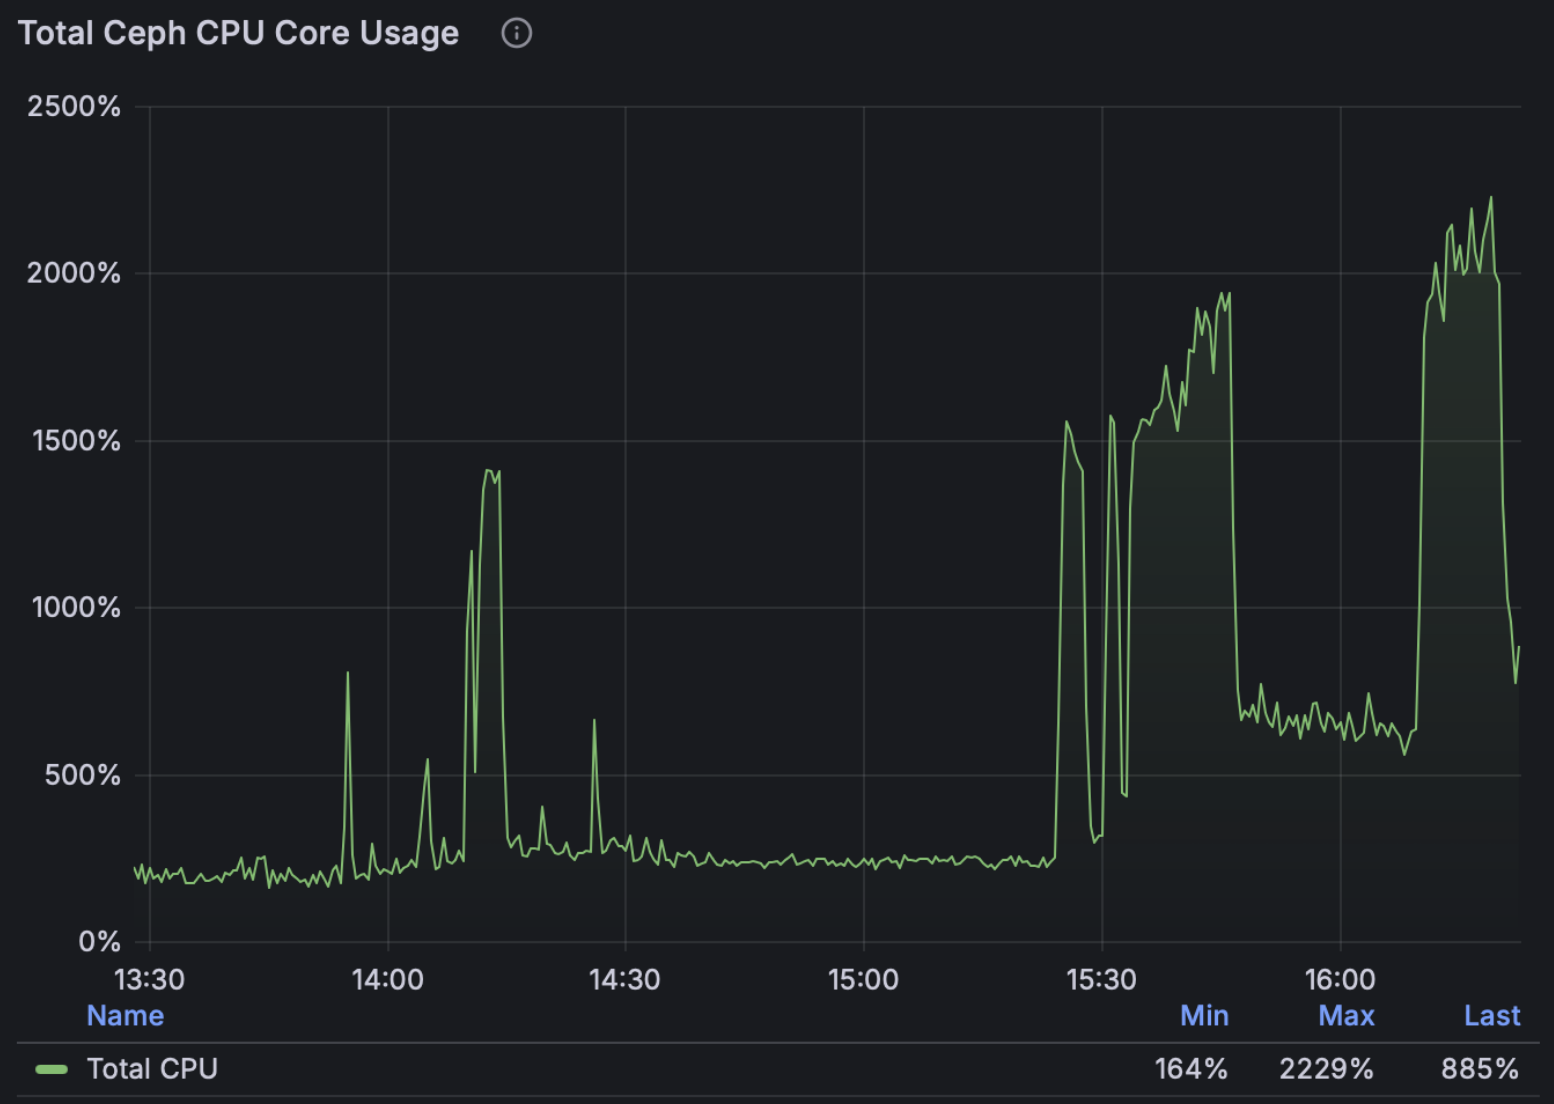
Note: These tests used the default ODF profile meaning each of the 99 OSDs were assigned 2cpus and 5Gi of memory, the total usage is shown in the graph above. For more I/O intensive environments, especially for very fast storage, admins can consider choosing the ODF “Performance profile” to increase the resources assigned to each OSD. Each of the 99 ODF worker nodes have 112 cpus, which are also used for VM workloads in this hyperconverged configuration.
Note that in this study we chose to use all default settings in terms of the OSD resource profile and auto scaling the pg count, however further performance tuning of the Ceph configuration is possible, both in terms of increasing the pg count for the Block pool and in terms of increasing the cpu and memory requests and limits of the OSDs, which can also be chosen at install time through the provided “Performance Profile” option -- we’ll leave these details for another writeup.
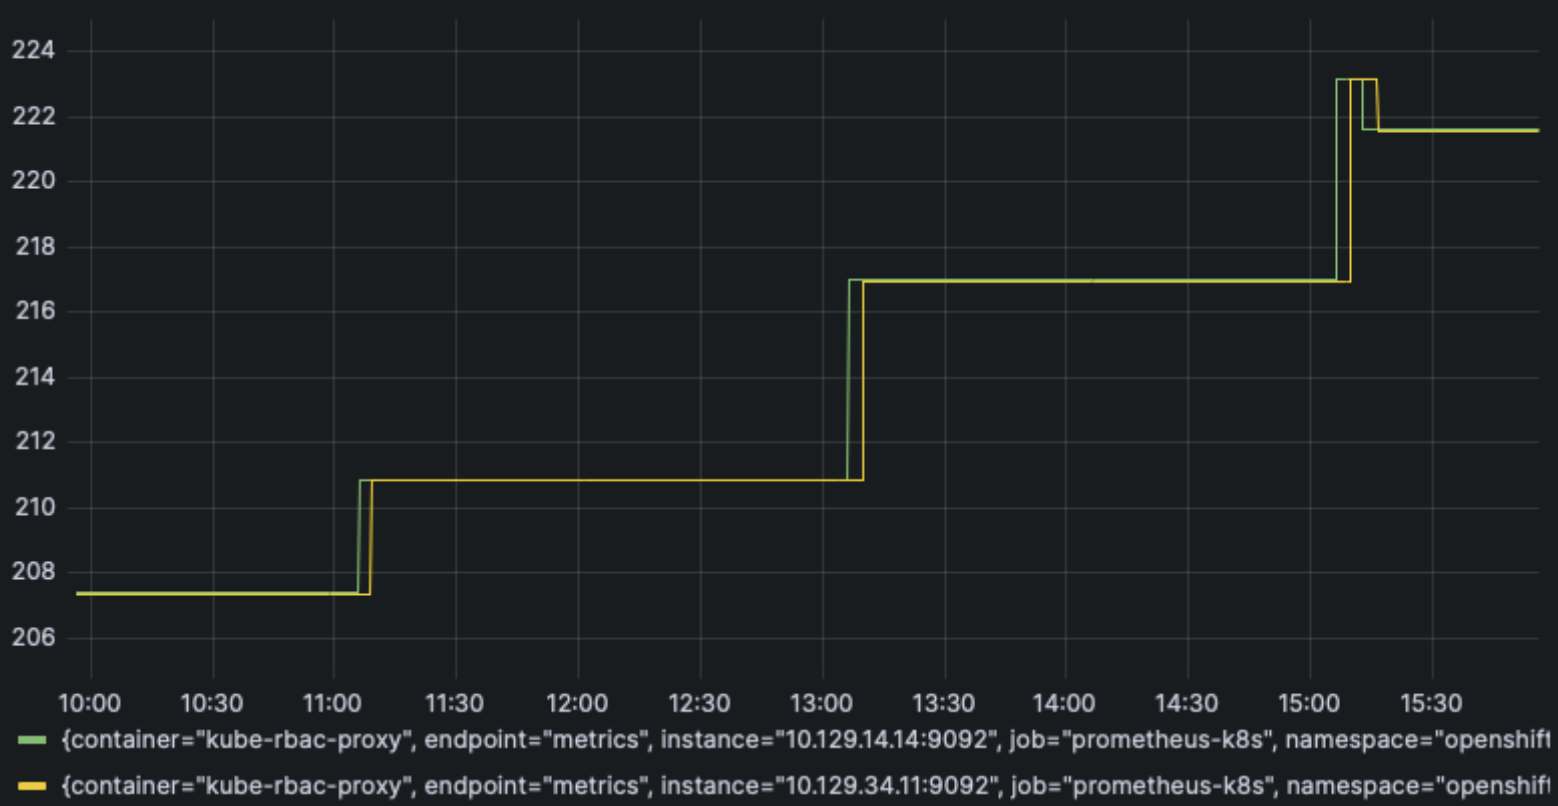
Cluster Monitoring
Finally, looking at Prometheus growth over the full 10,000 VM creation and deletion churn test period, we can see monitoring usage tops out at about 223 GB of storage and 47 GB of memory.
PromDB storage usage in GB:
prometheus_tsdb_storage_blocks_bytes / 1000 / 1000 / 1000
Prom pod memory usage in GB:
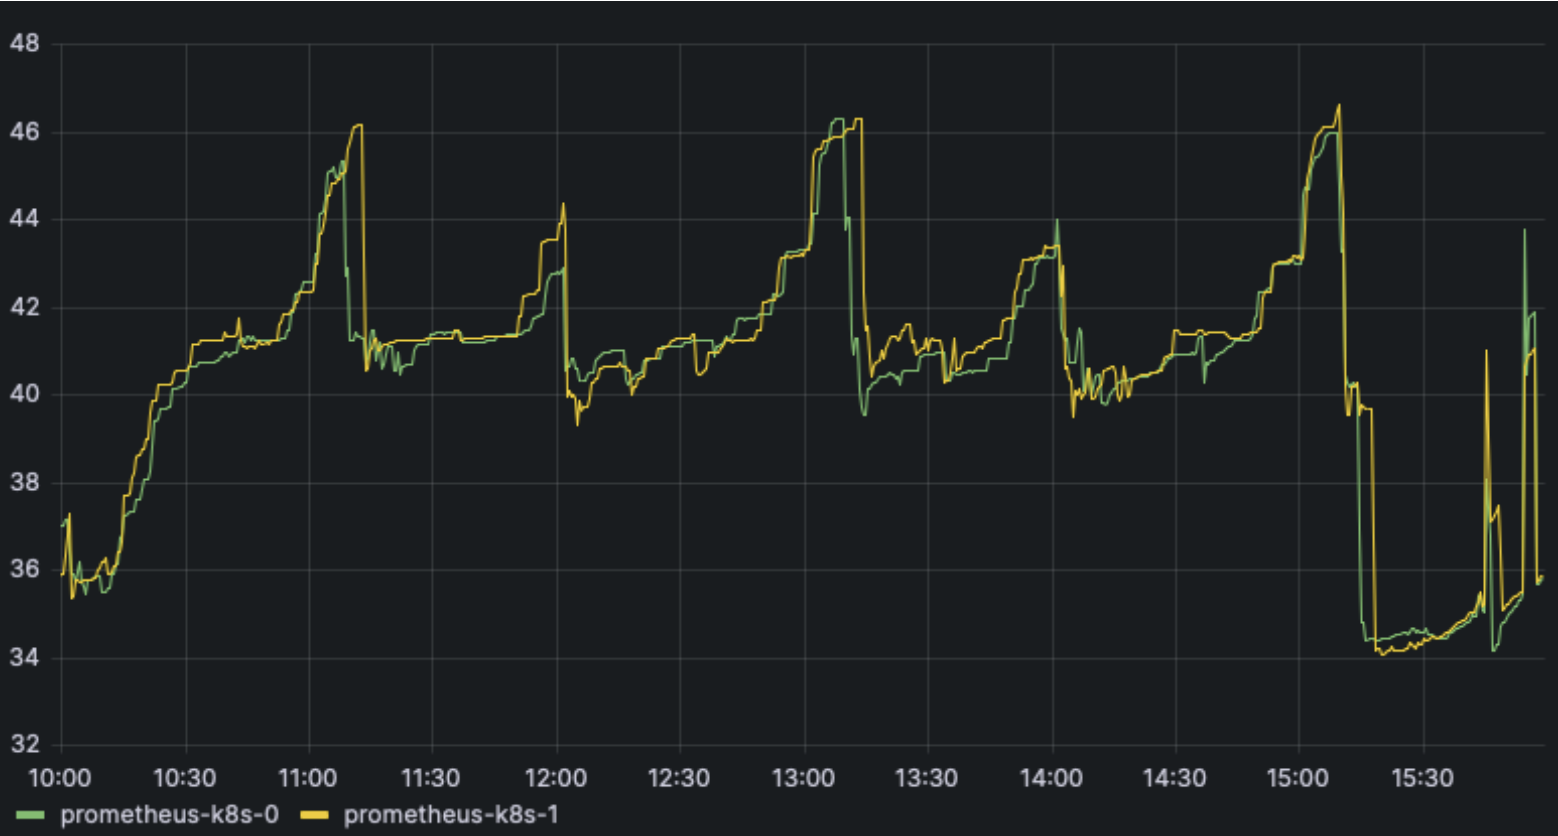
sum(container_memory_rss{container!="POD",container!="",pod!="",pod=~"prometheus-k8s-."}) by (pod) / 1024 / 1024 / 1024
Conclusion
In this blog we’ve described one area of VM density scale testing that helps us measure and find (and work with our Engineering teams to fix!) any OpenShift Virtualization scaling problems. Stay tuned for future examples covering other testing areas in more detail, we’ll continue to provide adaptable workload examples that can be customized for your environment’s testing needs.