OpenShift Container Platform comes equipped with a powerful, pre-configured monitoring stack, built on the robust foundation of Prometheus and AlertManager. This allows cluster administrators to keep a close eye on the health and performance of core platform components, and even extend monitoring to user-defined projects. Let's break down the essentials.
OpenShift Monitoring: A Quick Overview
OpenShift's monitoring stack provides out-of-the-box visibility into your cluster's vital signs. It leverages key components like:
- Prometheus: The heart of the system, storing time-series data and evaluating rules.
- Alertmanager: Handles alerts from Prometheus, routing them to various notification systems.
- Metrics Server: Collects resource metrics, making them available through the metrics.k8s.io API.
- kube-state-metrics: Converts Kubernetes objects into metrics for Prometheus.
- and others!
This stack monitors crucial targets, including:
- CoreDNS
- etcd
- HAProxy
- Kubernetes API server
- And many more...
This comprehensive monitoring enables administrators to quickly identify and address potential issues, ensuring the stability and reliability of the OpenShift cluster.
OpenShift Monitoring Architecture
As you can see from the next diagram, OpenShift's monitoring architecture is structured into two primary components: default platform monitoring and user-defined project monitoring.

During installation, core cluster components, including Kubernetes services, are automatically monitored through a set of platform components deployed within the openshift-monitoring project, which also enables remote health monitoring.
For user-defined projects, once enabled, additional monitoring components are installed in the openshift-user-workload-monitoring project, extending monitoring capabilities to applications and services deployed by users.
Alerting and Notifications: Keeping You Informed
OpenShift's alerting capabilities are designed to keep you informed about critical events. Alertmanager plays a central role in this, allowing you to configure how alerts are routed and delivered. You can configure various alert receivers for different types of alerts.
One of the most powerful features is the ability to configure webhooks for alert notifications. This allows you to integrate OpenShift alerts with external systems and services, automating responses and workflows.
What types of alerts can we expect, and what format do the notifications follow?
We will leverage a small application for receiving and storing the OpenShift Monitoring's Alerts.
Building a Webhook Notification Receiver: A Simple Webhook Logger
When configuring webhooks for alert notifications, it's crucial to understand the structure of the incoming webhook payload. This is where our small project comes in.
To facilitate the development and testing of our real webhook notification receiver, I created a simple application that captures incoming webhooks and saves them as JSON files. This allows us to:
- Inspect the structure and content of the webhook payload.
- Develop and test any existing notification receiver we may have in our company.
The application is a lightweight HTTP server that listens for incoming POST requests. When a webhook is received, it extracts the JSON payload and saves it to a file with a unique timestamp.
The Application's core is less than 40 lines of Python code using the Flask, a lightweight web framework that enables developers to build web applications quickly and easily, you can see a small extract in the next code block:
@app.route('/webhook', methods=['POST'])
def webhook():
    try:
        data = request.get_json()  # Get the JSON data from the request
        now = datetime.now()
        date_str = now.strftime("%Y%m%d-%H%M%S")  # Format: YYYYMMDD-HHMMSS
        unique_id = uuid.uuid4()
        filename = f"{date_str}-{unique_id}.json"
        filepath = os.path.join(WEBHOOK_DIR, filename)
        # Write the JSON data to a file, formatted for readability
        with open(filepath, 'w') as f:
            json.dump(data, f, indent=4)  # indent=4 for human-readable formatting
        return jsonify({"message": "Webhook received and saved successfully"}), 200
    except Exception as e:
        return jsonify({"error": str(e)}), 500
You can find the full Application code in the Github repository I created here: https://github.com/alezzandro/webhook-store.
This approach provides a convenient way to analyze the webhook data and ensure that our receiver is prepared to handle it correctly.
We are now ready to deploy it on our OpenShift cluster! Let's see how in the next section.
Install the Python WebHook Receiver in our OpenShift cluster
The Github repository of the application project is ready to be deployed on OpenShift, leveraging the Application Template's mechanism offered by the platform as a service layer.
Let's first create an OpenShift project for this application:
$ oc new-project webhook-storeThen we can launch the application build and the Kubernetes resources' configuration by creating an OpenShift Application:
$ oc new-app --name=webhook-store --labels="application=webhook-store-app" python:3.9-ubi9~https://github.com/alezzandro/webhook-store You can monitor the application deployment process by looking at the BuildConfig / Builds elements and at the Pods running in the Project.
Finally let's expose the Service through the OpenShift's Ingress Controller (we are creating a Route object):
$ oc expose service webhook-store -l application=webhook-store-app --name=webhook-storeIf the application's deployment completed successfully you should see something similar in your OpenShift Topology View:
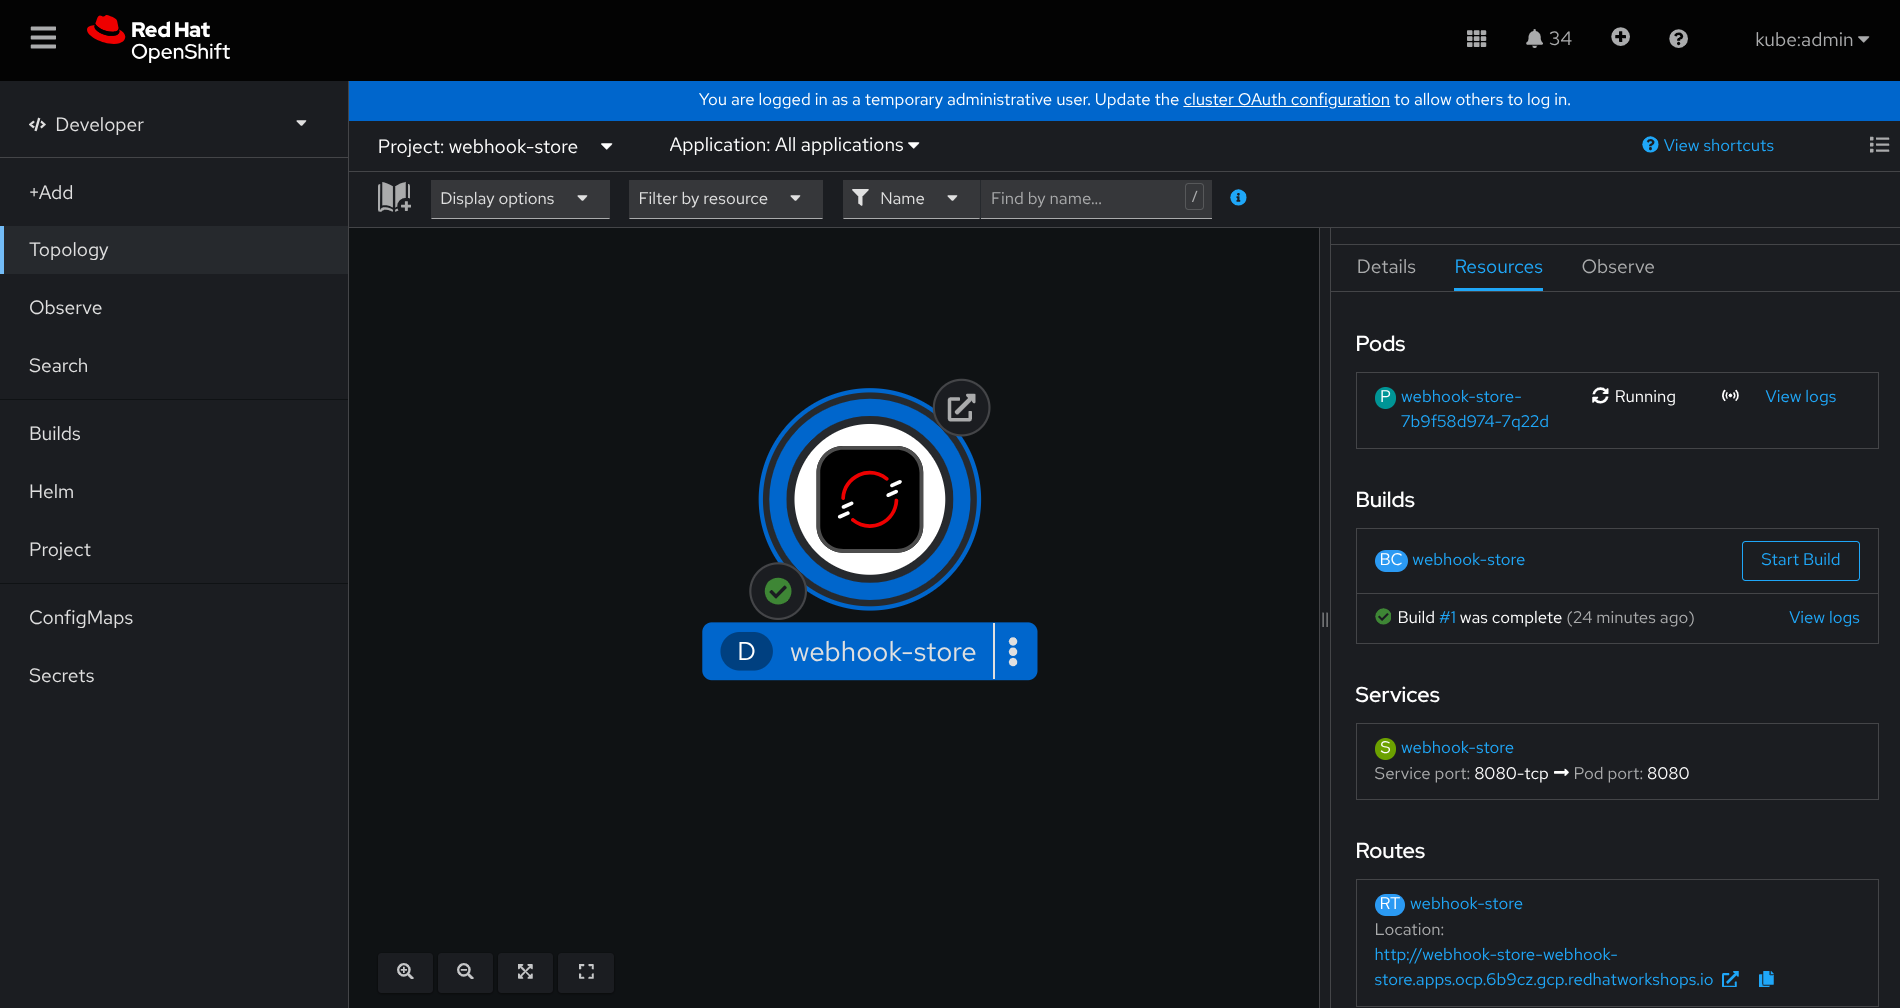
That's all, you can test if the service is working properly by contacting the Route URL we just created also with a simple curl command.
Don't forget to copy the URL: We are going to configure the AlertManager forwarder/receiver in the next section!
Please note: these steps don't require administrative privileges.
OpenShift Monitoring's AlertManager Configuration
Now that our application is started on the OpenShift cluster we can configure the AlertManager notification configuration to actually forward to our WebHook Store application any new Alert.
We can navigate through the OpenShift Web Console to configure the webhook receivers in the respective section.
First of all let's connect with administrative privileges, then let's navigate through the left bar in Administration -> Cluster Settings, then let's click on the Configuration tab as shown in the screenshot below:

After that we need to click on the AlertManager element that we can find in the list.
In the AlertManager's details page, we should see the list of the default receivers, as shown in the next screenshot:
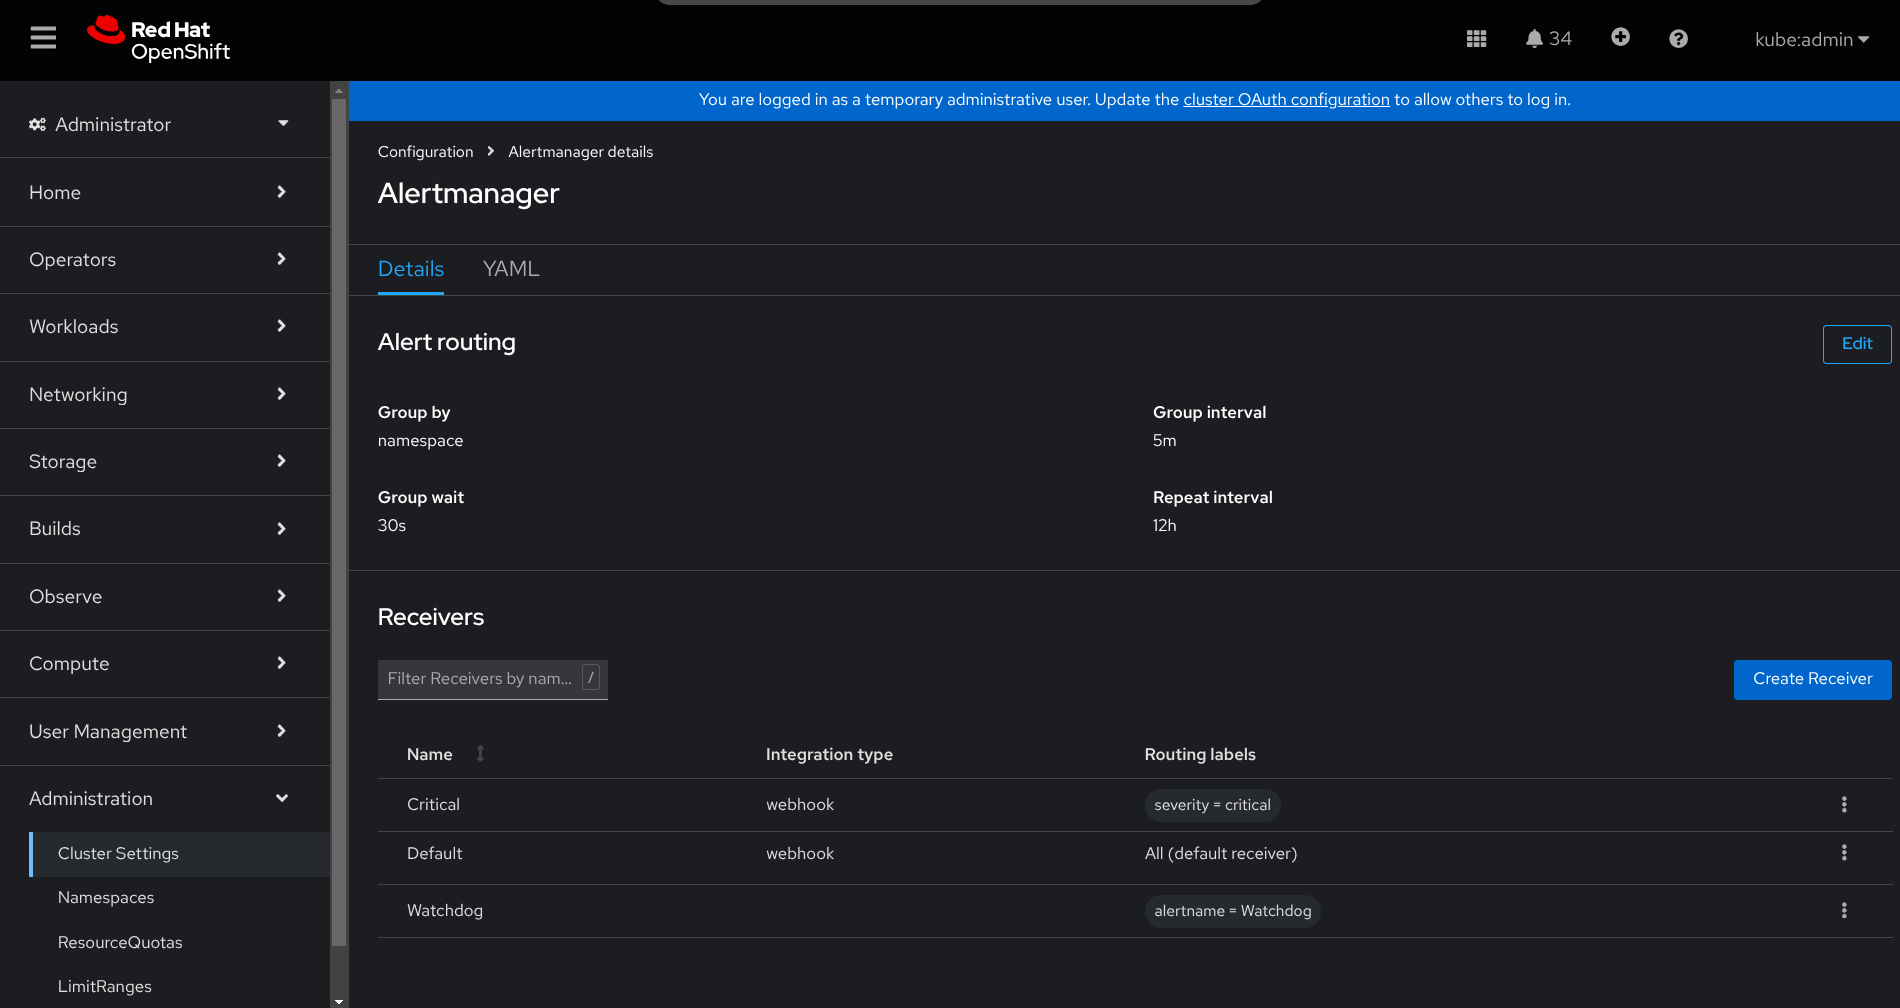
We can now edit the Default receiver (or even both) for forwarding any new Alert to our WebHook Store application.
As you can imagine and as you can see for the Routing Labels column, the Default receiver is actually getting all the Alerts, while the Critical one is just receiving the critical Alerts.
Clicking the edit button in the right menu, you should see something similar to the next screenshot:
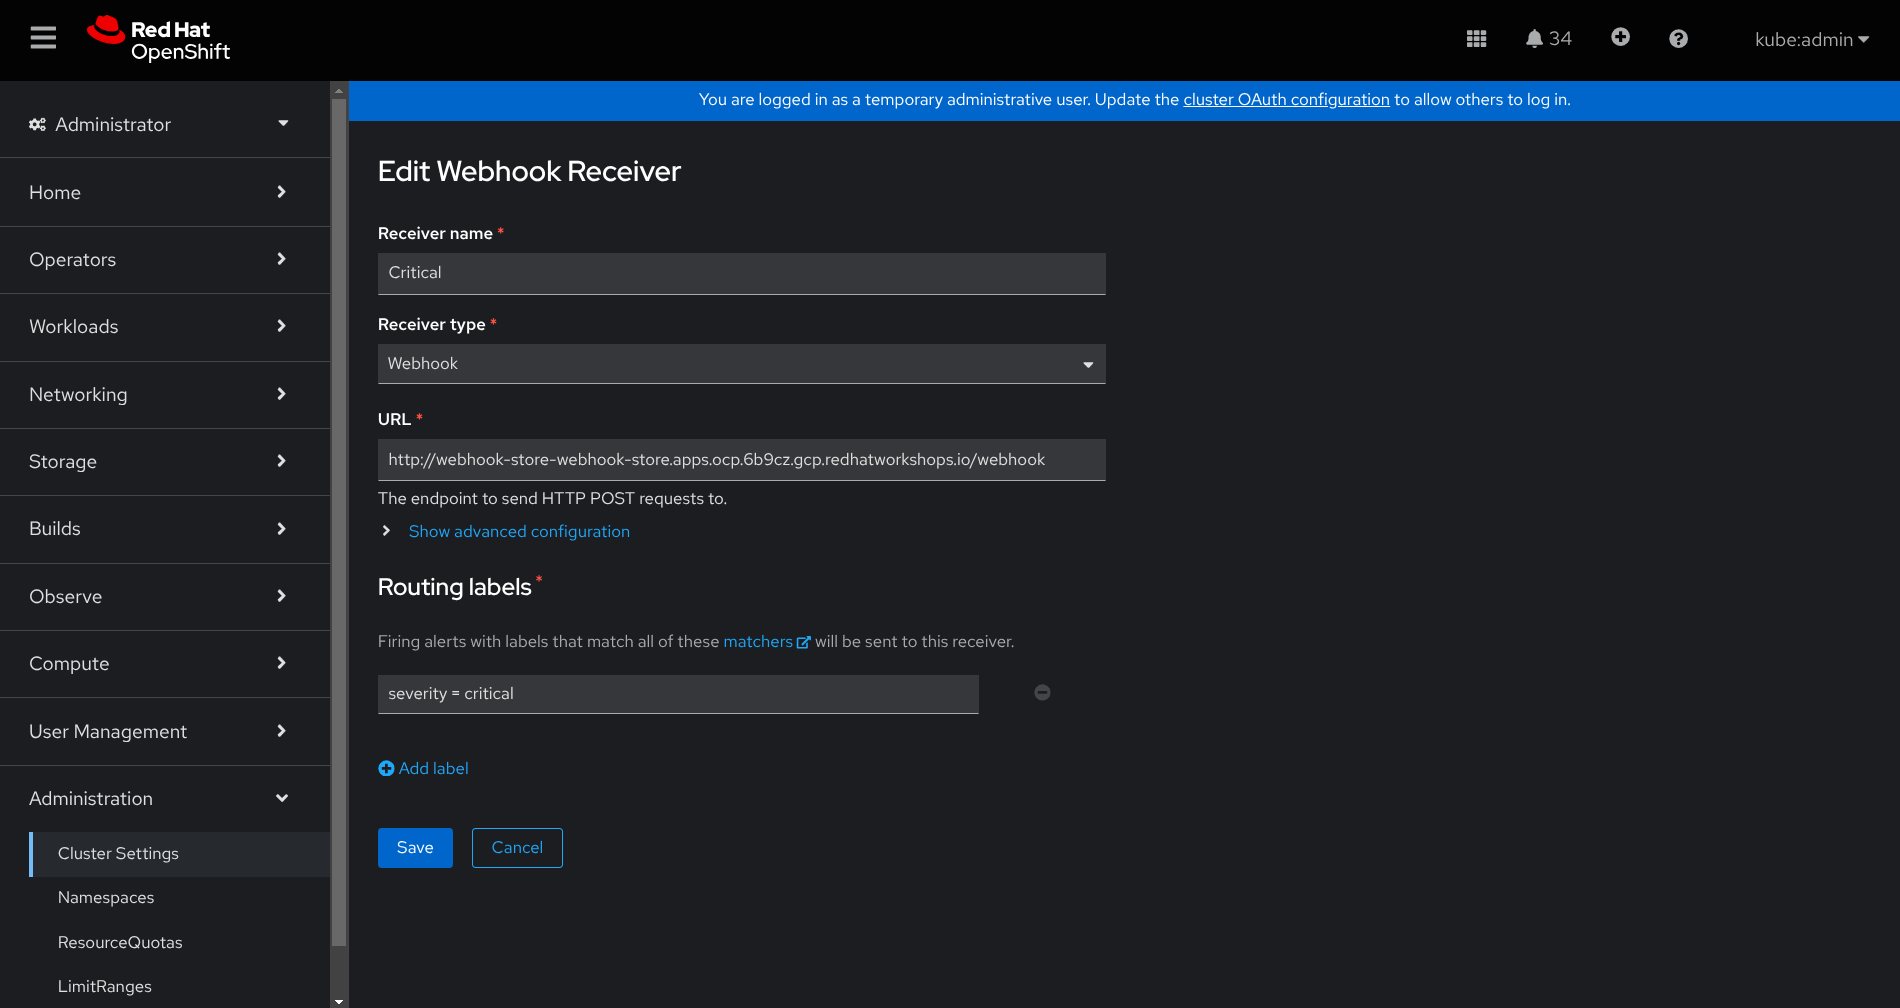
As you can see from the previous screenshot we have a URL field in which we should paste our WebHook receiver endpoint. Don't forget to include the /webhook subpath in your URL!
You can also take a look to the OpenShift Documentation page available here.
Are you ready to test the webhook notification then?
Testing the WebHook Store application with new incoming Alerts
There are several way to actually test the Notification Alerts we just configured.
If you are in a development / test cluster, for getting some real data you could try to shutdown one of the master and one of the worker nodes (in case you have enough machines to let the cluster survive the fault!).
Consider also that the application does not request or mount any PersistentVolume, it just writes in a unique JSON file the webhook received in the /tmp/webhooks folder. For checking the current Alerts notification save you may want to jump directly in the WebHook Store running container through the OpenShift Web Console section.
Alternatively you can leverage the command line tool "oc":
$ oc project webhook-store
$ oc rsh webhook-store-YOUR-ID
For copying the saved JSON files out from your running container, again you could leverage the "oc" command line tool as shown in the next code block:
$ oc rsync webhook-store-YOUR-ID:/tmp/webhooks/ .That's all you are now ready to start working with Alert Notifications in your OpenShift cluster. But in case you want a preview of what kind of of alerts we can expect, and what format the notifications follow you can take a look in the webhook-examples directory in the WebHook Store Application Gihub repository!
This is an example of the Notification Alert you should get:
{
    "receiver": "Default",
    "status": "firing",
    "alerts": [
        {
            "status": "firing",
            "labels": {
                "alertname": "TargetDown",
                "job": "etcd",
                "namespace": "openshift-etcd",
                "openshift_io_alert_source": "platform",
                "prometheus": "openshift-monitoring/k8s",
                "service": "etcd",
                "severity": "warning"
            },
            "annotations": {
                "description": "33.33% of the etcd/etcd targets in openshift-etcd namespace have been unreachable for more than 15 minutes. This may be a symptom of network connectivity issues, down nodes, or failures within these components. Assess the health of the infrastructure and nodes running these targets and then contact support.",
                "runbook_url": "https://github.com/openshift/runbooks/blob/master/alerts/cluster-monitoring-operator/TargetDown.md",
                "summary": "Some targets were not reachable from the monitoring server for an extended period of time."
            },
            "startsAt": "2025-02-28T12:12:19.03Z",
            "endsAt": "0001-01-01T00:00:00Z",
            "generatorURL": "https://console-openshift-console.apps.ocp.example.com/monitoring/graph?g0.expr=100+%2A+%28%281+-+sum+by+%28job%2C+namespace%2C+service%29+%28up+and+on+%28namespace%2C+pod%29+kube_pod_info%29+%2F+count+by+%28job%2C+namespace%2C+service%29+%28up+and+on+%28namespace%2C+pod%29+kube_pod_info%29%29+or+%28count+by+%28job%2C+namespace%2C+service%29+%28up+%3D%3D+0%29+%2F+count+by+%28job%2C+namespace%2C+service%29+%28up%29%29%29+%3E+10&g0.tab=1",
            "fingerprint": "22578b8bd796282b"
        }
    ],
    "groupLabels": {
        "namespace": "openshift-etcd"
    },
    "commonLabels": {
        "namespace": "openshift-etcd",
        "openshift_io_alert_source": "platform",
        "prometheus": "openshift-monitoring/k8s",
        "severity": "warning"
    },
    "commonAnnotations": {},
    "externalURL": "https://console-openshift-console.apps.ocp.example.com/monitoring",
    "version": "4",
    "groupKey": "{}:{namespace=\"openshift-etcd\"}",
    "truncatedAlerts": 0
}
As you can see it a well formatted JSON containing one or multiple Alerts. For further information you can also take a look to the AlertManager's docs available here.
Conclusion
OpenShift's monitoring and alerting capabilities provide a powerful toolkit for ensuring the health and stability of your cluster. By leveraging webhooks, you can integrate OpenShift alerts with external systems and automate responses. The simple application described in this post provides a practical approach to developing and testing your webhook notification receiver, ensuring that your existing tools will be ready to handle real-world alerts coming from OpenShift Container Platform.