Wait... what?
I was involved in diagnosing a production system performance problem: a web application serving thousands of interactive users was acting up. Symptoms included significant time running kernel code on behalf of the application (unexpectedly), and at those times substantial delays were observed by end users.
As someone with a systems programming background, I figured I had a decent shot at figuring this one out. Naively I reached for strace(1), the system call and signal tracer, to provide insights (this was long before perf(1) came along, in my defence).
Firing up strace, however, things rapidly went from bad to oh-so-much-worse, with the application becoming single threaded and almost entirely locking up under ptrace(2) control. Nothing was able to return responsiveness once that flat spin had been induced. Sadly an unscheduled downtime resulted, and I wandered off to lick my wounds, wondering what on earth just happened.
Why?
Without going into the details of what actually happened, nor the weird and wonderful things that are going on under the hood inside strace - suffice to say this was a pathological scenario and strace was certainly the wrong tool for the job. Hindsight is 20/20!
However, lesson learned - and it's not only strace of course - there are many analysis tools which take the behavior modifying approach of "switch on special/new code paths, export lots of special/new diagnostics" that can make production system failure situations far, far worse.
The kernel and many system services provide a wealth of always-enabled instrumentation, and in my experience it provides good return on investment when business-critical applications to do the same. Knowing that counters, gauges and other measures are always there, always updated, and - ideally - always being sampled and recorded, builds high levels of confidence in their safety and at acceptable (known, fixed, low) costs.
How?
There are many different projects and APIs for instrumenting applications, with a variety of different design goals, trade-offs and overheads. Many articles have been devoted to the sorts of things worth instrumenting within an application, so lets skip over that (extremely important!) topic here and instead focus on underlying mechanisms.
One thing to note first up is that all the approaches require some form of inter-process communication mechanism, to get the metric values out of the application address space and into the monitoring tools - this can involve varying degrees of memory copying, context switching, synchronization and various other forms of impact on the running application.
In the Performance Co-Pilot (pcp.io) toolkit the MMV - "Memory Mapped Value" - approach tackles this issue of providing low-cost, lightweight metric value extraction from running applications.
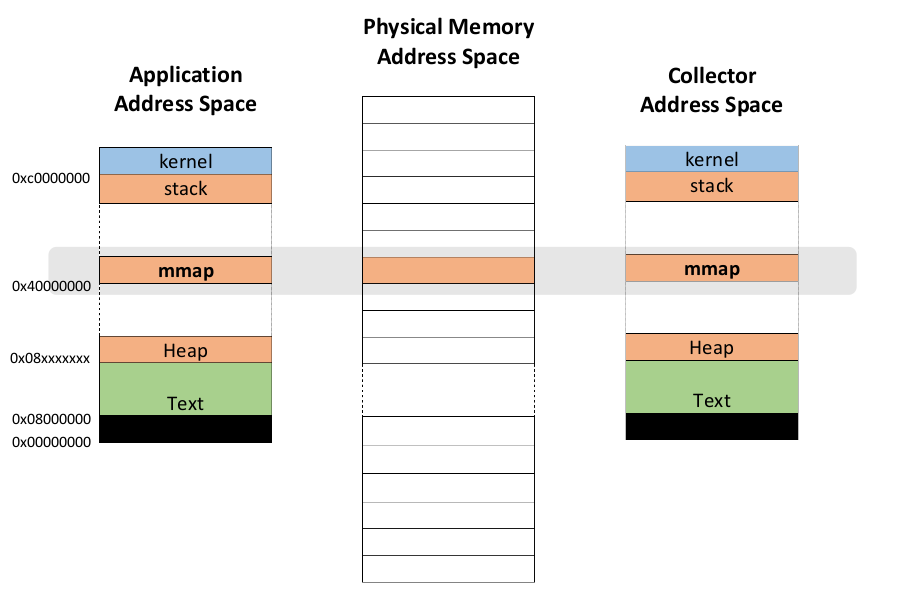
The approach is built around shared memory, where the application registers metrics and is assigned fixed memory locations for the safe manipulation of each metric value. The application is then left to update each in-memory value according to its needs and the semantics of each metric.
The memory locations are allocated, and fixed, in such a way that they can also be safely accessed by separate (collector, monitoring and/or analysis) processes. Naturally, the overheads of actually counting events, accumulating byte counts, gauging utilization and so on cannot be removed, but the goal is to make that the only cost incurred.
In the MMV model, at the points where metrics are updated, the only cost involved is the memory mapping update, which is a single memory store operation. There is no need to explicitly transfer control to any another thread or process, nor allocate memory, nor make system or library calls. The external PCP sampling process(es) will only sample values at times driven by those tools, placing no overhead on the instrumented application.
The other good news is the MMV approach scales well as metrics are added; applications with many hundreds of metrics are able to update values with the same overheads as lightly instrumented applications.
On the other hand, to attain this level of performance there are trade-offs being made. Its assumed that always-enabled sampling is the analysis model (so this technique is not suited to event tracing, which is more the domain of complementary approaches like dtrace, ETW, LTTng and systemtap). So it is not suited for compound data structures. But for the kinds of performance values we're looking at here, where each metric is usually an independent numeric value, this proves to be a worthwhile trade-off in practice for always-enabled instrumentation.
Where? When?
All Red Hat Enterprise Linux releases since 6.6 onward include MMV as an instrumentation approach you can use. Sample instrumented application code is available in the pcp-devel package.
The service involved with reading the memory mappings is pmcd(1) and its pmdammv(1) shared library helper. Many PCP tools exist that will record, visualize, infer and report on your new application metrics.
High-level language projects that generate MMV mappings natively (Speed for Golang, and Parfait for Java) are also available from Github and Maven Central.
Last updated: March 16, 2023