This article will detail the performance and scale validation of the combined Telco Core Reference Design Specification (RDS) and a data plane (DP) workload deployed on Red Hat OpenShift Container Platform 4.20. We will compare the performance impact on three distinct networking configurations in the DP workload: OVN-Kubernetes (OVN), MACVLAN, and SR-IOV. We'll also vary the control plane (CP) workload churn to determine the impact in DP and the most stable configuration for telco-grade environments.
Our evaluation simulated a highly dynamic environment by churning full namespaces in the CP workload at varying rates (0% up to 100%) and trying to detect impact on the DP workload.
Summary of results
The primary goal was to test the cluster’s stability and data plane performance while the CP workload was actively churning namespaces. The results demonstrated clear differences in throughput and resource consumption across the tested networking interfaces.
As expected, SR-IOV and MACVLAN delivered the highest and most consistent data plane throughput (98.6% and 93.9% respectively) of the theoretical maximum, with minimal impact from control plane churn.
On the other hand, OVN-K showed the lowest throughput (88 to 89% of the theoretical maximum) and the most significant performance degradation (drop to 81% — during 100% churn) as it shared the same NIC with the CP workload.
Across all groups, etcd and the API server latencies generally remained within acceptable KPI ranges. However, P99 pod readiness latency, which is the time between pod creation and pod “ready” state, increased significantly in OpenShift Container Platform 4.20 when compared to OpenShift Container Platform 4.16.
The DP-OVN configuration showed the greatest impact on control plane’s CPU of selected components, such as control plane and worker nodes, etcd and API server, while DP-MACVLAN and DP-SR-IOV exhibited more modest resource overhead.
Background and key concepts
The Telco Core RDS cluster use model is designed to host large-scale telco applications on commodity hardware. These applications include a mix of workloads with varying demand levels of performance and complex networking support.
We can break down the application functions into two main types (Figure 1):
- Control plane (CP): Signaling, aggregation, and session border controller (SBC)
- Centralized data plane (DP): 5G user plane functions (UPF)

These functions require scalability, complex networking support, and resilient software-defined storage. Networking requirements for these functions vary, ranging from high-throughput, low-latency applications that require user-plane DPDK networking to typical cloud-native functions which rely on OVN-Kubernetes and standard kernel networking.
To accommodate these diverse needs, worker nodes are segmented with MachineConfigPool custom resources (CRs) and a customized PerformanceProfile, allowing for specialized roles for non-user data plane or high-throughput use cases. To emulate these functions and their networking requirements, we implement them in our performance and scale tooling and collect several relevant control and data plane metrics.
Key performance metrics for Telco Core RDS
Key performance indicators (KPIs) for the Telco Core Reference Design Specification (RDS) focus on control plane scalability and resilience as well as data plane performance under telco-grade operational patterns. While we look at a wider range of KPIs in our performance and scale engineering efforts, we include the following subset of KPIs in this article, due to their criticality when churning namespaces:
- Stable etcd and API server CPU and memory utilization
Etcd and API server are directly affected by churning. etcd CPU and memory utilization reflect the cost of maintaining cluster state consistency, while API server resource consumption reflects the cost of validating, serving, and distributing that state. For instance, etcd can have a write amplification caused by churn (object creation, updates, and deletions), where the API server is the front door to the cluster and mediates all reads and writes to etcd. High CPU pressure can increase the API server latency and backpressure to other control plane components, e.g., kubelet, whereas, in etcd, CPU pressure increases commit latency and it impacts the API server.
- Predictable API-Server latencies (Read-Only and Mutating)
Unpredictable read latency typically manifests as delayed query responses to the cluster and indicates control-plane saturation. Unpredictable mutating latency, on the other hand, results in slow pod creation, delayed namespace deletion, and cascading reconciliation effect.
- Bounded etcd latencies (WAL, backend, and RTT)
Maintaining bounded latencies across etcd is essential to ensure consistent API server behavior and overall control-plane stability. WAL, backend, and RTT latencies are additive in the critical path of a write operation. Degradation in any of these dimensions increases the overall commit latency and propagates directly to the API server mutating latency.
- Consistent pod readiness latency
This is the elapsed time between the pod creation and the point at which the same pod transitions to the ready state, indicating that the workload is fully initialized, network-attached, and able to serve traffic.
We think that these KPIs capture and ensure that the OpenShift Container Platform platform maintains a deterministic behavior, availability, and performance at scale telco environments.
Testing methodology and workloads
In this section, we will describe hardware configuration. Tests were conducted on the Intel CascadeLake compute node with Dell R640 server, with NIC : Intel Corporation Ethernet Controller XXV710 for 25GbE SFP28.
We executed validation on a Telco Core RDS-conform cluster with OpenShift Container Platform 4.20 release. To compare our local cluster configuration with the reference, we used oc cluster-compare. Having this initial configuration applied, the cluster was configured to run a combination of two primary workloads:
- Control plane (CP) workload: Implemented with kube-burner-ocp (core RDS workload). This included a mix of burstable and guaranteed QoS pods, with DPDK pods running stress-ng and non-DPDK pods running client/server ping/probe traffic.
- Data plane (DP) workload: Implemented with crucible/regulus (uperf). This consisted of unidirectional East-West TCP stream traffic between 37 pairs of client-server pods (74 pods total) distributed across worker nodes. The maximum theoretical achievable throughput was 925 Gbps (37 pairs * 25 Gbps NICs).
To support the CP workload, we prepared the cluster with the following settings in accordance with the Telco Core Reference Design.
Apply the PerformanceProfile with isolated and reserved cores depending on the machine’s CPU layout, 1G hugepages allocated on NUMA node 0 and topologyPolicy=single-numa-node:
---
apiVersion: performance.openshift.io/v2
kind: PerformanceProfile
metadata:
  name: customcnf
spec:
  cpu:
    isolated: 2-31,34-63
    reserved: 0,32,1,33
  globallyDisableIrqLoadBalancing: false
  hugepages:
    defaultHugepagesSize: 1G
    pages:
    - count: 160
      node: 0
      size: 1G
    - count: 6
      node: 1
      size: 1G
  machineConfigPoolSelector:
    pools.operator.machineconfiguration.openshift.io/worker: ""
  nodeSelector:
    node-role.kubernetes.io/worker: ""
  numa:
    topologyPolicy: single-numa-node
  realTimeKernel:
    enabled: false
  workloadHints:
    highPowerConsumption: false
    perPodPowerManagement: true
    realTime: false
  net:
    userLevelNetworking: false
---
Accordingly, we properly annotated the pods running the workload. Further, we usedNICs with SRIOV support to install and configure the SRIOV operator with corresponding SriovNetworkNodePolicy, and to label the share of worker nodes as specified in the kube-burner core RDS workload: 25% worker-dpdk and 10% worker-metallb of all worker nodes available.
When deployed, the CP workload runs a mixture of burstable and guaranteed QoS pods as specified in the core RDS workload. While burstable pods can run on any available worker node, guaranteed DPDK pods are limited to worker nodes labelled as worker-dpdk. These DPDK pods request 16GB hugepages, run stress-ng that consume 100% of the two requested cores, and implement 1x OVN and 2x SRIOV interfaces.
The burstable pods, on the other hand, run ping/probe traffic and implement 1x SRIOV and 1x OVN for server pods and only 1x OVN interface for the client pod. In summary, per so-called iteration in kube-burner, the core RDS workload deploys 52 pods per namespace: 30x server pods, 20x client pods, and 2x DPDK pods.
In the environment used for this measurement with 115 worker nodes, we deployed the following objects from the CP workload.
Objects | core RDS workload |
Deployments | 2875 burstable |
230 DPDK | |
Pods | 5750 burstable |
230 DPDK | |
Services | 2300 ClusterIP |
115 LB/MetalLB | |
Endpoints | 0.5M~ |
Routes | 230 |
Network policies | 345 |
ConfigMaps | 3450 |
Secrets | 4830 |
The DP workload runs a long-standing unidirectional TCP stream (bulk flow) with uperf on all worker nodes labeled as customcnf, except for the worker nodes already labelled and reserved for the CP workload. This totals to 74 nodes out of the 115 worker nodes in the cluster.
While varying the CP workload churn levels (0% to 100%), we configured the DP workload as follows:
- OVN-Kubernetes (OVN) on the same NIC as the CP core RDS workload
- MACVLAN on a different NIC than the CP core RDS workload
- SR-IOV on a different NIC than the CP core RDS workload
Data-plane throughput impact
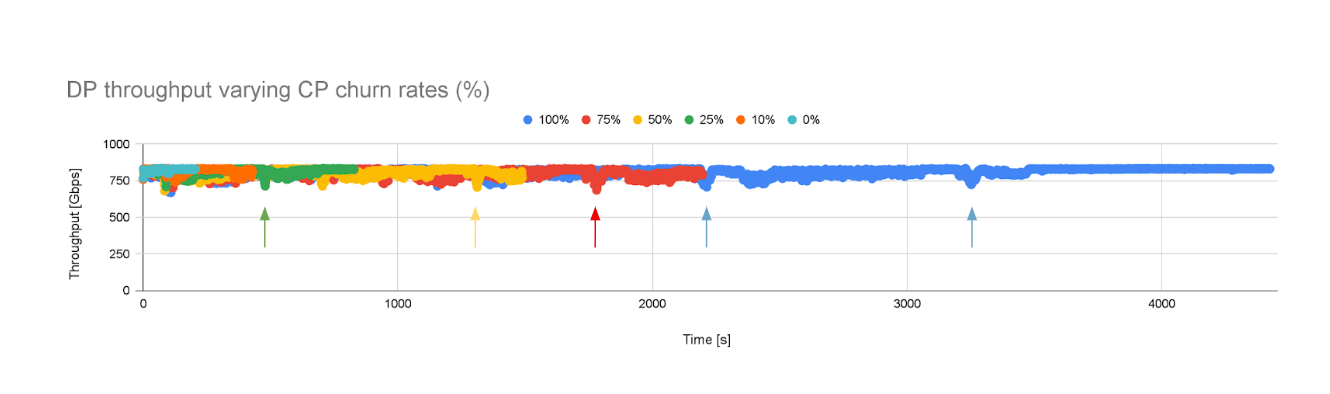
When trying to saturate the NIC with the DP workload running OVN, we are able to achieve 830 Gbps on average, which represents approximately 89% of the achievable theoretical maximum of 925 Gbps.
Note that we reported the total throughput looking at all worker nodes: while each NIC can achieve 25 Gbps, the DP workload deploys 37 pairs of client/server pods, i.e., 37 * 25 Gbps = 925 Gbps.
When churning the CP workload (starting at 0% up to 100%) and keeping the DP workload running with OVN, we observed some degradation in the throughput as illustrated in Figure 2.
We would like to look a bit closer and quantify whether there are significant differences as the churn level of the CP workload varies. Figure 3 is a snapshot of the first 10 minutes of the previous experiment.
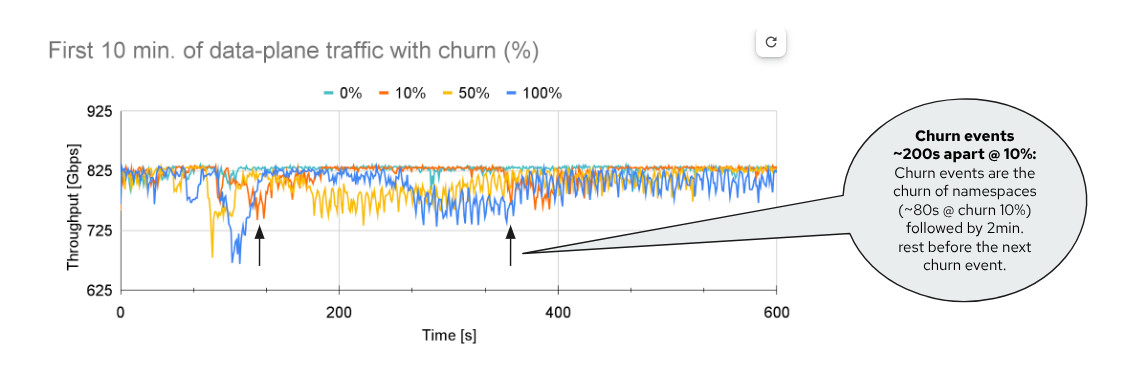
The cyan line serves as a baseline when no churn is applied to the CP workload. There, we see that the throughput is barely affected and achieves ~830 Gbps on average and consistently. However, as we start churning, we notice that the churn level (%) does impact the throughput.
For example, with 10%, we observe that the churn event takes around ~80s. If we look at the orange line when the throughput starts going lower (~100s) and when it goes back up again (~180s), it is roughly 80s. In between, where the throughput has recovered, there are fixed restperiods between churn events (2 minutes).
However, if we look at churn 50% (the yellow line), the throughput degradation is more prominent. It also takes much longer to converge, almost 7 minutes. This makes sense, since churning 50% of the namespaces takes longer compared to churning 10% of them. If we focus instead on the entire experiment, the overall average throughput consistently decreased from 830 Gbps (churn 0%) to 818 Gbps (churn 100%) on average.
Now we set the DP workload to run with MACVLAN and SRIOV configurations. As expected, they achieved a higher throughput compared to the total achievable value. On average, these values are: 869 Gbps for MACVLAN (93.9%) and 912 Gbps for SRIOV (98.6%). This not only makes sense because the packets in these networking configurations have a shorter path (i.e., they skip the OVN, kernel networking layer) but also because in our experiment setup, these DP workload configurations were measured on a different NIC than the CP workload. In other words, their shared path or resources with the CP workload is very small.
Pod readiness latency
While running the CP workload, we can also collect several cluster-related metrics, covering a wide range of its control-plane and worker node components. In this section, we will select a small subset of these metrics: the control plane and worker nodes CPU and memory usage, etcd CPU, memory and latencies, and the API server CPU, memory, and latencies.
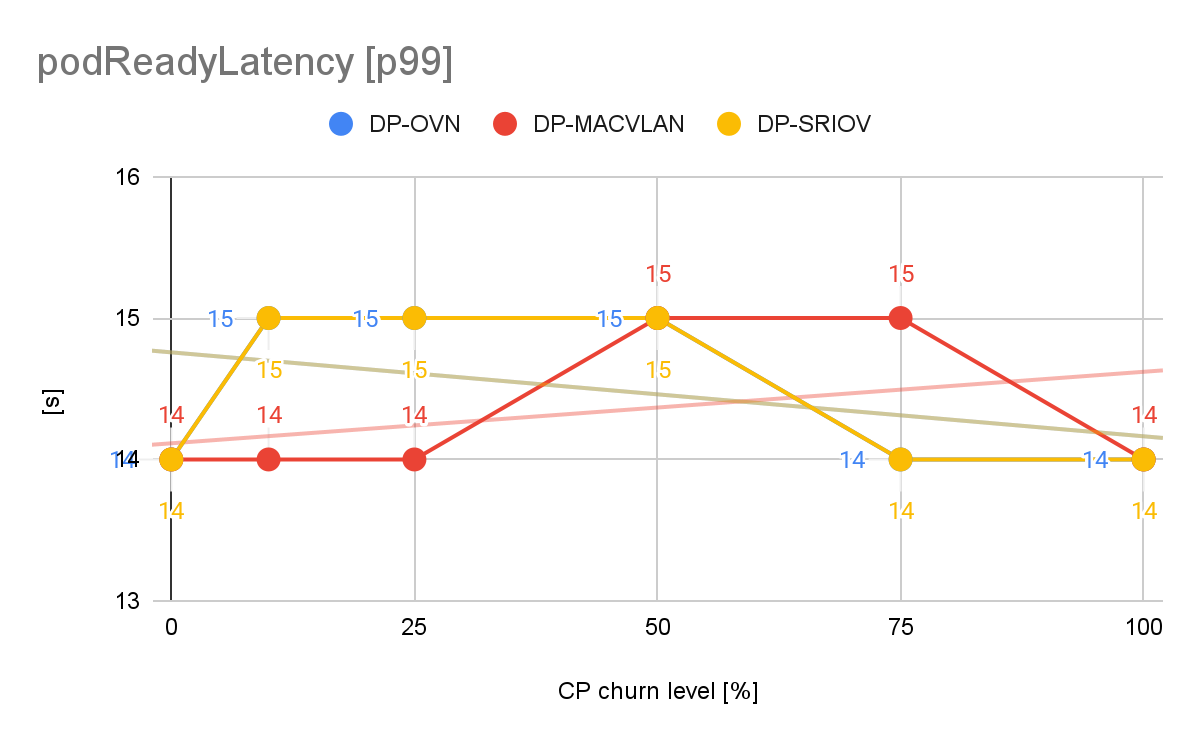
More notably, since we started with these measurements back with OpenShift Container Platform 4.16, we noticed an increase in the pod readiness latency, a metric collected by kube-burner, which defines the time taken for pods to get ready since their creation.
While the p99 value in OpenShift Container Platform 4.16 was 9.4s for the same CP workload, it increased to 14s in OCP 4.20, approximately 48%. We can capture such changes thanks to the continuous performance testing (CPT) efforts, where we define and monitor relevant system performance metrics on a release over release basis (Figure 4).
Remember that the CP workload is made of pods with different QoS classes and configurations. If we look at the pod types in this workload separately, we identify some notable difference in which pod is mostly contributing to the pod readiness latency (Figure 5).
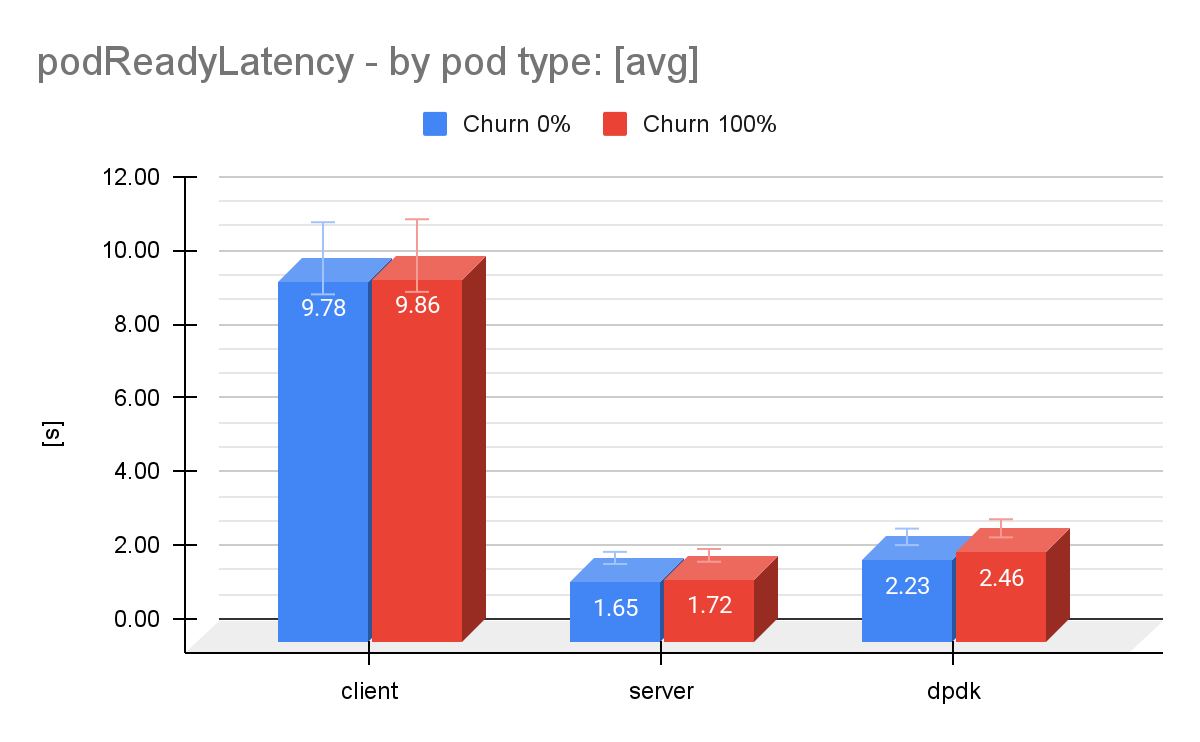
While we investigate this issue, when we look at the measurements from previous OpenShift Container Platform versions (4.16 and 4.18), the pod readiness latency improved in some cases. For instance, the guaranteed DPDK pod readiness latency [p99] was improved from 2.8s in OpenShift Container Platform 4.18 to 2.4s in OpenShift Container Platform 4.20, or approximately 16,7%.
Also, we found that the churn level had a slight influence on the pod readiness latency, with 2.23s with churn 0% and 2.46s with churn 100% for the DPDK pods, an increase of 10.3%.
Node-level CPU and memory consumption
Perhaps one may be interested in the impact of trying to emulate such a dynamic environment on the control plane and worker nodes CPU and memory resources. While the memory consumption was barely affected, the control plane nodes CPU consumption demonstrated a clear and consistent upward trend as the namespace churn level increased. The churn 0%, while the average CPU was 11.06 Cores, the consumption increased steadily to 14.08 Cores at churn 100%. This overall increase of approximately 27% illustrates the increased pressure placed on the control plane nodes, as we increase the churn level of the namespaces.
In contrast, the two other scenarios utilizing dedicated NICs for the DP-MACVLAN and DP-SR-IOV demonstrated superior isolation, resulting in minimal control-plane node CPU increases (+3% in DP-MACVLAN and +7% in DP-SRIOV), proving their stability for high-performance telco-grade environments. Unlike MACVLAN, which utilizes a simpler kernel feature for virtual interface creation, SR-IOV requires the control plane to constantly allocate and de-allocate physical hardware resources, so-called VFs, which happens via the SR-IOV network operator in OpenShift Container Platform.
That said, the control plane must engage in a more resource-intensive operation (e.g., allocating/freeing a hardware-backed VF). This may explain the differences we observe in the CPU for the DP-MACVLAN and DP-SRIOV scenarios (Figure 6).
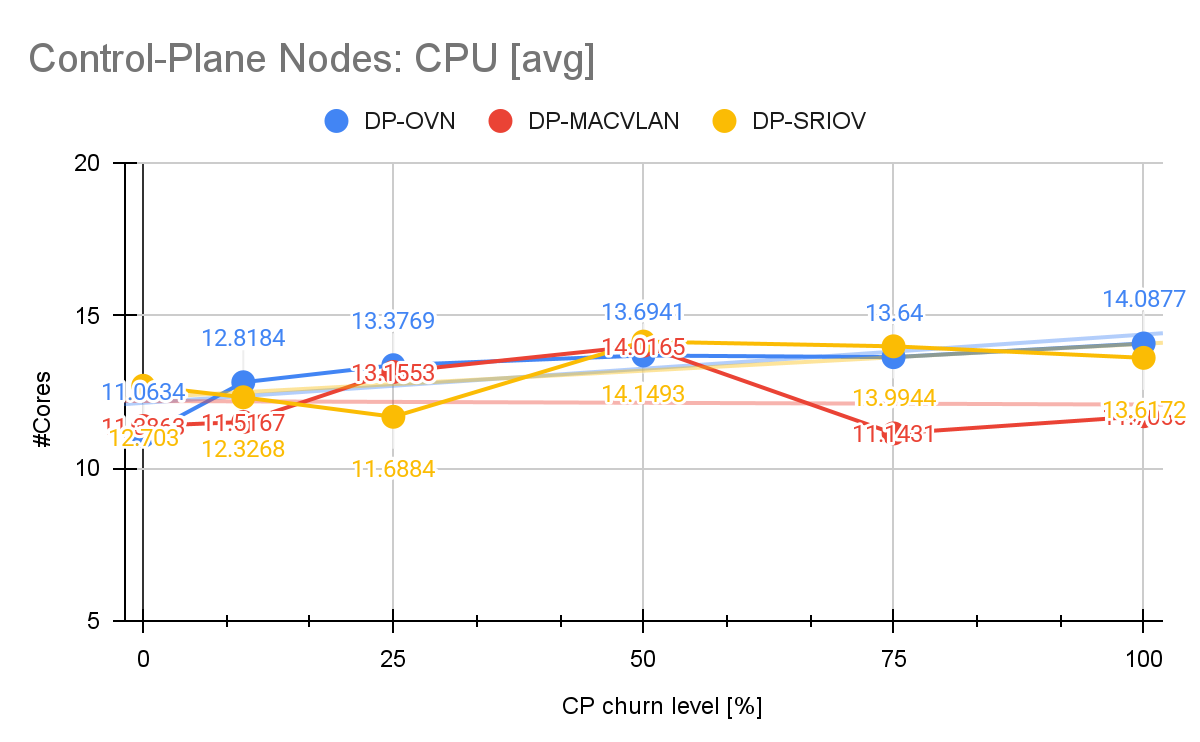
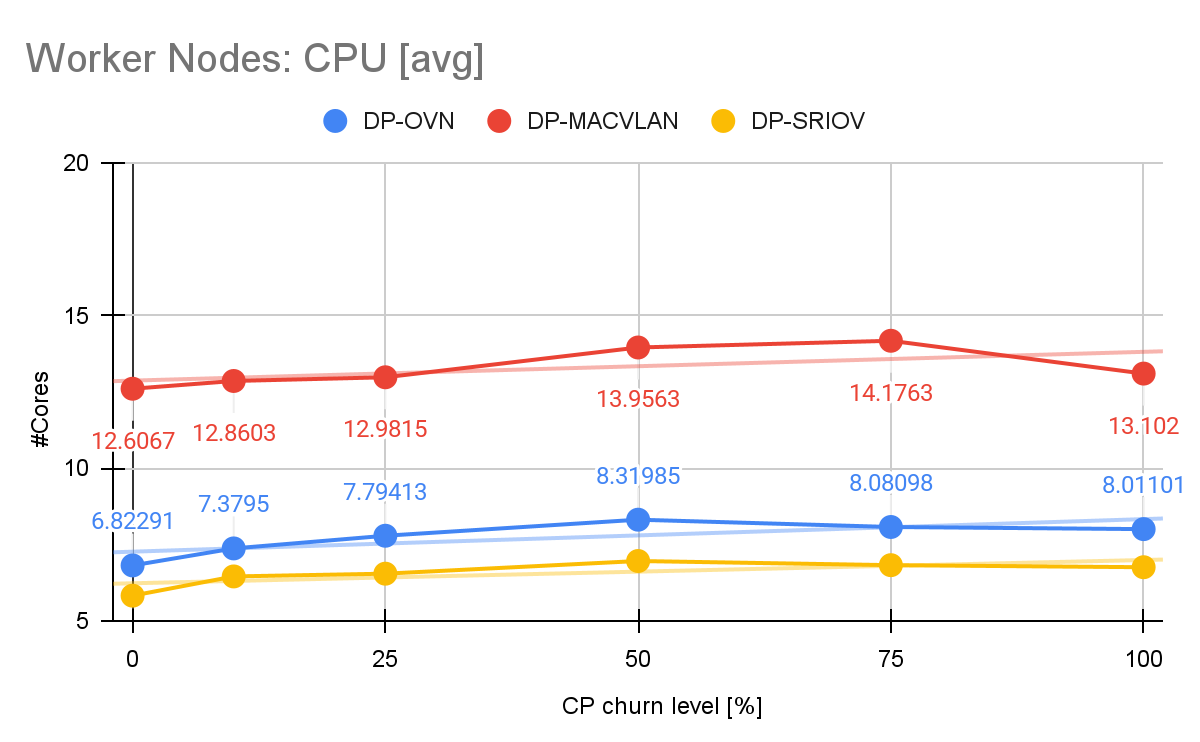
Figure 7 shows the impact of churn on the CPU of the worker nodes with an increase of 21.9% between churn 0% and churn 100% in the DP-OVN scenario, which was followed by more modest increases in the DP-MACVLAN and DP-SRIOV scenarios +12.45% and +16.67%, respectively.
Etcd
Churning namespaces heavily impacts etcd because deleting or creating a namespace triggers hundreds, if not thousands, of coordinated object writes, deletes, finalizer updates, and watch notifications, which in turn creates significant write amplification and sustained disk I/O pressure on etcd.
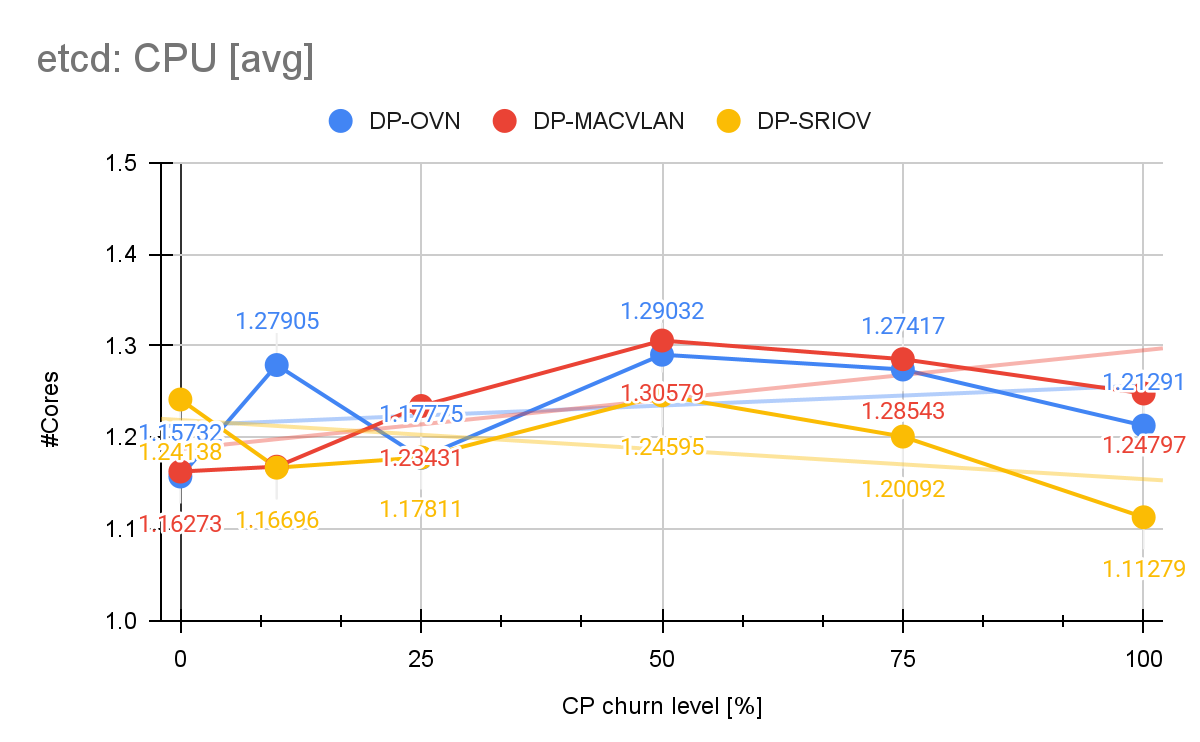
However, if we look at etcd’s resource consumption and latencies, etcd demonstrates remarkable stability as the control plane churn level varied from 0% to 100%: We observe that etcd’s latencies (WAL, backend and RTT) across all churn configurations were barely affected and remained within acceptable key performance indicator (KPI) ranges. Etcd CPU consumption with DP-OVN remained relatively low and stable.
We measured an average of approximately 1.23 Cores across all churn levels, where at churn 0% the average CPU consumption was 1.15 Cores, where we can determine an increase of 6.9%. Memory consumption saw a slightly higher increase of 12.9% between 0% and 100% churn (Figure 8).
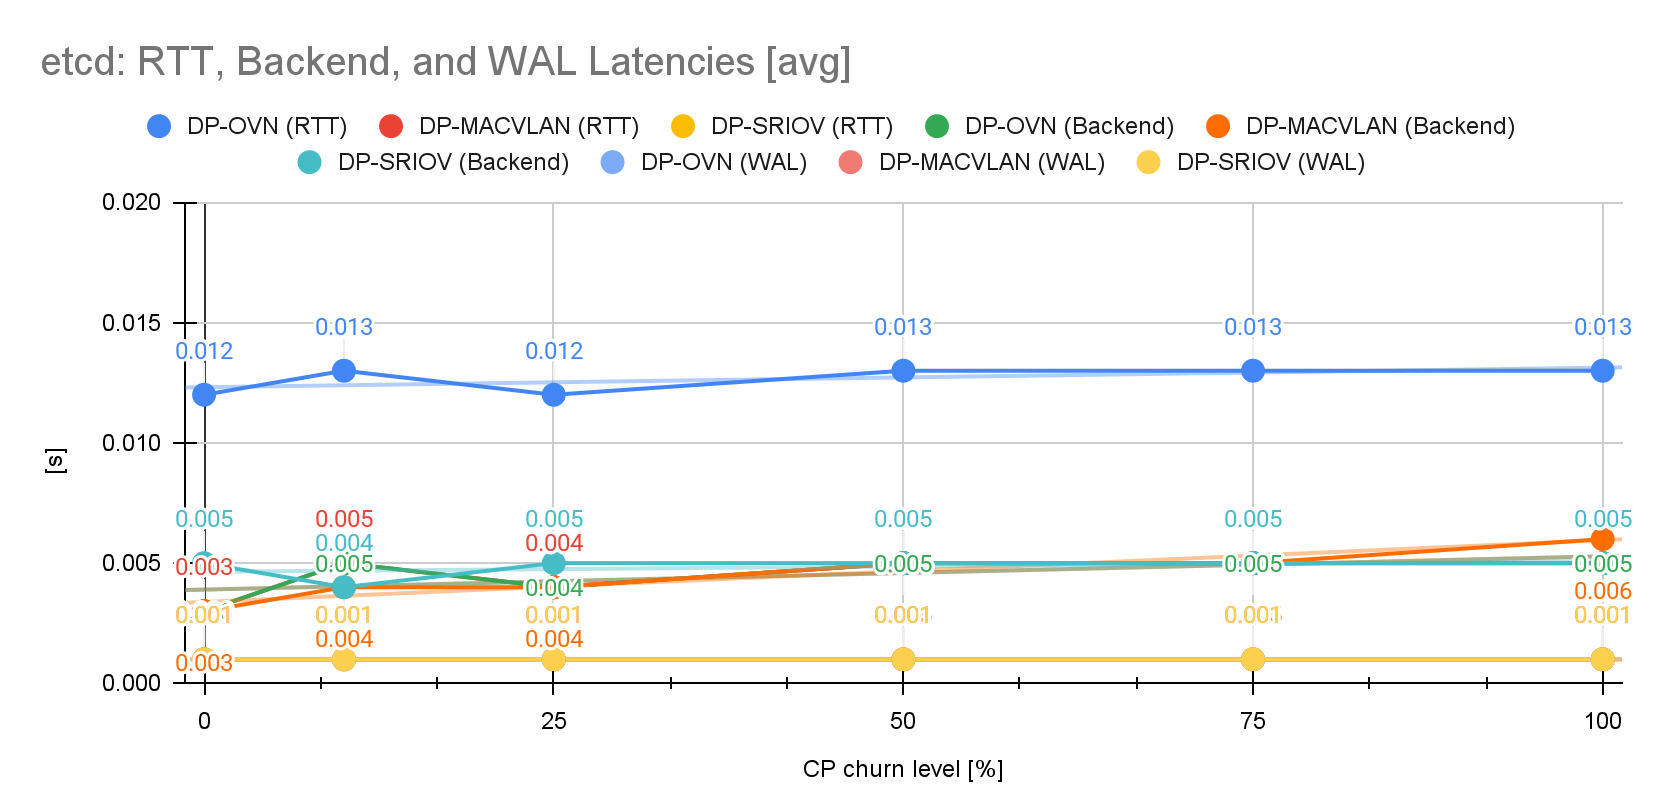
Despite the steady pressure, etcd’s latencies (RTT, backend, and WAL) remained largely unaffected across all churn levels and stayed within acceptable key performance indicator (KPI) ranges, indicating that the etcd cluster was not the primary bottleneck during the control plane churn tests (Figure 9).
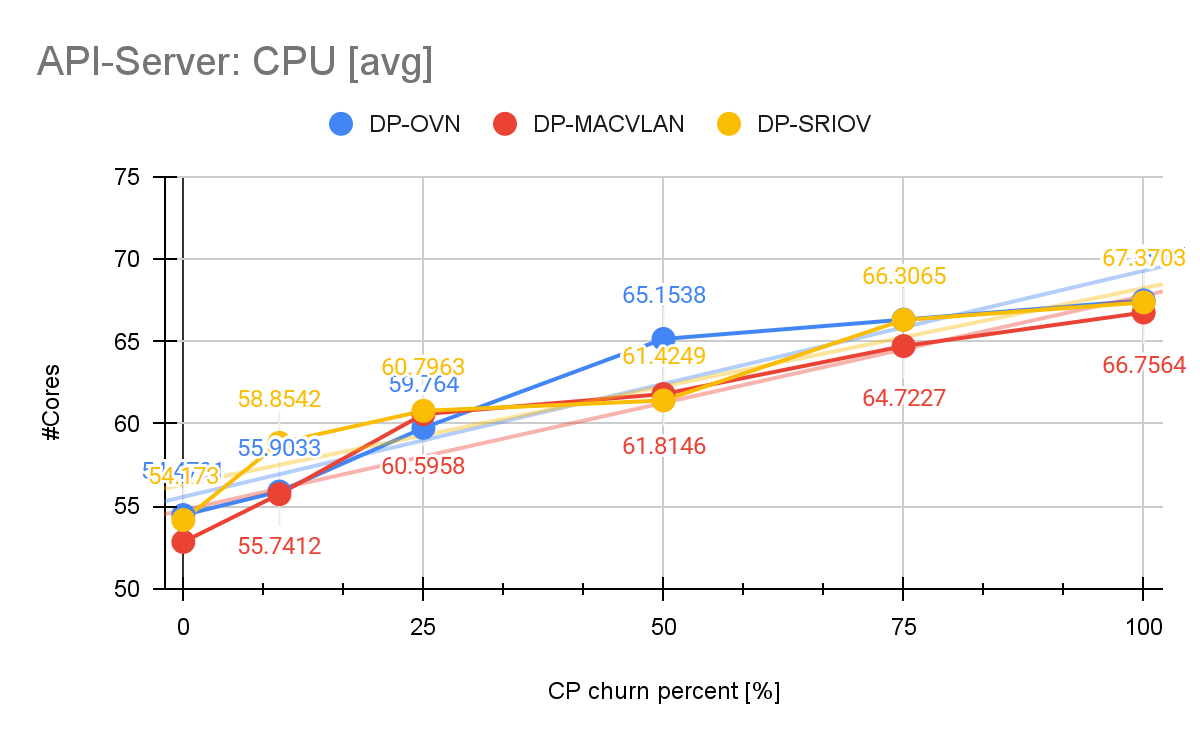
API server
The Kube API server is another critical component of the control plane, specially during churn, since namespace creation/deletion generates massive amounts of traffic towards the API. Let’s have a look at its CPU and memory consumption.
During our measurements with DP-OVN the API server exhibits an increase of 24% in the CPU consumption while memory consumption was barely affected. For API server read-only (RO) and mutating latencies, the DP-OVN configuration stayed nearly consistently below and around 40ms between churn 0% and 100%, which we can also confirm in the DP-MACVLAN and DP-SRIOV scenarios (Figure 10).
Conclusions
In this article, we attempted to quantify the impact of churning operations in the CP workload on the DP workload. To this end, we ran the data plane workload (DP) with three different configurations (OVN, MACVLAN, and SRIOV), while the CP workload emulated a highly dynamic environment, churning full namespaces varying from 0% to 100% of the namespaces in OpenShift Container Platform 4.20.
As expected, the DP-SR-IOV configuration is the clear winner for maximum throughput and consistency, delivering nearly line-rate performance with no observable degradation. The next strongest and stable performer is DP-MACVLAN offering a good balance of high throughput and stability. This was somewhat expected and a good validation of our hypotheses, since DP-MACVLAN and SP-SRIOV are not only isolated from the CP workload, as they bypass a large portion if not the entire kernel networking stack. But they also use a dedicated NIC.
On the other hand, the scenario with DP-OVN, where both the host stack as well as the NIC are shared with the CP workload, OVN-K was susceptible to CP-workload churn, with the lowest absolute throughput with visible throughput dips during the namespace creation/deletion cycles of the CP workload.
We also collected other CP-related metrics in our measurement study, indicating that the CPU, memory, and latency for etcd and the API server were not severely impacted by churning the CP workload. We did observe an increase in CPU utilization in all cases, which we expected, since churning namespaces at an increased rate generates more operations in components such as the etcd and API server. However, the increase is well within acceptable operational ranges, even sublinear.
We hope that these findings are useful for architects designing high-performance 5G core network functions and other demanding workloads on the OpenShift Container Platform.
Looking ahead
Following on our continuous performance testing (CPT) efforts, we aim to have measurements based on release over release cadence of the combined Telco Core Reference Design Specification (RDS) and a data plane workload. With time and more measurements, we will be able to rank KPIs more or less affected by CP workload operations as well as assess OpenShift Container Platform’s stability more continuously. Stay tuned!
Last updated: January 20, 2026