This is the final article in a series demonstrating the process of performance testing Service Binding Operator for acceptance into the Developer Sandbox for Red Hat OpenShift. In Part 4, I explained how I gathered performance metrics for the Developer Sandbox team. I also discussed the additional metrics we used to measure the developer experience using Service Binding Operator.
The payoff comes in this final article, where I present the test rounds I undertook as the application developed and how I interpreted the results.
Read the whole series:
- Part 1: Performance requirements
- Part 2: The test environment
- Part 3: Collecting runtime metrics
- Part 4: Gathering performance metrics
- Part 5: Test rounds and results
Test configuration
The following sections show the test rounds as they evolved over time. The title of each test round summarizes the test configuration, in the following format:
"A users, B active, C/D SB, E NS on OCP v F"
Here is the key for understanding the test configuration from each title:
- A: The overall number of simulated (registered) users.
- B: The number of active users.
- C: The overall number of
ServiceBindingresources created along with the other user workloads (the "With SBR" scenario). - D: The overall number of
ServiceBindingresources created after all of the users were provisioned (the "Without SBR" scenario). - E: The overall number of namespaces created for simulated users.
- F: The underlying version of my cluster on Red Hat OpenShift Container Platform.
As we continually upgraded the tool, we tested successive versions. I will present the test results for Service Binding Operator versions 0.5.0, 0.6.0, 0.7.0, and 0.7.1.
Performance testing Service Binding Operator 0.5.0
I started with Service Binding Operator 0.5.0, which was at that time the latest version released by Red Hat.
Test run 1: With Service Binding resources
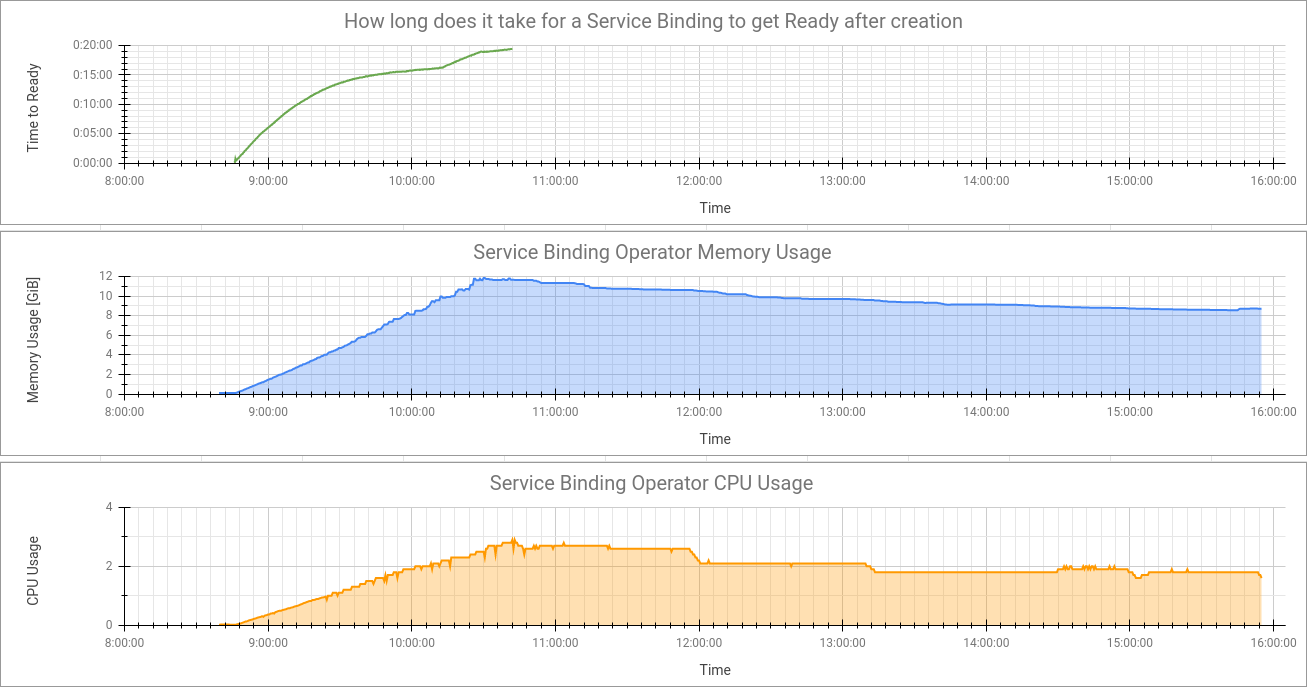
The very first round of the performance evaluation is titled With SBR - 3000 users, 600 active, 600/0 SB, 9000 NS on OCP v4.6.20. We provisioned the maximum number of users specified in our requirements, which was 3,000. Of these, only every fifth user was active, or 600 overall. This was the default ratio used by the Developer Sandbox testing tool.
In this run, the cluster survived, but the numbers were scary for Service Binding Operator. Memory use went up to a peak of 12 GiB and the CPU usage rose to approximately 3 vCPU. Service Binding Operator's performance was also not good, taking up to approximately 20 minutes to process the last of the 600 ServiceBinding requests. Figure 1 shows the charts I generated to observe test metrics.
Test run 2: With Service Binding resources
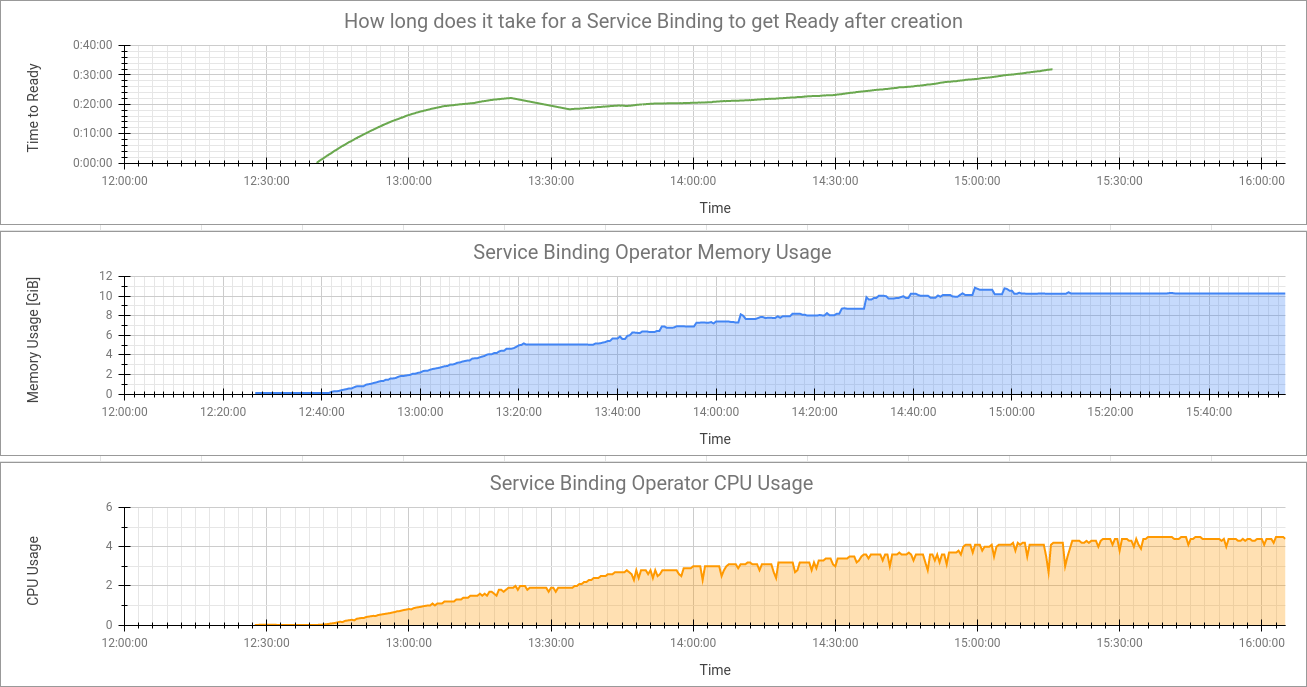
After the initial performance test, with only 20% of users active, I increased the ratio to 50%, so there were 1,500 active users out of 3,000 registered. I wanted to see whether memory consumption would rise even more. This test is titled With SBR - 3000 users, 1500 active, 1500/0 SB, 9000 NS on OCP v4.6.20.
The cluster also survived in this run, but Service Binding Operator consumed an enormous amount of resources. Memory use was still high at 11 GiB, and the CPU usage went over 4.5 vCPU. Service Binding Operator showed even worse performance, as the last of the 1,500 ServiceBinding requests took more than 30 minutes to finish. Figure 2 shows the results.
Test run 3: Without Service Binding resources
Next, I wanted to see what would happen if 1,500 ServiceBinding requests were sent all at once after the users were successfully provisioned. This test round is titled Without SBR - 3000 users, 1500 active, 0/1500 SB, 9000 NS on OCP v4.6.20. Figure 3 shows how the systems reacted.
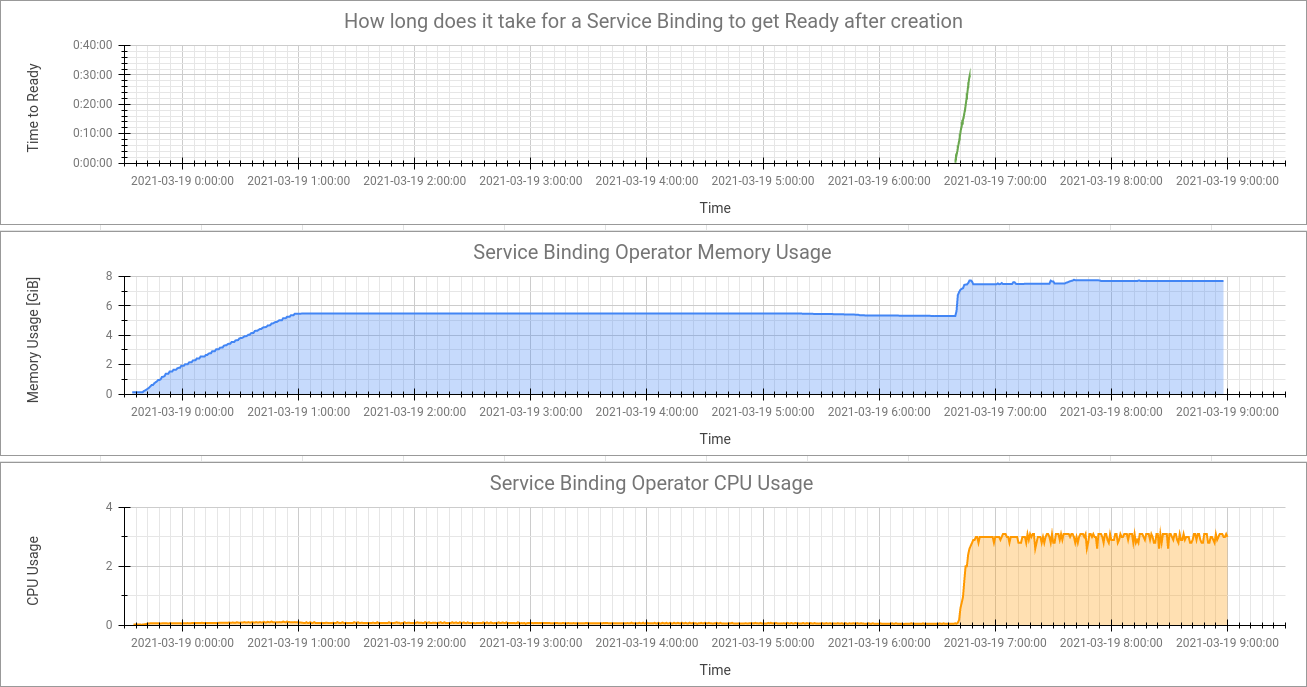
Let's investigate the four interesting phases of this test:
- Phase 1: In the initial ~1.5 hours of ramp-up, the tool registered all 3,000 users into the sandbox.
- Phase 2: During the next ~5.5 hours, where seemingly nothing happened (from Service Binding Operator's perspective), all of the 1,500 active users were active. They were creating workloads in their respective namespaces. The workloads consisted of the default set plus the backing service and the application to be bound, without the actual
ServiceBindingresource. - Phase 3: During the last ~6 minutes, all of the 1,500
ServiceBindingresources (for active users) were created and processed by Service Binding Operator. - Phase 4: The final phase shows what Service Binding Operator was doing afterward.
From our analysis of the results and code, we discovered the reason why Service Binding Operator took lots of memory even when it was supposed to be idle (in Phases 1 and 2): It watched for many resources, just in case, that were not related to binding requests. It then cached all that information in memory. Based on that observation, we decided to drop the just-in-case watches. These changes were merged and we released a new version of Service Binding Operator, 0.6.0. Next, we'll look at the results of performance evaluations of this new version.
Performance testing Service Binding Operator 0.6.0
In this round, we wanted to see what happened when all of the simulated users were active. Unfortunately, I wasn't able to simulate all 3,000 users as active because the time needed for provisioning them exceeded the lifespan of my temporary OpenShift cluster (about 10 hours). So, I had to stop the provisioning sooner than the full capacity of 3,000 users was reached. That is why the following results have only 2,599 and 2,800 active users, respectively.
Test run 4: With Service Binding resources
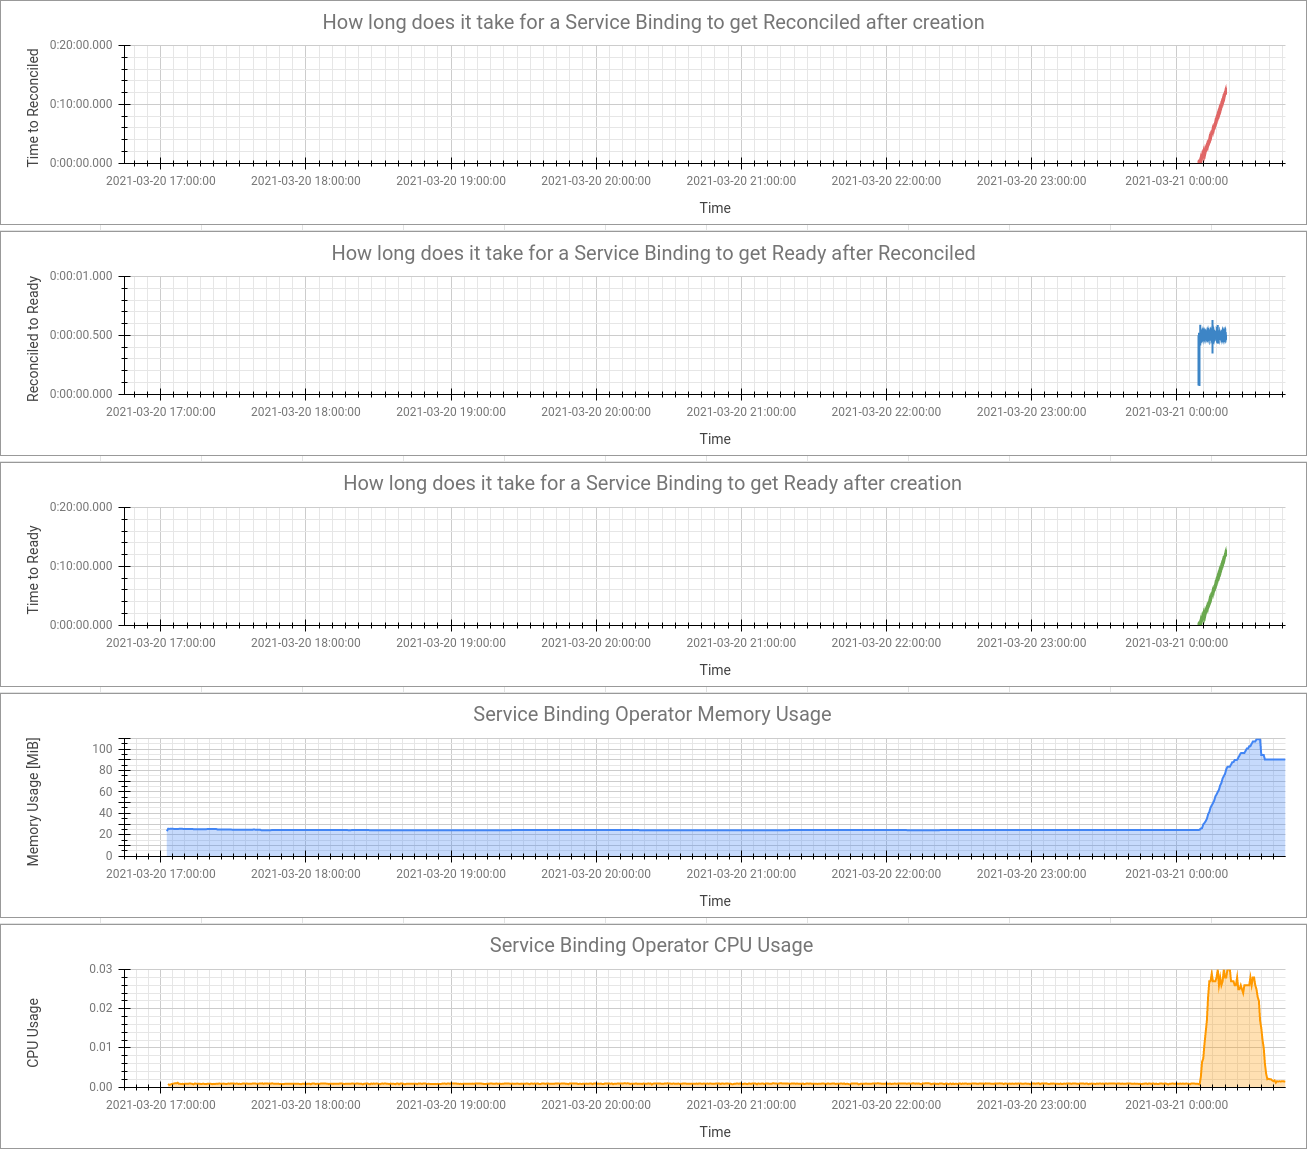
This run is titled With SBR - 3000 users, 2599 active, 2599/0 SB, 9000 NS on OCP v4.6.20. We saw an impressive performance improvement with this new version of Service Binding Operator after dropping the just-in-case watches. This was true even when the number of active users along with ServiceBinding requests almost doubled, as shown in Figure 4.
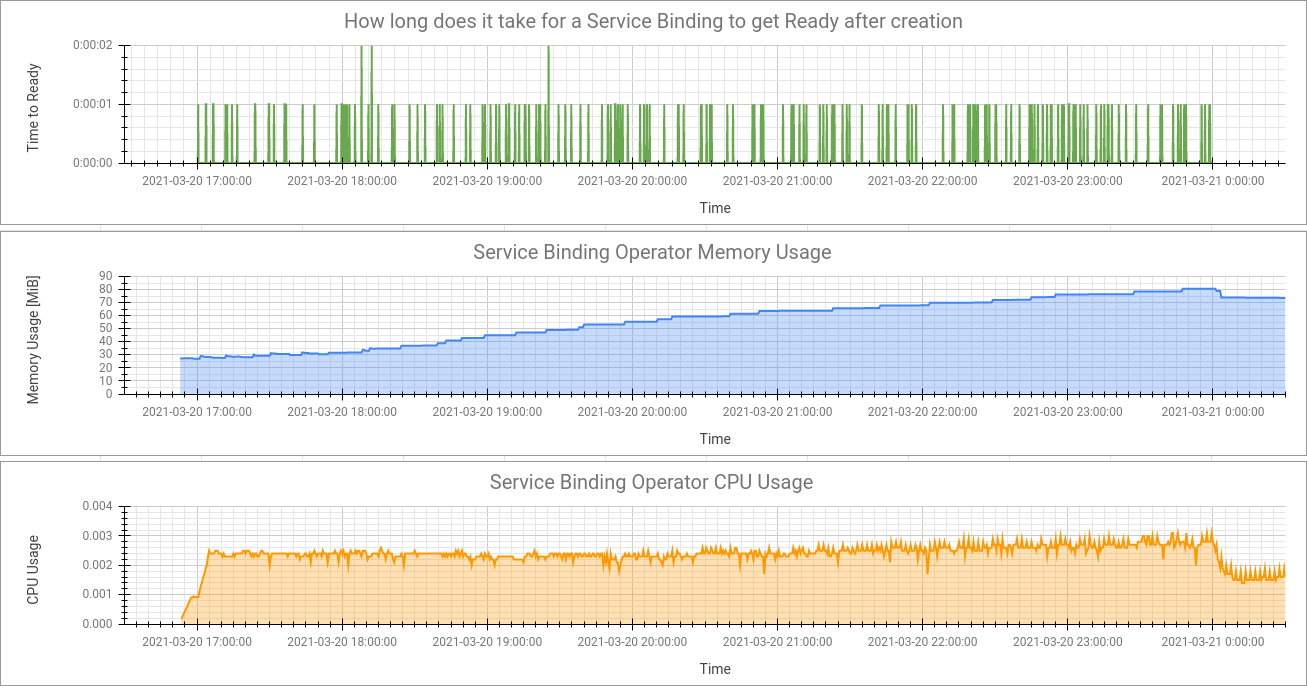
Note the following:
- Memory usage dropped from a peak of ~11 GiB to a peak of ~80 MiB (approximately 140 times less memory usage).
- CPU usage dropped from a peak of ~4.5 vCPU to a peak of ~0.0034 vCPU (approximately 1,323 times less CPU usage).
Test run 5: Without Service Binding resources
This run is titled Without SBR - 3000 users, 2800 active, 0/2800 SB, 9000 NS on OCP v4.6.20. This was the first time I split the Service Binding Operator metrics into different parts, to understand where the most time was spent. It is interesting to see that the time spent on binding was about 0.5 seconds, even when the time from the creation of ServiceBinding request to the creation of the binding was around 13 minutes in the worst case. This observation revealed that it is not Service Binding Operator that causes the long processing time, but rather something in OpenShift itself—most likely in the API servers processing the incoming ServiceBinding requests. Keep in mind that all of the 2,800 ServiceBinding requests were thrown at the cluster's API servers in as short a period of time as possible.
The results in Figure 5 show that the idle Service Binding Operator took only 25 MiB of memory and almost no CPU.
During a couple of attempts, one of the follower nodes in the OpenShift cluster actually crashed. The cause was that the API servers were overloaded with all of the incoming activity of user provisioning, which caused that node to stop responding. Based on that observation, I extended the watched metrics to uncover the bottlenecks, as described in the previous article in this series.
Performance testing Service Binding Operator 0.7.0
Another concurrent optimization of Service Binding Operator, reconcile loop refactoring, greatly improved the code and allowed the Service Binding Operator core to be used as a library—a feature that had been requested by various teams (such as the odo CLI tool team). We released a new version of Service Binding Operator numbered 0.7.0, and we needed to ensure that the optimization didn't degrade performance.
At the same time, a couple of test parameters changed significantly:
- Based on the crashes caused when the API servers and monitoring pods were overloaded with 3,000 active users, the Developer Sandbox team decided to lower the capacity of a single cluster for production sandbox instances from 3,000 to 2,000.
- For the same reasons, the number of namespaces available for each user was decreased from three to two.
I changed my tests to match these relaxed requirements. Also, the version of OpenShift underlying the Developer Sandbox was updated to version 4.7.x, so I updated my OpenShift Container Platform version to match.
Let's examine the test runs under these new conditions.
Test run 6: With Service binding resources
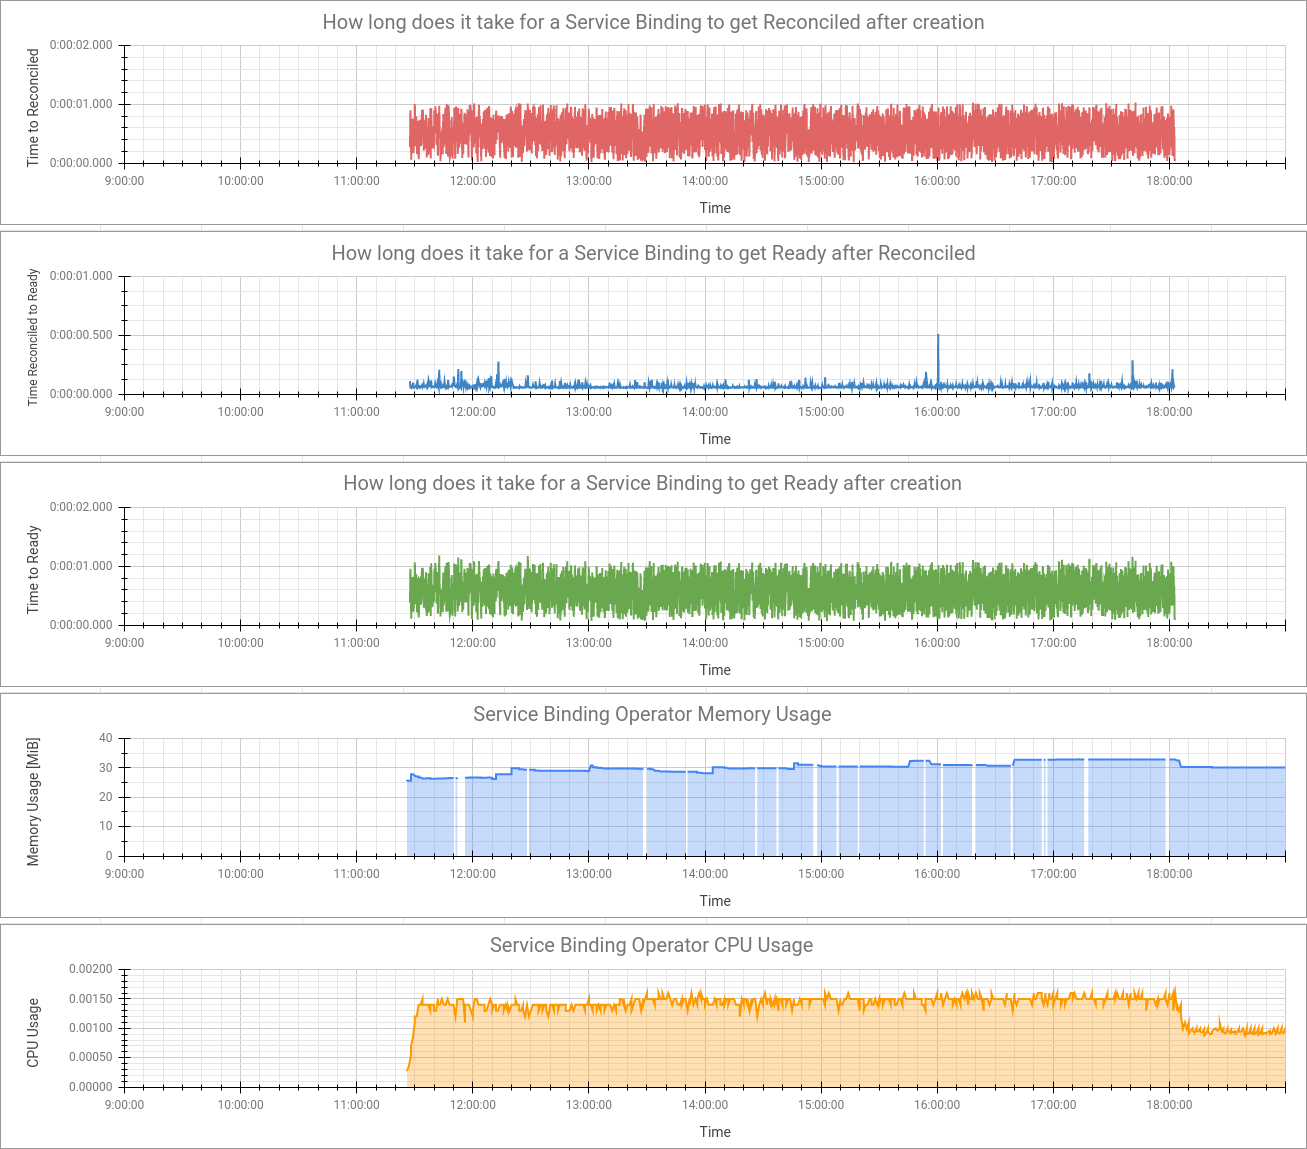
Figure 6 shows our first and only run on Service Binding Operator 0.7.0. Performance was stable throughout the run, and reasonably good. This test run was titled With SBR - 2000 users, 2000 active, 2000/0 SB, 4000 NS on OCP v4.7.4.
As mentioned in the first article in this series, one requirement for running in the Developer Sandbox was for Service Binding Operator to work with the Red Hat OpenShift Application Services Operator. Soon after Service Binding Operator 0.7.0 was released, a regression affecting the Red Hat OpenShift Application Services Operator was found. The problem was quickly fixed and Service Binding Operator 0.7.1 was released with the bug fix. That happened quite fast, so by the time I planned to test the new scenario, Service Binding Operator 0.7.1 was already on its way. It didn't make sense to test the "Without SBR" scenario with Service Binding Operator 0.7.0, so I skipped right to the newest version.
Performance testing Service Binding Operator 0.7.1
We finished our exploration of Service Binding Operator's performance with one test run on the bug-fix version.
Test run 7: Without Service binding resources
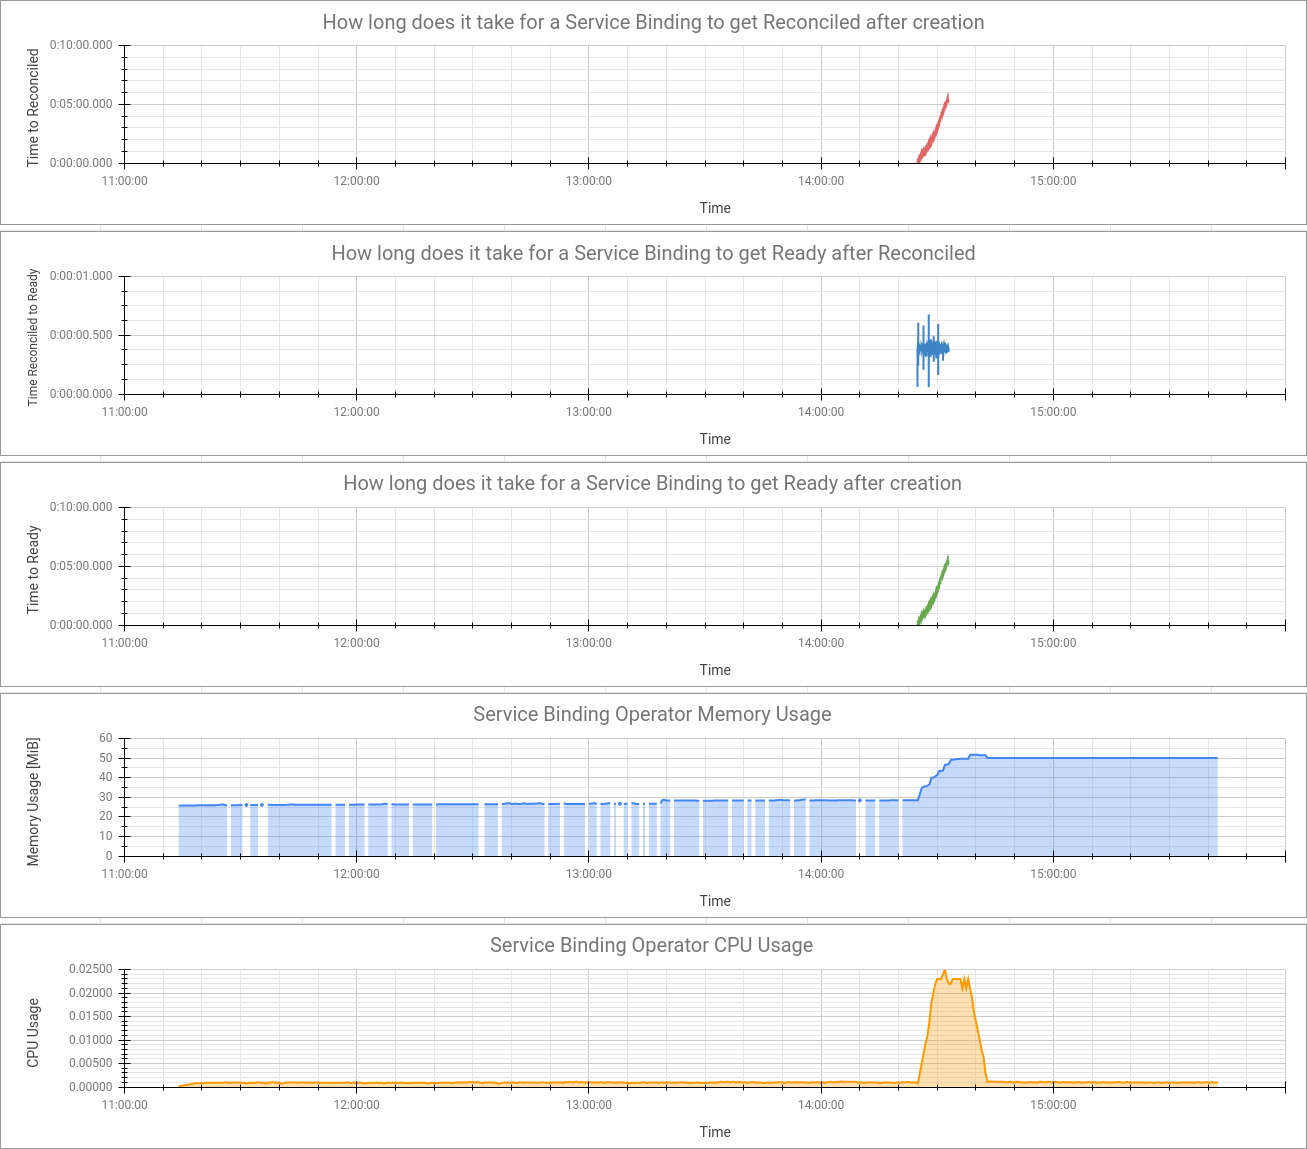
This test run was titled Without SBR - 2000 users, 2000 active, 0/2000 SB, 4000 NS on OCP v4.7.6. Our intention was to verify that the performance held even with the recent bug-fix release—and it did, as shown in Figure 7.
Conclusion: Performance analysis and results
Ultimately, the version of Service Binding Operator that was accepted and installed in the production deployment of Developer Sandbox was 0.7.0, which we later updated with the bug-fix release of 0.7.1. That version was used at the Red Hat Summit in the Connecting to your Managed Kafka instance from the Developer Sandbox for Red Hat OpenShift demo and workshop. It ran smoothly without any problems. The Service Binding Operator is currently available to any developer playing with the Developer Sandbox.
During the evaluation, we improved Service Binding Operator's performance dramatically:
- Memory usage dropped from a peak of ~11 GiB to a peak of ~80 MiB (approximately 140 times less memory usage).
- CPU usage dropped from a peak of ~4.5 vCPU to a peak of ~0.0034 vCPU (approximately 1,323 times less CPU usage).
In addition, we demonstrated a problem with the underlying OpenShift cluster, which could crash for internal reasons when fully loaded with active users. Our testing led the Developer Sandbox team to decrease requirements from 3,000 to 2,000 users and to decrease the number of namespaces available for each user from three to two to ensure the stability of the sandbox. Both the improvements to Service Binding Operator and the policy decisions by the Developer Sandbox team demonstrate the value of running performance tests and collecting matrics on Red Hat OpenShift.
Last updated: September 20, 2023