Introduction
Argo CD monitors the health status of resources that it manages using a rich library of native and included health checks. As well you can add additional health checks, or override existing ones, by creating a custom health check in LUA.
These health checks return a health status for each resource (here in order of most to least healthy):
- Healthy. Indicates a resource is in a good state, will automatically be used if no health check is available.
- Suspended. The resource is suspended and waiting for some external event to resume (e.g. suspended CronJob or paused Deployment)
- Progressing. The resource is not healthy yet but still making progress and might be healthy soon
- Missing. The resource is missing and not available.
- Degraded. The resource is degraded
- Unknown. The health of the resource could not be determined
The health statuses for resources are propagated into the overall Application health status based on least healthy to most healthy. So if all resources are Healthy or Suspended but one is Degraded the Application health status would be considered Degraded.
This resource monitoring provides a low-effort, high-value way for teams to monitor the status of the resources and applications that are being deployed by Argo CD.
OpenShift GitOps includes an Alert which will proactively notify teams if an Application is Out-of-Sync, however we can deploy additional alerts in OpenShift to notify us of other conditions including when Applications are not Healthy. This provides a quick and easy way to be proactively notified of issues with resources that are covered by existing and custom Argo CD health checks.
Creating New Alerts
To create a new alert we simply have to define a new PrometheusRule CustomResource in the cluster. Here is an example that I am using in my Homelab environment:
apiVersion: monitoring.coreos.com/v1
kind: PrometheusRule
metadata:
  name: argocd-health-alerts
  annotations:
    # I am using ACM ConfigurationPolicy to bootstrap OpenShift GitOps including alerting,
    # This annotation tells ACM not to process this as a template since Prometheus/AlertManager templating
    # will collide with ACM.
    policy.open-cluster-management.io/disable-templates: "true"
spec:
  groups:
  - name: ArgoCD
    rules:
    - alert: ArgoCDHealthAlert
      annotations:
        message: ArgoCD application {{ $labels.name }} is not healthy
      expr: argocd_app_info{namespace="openshift-gitops", health_status!~"Healthy|Suspended|Progressing|Degraded"} > 0
      for: 5m
      labels:
        severity: warning
    - alert: ArgoCDDegradedAlert
      annotations:
        message: ArgoCD application {{ $labels.name }} is degraded
      expr: argocd_app_info{namespace="openshift-gitops", health_status="Degraded"} > 0
      for: 5m
      labels:
        severity: critical
    - alert: ArgoCDStuckAlert
      annotations:
        message: ArgoCD application {{ $labels.name }} is stuck in progressing for more than 10m
      expr: argocd_app_info{namespace="openshift-gitops", health_status="Progressing"} > 0
      for: 10m
      labels:
        severity: warning
    - alert: ArgoCDSyncUnknown
      annotations:
        message: ArgoCD application {{ $labels.name }} is sync status is Unknown
      expr: argocd_app_info{namespace="openshift-gitops", sync_status="Unknown"}
      for: 5m
      labels:
        severity: critical
In this example we have defined four new alerts as follows:
- The first alert is triggered whenever an Application is not Healthy (Healthy, Suspended or Progressing). We also include the Degraded status here, this is because the severity of this alert is a Warning whereas I prefer to have Degraded considered a Critical severity as per the next item...
- The second alert is triggered whenever an Application is Degraded, this is raised as a Critical alert
- The third alert is triggered whenever an Application is Progressing for more than 10 minutes at a Warning severity. The duration can be tuned to suit your environment or this can be omitted if long Progressing statuses are the norm in your environment (though this should be avoided in my opinion)
- The last alert is raised whenever an Application Sync Status is Unknown, this typically indicates a configuration issue. It is raised with a critical severity.
The exact severities and nature of the alerts used here can be changed as needed for your environment, consider this an example to tweak and tune to make your own.
Note: Each alert is only looking in the openshift-gitops namespace, this is because I do not want these alerts raised for my tenant Argo CD instance as my tenants self-manage their applications and thus the platform team isn’t responsible for tenant applications. Feel free to remove the namespace if you have multiple Argo CD instances and want alerts across all of them.
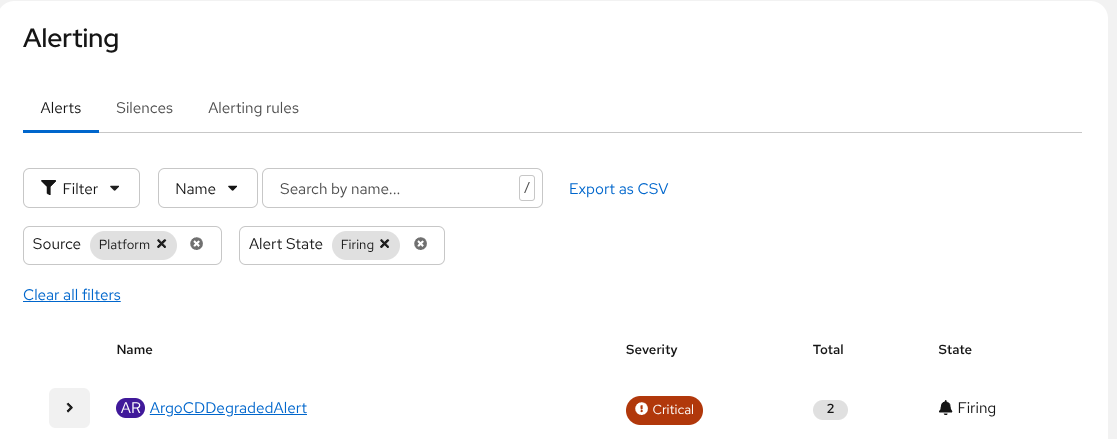
Once these new alerts are in place you should see them triggering as appropriate:
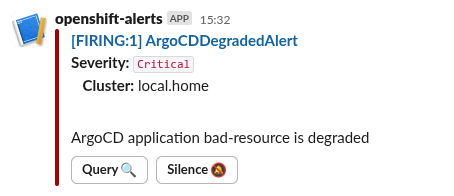
If you have the OpenShift Monitoring stack configured to propagate alerts to destinations such as EMail or Slack, they will appear there as well. Here is an example of the alert appearing in my Slack workspace:
Conclusion
In this short blog we learned how we can create additional alerting for OpenShift GitOps to take advantage of the existing health monitoring in Argo CD to respond to resource and application issues proactively.
