In this article, I'll explore the "PLEG is not healthy" issue in Kubernetes, which sometimes leads to a "NodeNotReady" status. When understanding how the Pod Lifecycle Event Generator (PLEG) works, it is helpful to also understand troubleshooting around this issue.
What is PLEG?
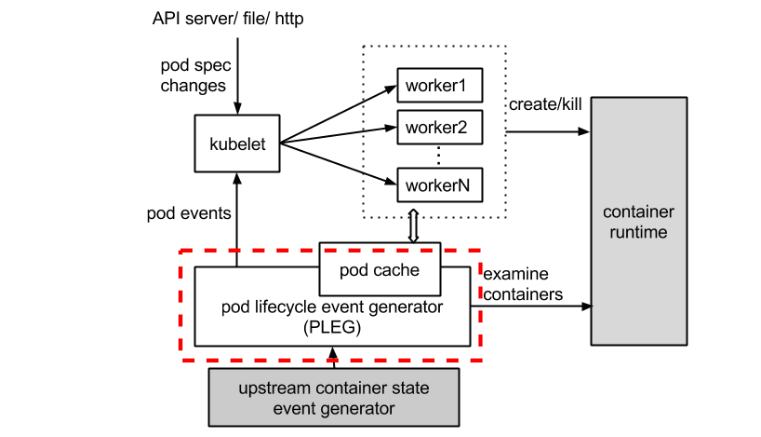
The PLEG module in kubelet (Kubernetes) adjusts the container runtime state with each matched pod-level event and keeps the pod cache up to date by applying changes.
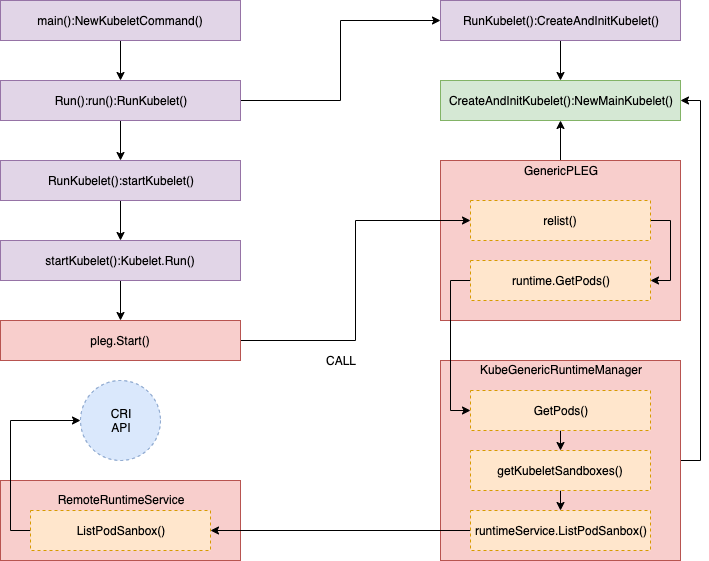
Let's take a look at the dotted red line below in the process image.
How does "PLEG is not healthy" happen?
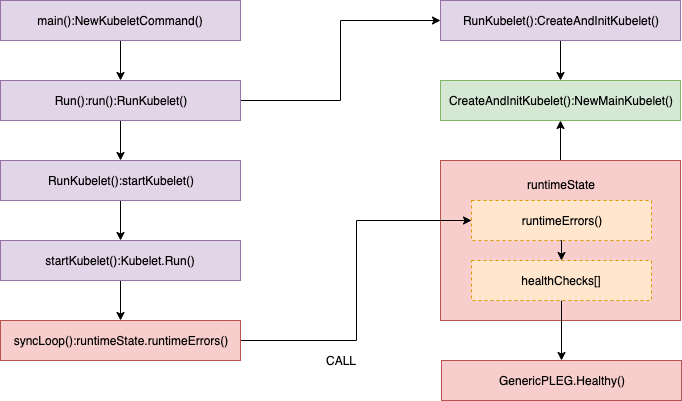
Kubelet keeps checking PLEG health by calling Healthy() periodically in SyncLoop() as follows.
Healthy() checks whether the relist process (the PLEG key task) completes within 3 minutes. This function is added to runtimeState as "PLEG" and is called periodically from "SyncLoop"(every 10s by default). If the "relist" process take more than 3 minutes, a "PLEG is not healthy" issue is reported through this stack process.
I'll walk you through the related source code based on Kubernetes 1.11 (OpenShift 3.11) in each part to help your understanding. Don't worry if you are not familiar with the Go syntax, as it's enough to read the comments in the code. I will also explain the summary before the code and snip less important things from the source code for readability.
//// pkg/kubelet/pleg/generic.go - Healthy()

// The threshold needs to be greater than the relisting period + the
// relisting time, which can vary significantly. Set a conservative
// threshold to avoid flipping between healthy and unhealthy.
relistThreshold = 3 * time.Minute
:
func (g *GenericPLEG) Healthy() (bool, error) {
  relistTime := g.getRelistTime()
  elapsed := g.clock.Since(relistTime)
  if elapsed > relistThreshold {
	return false, fmt.Errorf("pleg was last seen active %v ago; threshold is %v", elapsed, relistThreshold)
  }
  return true, nil
}

//// pkg/kubelet/kubelet.go - NewMainKubelet()
func NewMainKubelet(kubeCfg *kubeletconfiginternal.KubeletConfiguration, ...
:
  klet.runtimeState.addHealthCheck("PLEG", klet.pleg.Healthy)

//// pkg/kubelet/kubelet.go - syncLoop()
func (kl *Kubelet) syncLoop(updates <-chan kubetypes.PodUpdate, handler SyncHandler) {
:
// The resyncTicker wakes up kubelet to checks if there are any pod workers
// that need to be sync'd. A one-second period is sufficient because the
// sync interval is defaulted to 10s.
:
  const (
	base   = 100 * time.Millisecond
	max	= 5 * time.Second
	factor = 2
  )
  duration := base
  for {
      if rs := kl.runtimeState.runtimeErrors(); len(rs) != 0 {
   	   glog.Infof("skipping pod synchronization - %v", rs)
   	   // exponential backoff
   	   time.Sleep(duration)
   	   duration = time.Duration(math.Min(float64(max), factor*float64(duration)))
   	   continue
      }
	:
  }
:
}

//// pkg/kubelet/runtime.go - runtimeErrors()
func (s *runtimeState) runtimeErrors() []string {
:
    for _, hc := range s.healthChecks {
   	 if ok, err := hc.fn(); !ok {
   		 ret = append(ret, fmt.Sprintf("%s is not healthy: %v", hc.name, err))
   	 }
    }
:
}
Review "relist"
Let's look at more details of the relist function. Specifically, you'll want to watch carefully for the remote process calls and check how to process the pull data, because these parts can easily bottleneck.
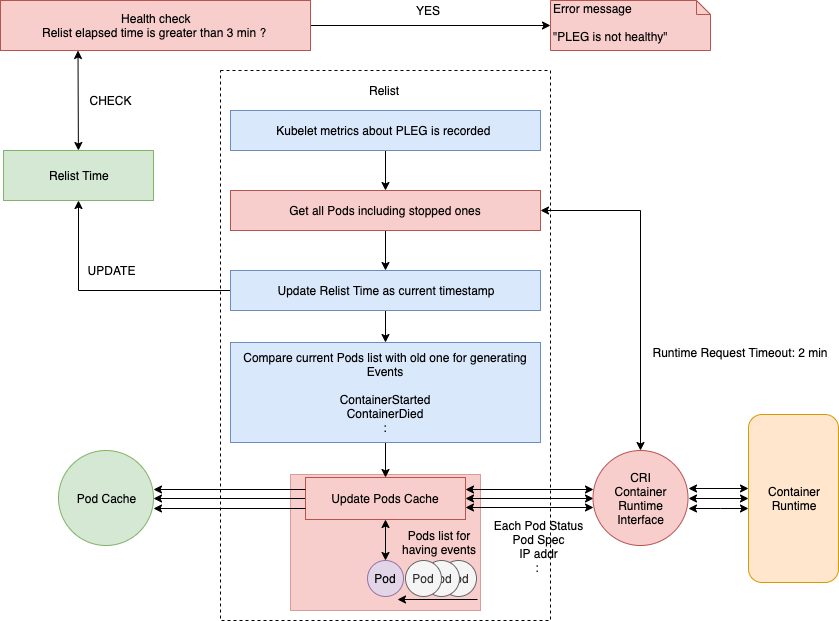
In the above flow chart, you can see the process and implementation of relist. Refer here for full source codes.
Even though relist is set as calling every 1s, it can take more than 1s to finish. If the container runtime responds slowly and/or when there are many container changes in one cycle. So, the next relist will call after the previous one is complete. For example, if relist takes 5s to complete, then next relist time is 6s (1s + 5s).
//// pkg/kubelet/kubelet.go - NewMainKubelet()
// Generic PLEG relies on relisting for discovering container events.
// A longer period means that kubelet will take longer to detect container
// changes and to update pod status. On the other hand, a shorter period
// will cause more frequent relisting (e.g., container runtime operations),
// leading to higher cpu usage.
// Note that even though we set the period to 1s, the relisting itself can
// take more than 1s to finish if the container runtime responds slowly
// and/or when there are many container changes in one cycle.
plegRelistPeriod = time.Second * 1
// NewMainKubelet instantiates a new Kubelet object along with all the required internal modules.
// No initialization of Kubelet and its modules should happen here.
func NewMainKubelet(kubeCfg *kubeletconfiginternal.KubeletConfiguration, ...
:
klet.pleg = pleg.NewGenericPLEG(klet.containerRuntime, plegChannelCapacity, plegRelistPeriod, klet.podCache, clock.RealClock{})
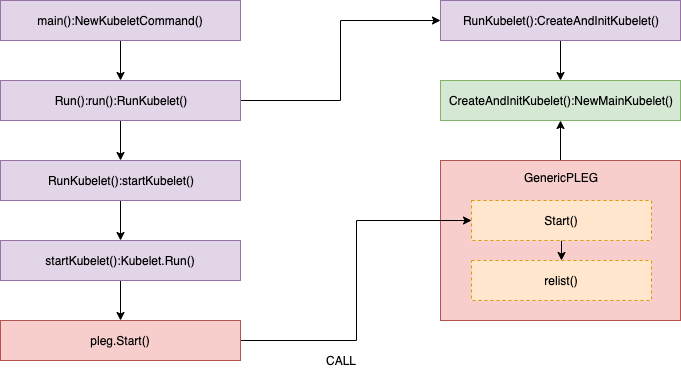
//// pkg/kubelet/pleg/generic.go - Start()
// Start spawns a goroutine to relist periodically.
func (g *GenericPLEG) Start() {
go wait.Until(g.relist, g.relistPeriod, wait.NeverStop)
}
//// pkg/kubelet/pleg/generic.go - relist()
func (g *GenericPLEG) relist() {
... WE WILL REVIEW HERE ...
}
The function process starts by recording some metrics for Kubelet (such as kubelet_pleg_relist_latency_microseconds) and then takes all "Pods" (including stopped pods) list from the container runtime using the CRI interface for getting the current Pods status. This Pods list is used for comparison with previous pods list to check changes and the matched pod-level events are generated along with the changed states.
//// pkg/kubelet/pleg/generic.go - relist()
  :
  // get a current timestamp
  timestamp := g.clock.Now()

  // kubelet_pleg_relist_latency_microseconds for prometheus metrics
    defer func() {
   	 metrics.PLEGRelistLatency.Observe(metrics.SinceInMicroseconds(timestamp))
    }()

  // Get all the pods.
    podList, err := g.runtime.GetPods(true)
  :
The trace "GetPods()" call stack details are below.
//// pkg/kubelet/kuberuntime/kuberuntime_manager.go - GetPods()

// GetPods returns a list of containers grouped by pods. The boolean parameter
// specifies whether the runtime returns all containers including those already
// exited and dead containers (used for garbage collection).
func (m *kubeGenericRuntimeManager) GetPods(all bool) ([]*kubecontainer.Pod, error) {
    pods := make(map[kubetypes.UID]*kubecontainer.Pod)
    sandboxes, err := m.getKubeletSandboxes(all)
:
}

//// pkg/kubelet/kuberuntime/kuberuntime_sandbox.go - getKubeletSandboxes()

// getKubeletSandboxes lists all (or just the running) sandboxes managed by kubelet.
func (m *kubeGenericRuntimeManager) getKubeletSandboxes(all bool) ([]*runtimeapi.PodSandbox, error) {
:
	resp, err := m.runtimeService.ListPodSandbox(filter)
:
}

//// pkg/kubelet/remote/remote_runtime.go - ListPodSandbox()

// ListPodSandbox returns a list of PodSandboxes.
func (r *RemoteRuntimeService) ListPodSandbox(filter *runtimeapi.PodSandboxFilter) ([]*runtimeapi.PodSandbox, error) {
:
	resp, err := r.runtimeClient.ListPodSandbox(ctx, &runtimeapi.ListPodSandboxRequest{
:
	return resp.Items, nil
}
After getting all Pods, the last relist time is updated as current timestamp. In other words, Healthy() can be evaluated by using this updated timestamp.
//// pkg/kubelet/pleg/generic.go - relist()

  // update as a current timestamp
  g.updateRelistTime(timestamp)
As mentioned previously, after comparing current and previous Pods list, every matched pod-level event is generated with the differences/changes between both lists below.
Here generateEvents() generates matched pod-level events (such as ContainerStarted, ContainerDied, and so on), and then the events are updated by updateEvents().
//// pkg/kubelet/pleg/generic.go - relist()

  pods := kubecontainer.Pods(podList)
  g.podRecords.setCurrent(pods)

  // Compare the old and the current pods, and generate events.
  eventsByPodID := map[types.UID][]*PodLifecycleEvent{}
  for pid := range g.podRecords {
	oldPod := g.podRecords.getOld(pid)
	pod := g.podRecords.getCurrent(pid)

	// Get all containers in the old and the new pod.
	allContainers := getContainersFromPods(oldPod, pod)
	for _, container := range allContainers {
  	    events := computeEvents(oldPod, pod, &container.ID)

  	    for _, e := range events {
    	        updateEvents(eventsByPodID, e)
  	    }
        }
  }
The trace computeEvents() call stack details are shown below.
//// pkg/kubelet/pleg/generic.go - computeEvents()

func computeEvents(oldPod, newPod *kubecontainer.Pod, cid *kubecontainer.ContainerID) []*PodLifecycleEvent {
:
	return generateEvents(pid, cid.ID, oldState, newState)
}

//// pkg/kubelet/pleg/generic.go - generateEvents()

func generateEvents(podID types.UID, cid string, oldState, newState plegContainerState) []*PodLifecycleEvent {
:
	glog.V(4).Infof("GenericPLEG: %v/%v: %v -> %v", podID, cid, oldState, newState)
	switch newState {
	case plegContainerRunning:
  	return []*PodLifecycleEvent{{ID: podID, Type: ContainerStarted, Data: cid}}
	case plegContainerExited:
  	return []*PodLifecycleEvent{{ID: podID, Type: ContainerDied, Data: cid}}
	case plegContainerUnknown:
  	return []*PodLifecycleEvent{{ID: podID, Type: ContainerChanged, Data: cid}}
	case plegContainerNonExistent:
  	switch oldState {
  	case plegContainerExited:
    	// We already reported that the container died before.
    	return []*PodLifecycleEvent{{ID: podID, Type: ContainerRemoved, Data: cid}}
  	default:
    	return []*PodLifecycleEvent{{ID: podID, Type: ContainerDied, Data: cid}, {ID: podID, Type: ContainerRemoved, Data: cid}}
  	}
	default:
  	panic(fmt.Sprintf("unrecognized container state: %v", newState))
  }
}
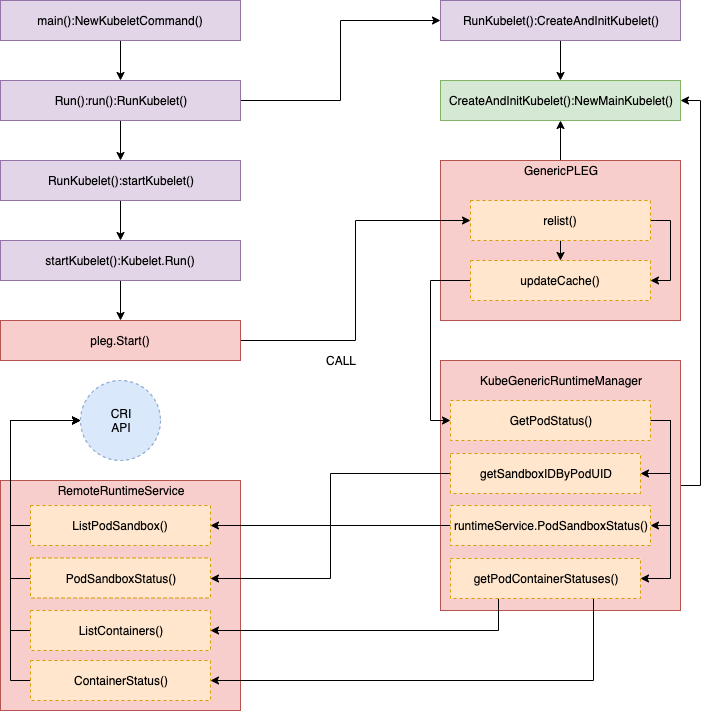
The last part of the process checks whether there are events associated with a pod, and updates the podCache as follows.
updateCache() will inspect each pod and update it one by one in a single loop, so if many pods changed during the same relist period, this process can be a bottleneck. Lastly, updated new pod lifecycle events are sent to eventChannel after updates.
Tracing call stack details are not as important for understanding the process, but some remote clients are called per pod for getting pod inspection information. This may increase latency for proportional to pod numbers, because many pods usually generate many events.
//// pkg/kubelet/pleg/generic.go - relist()

  // If there are events associated with a pod, we should update the
  // podCache.
  for pid, events := range eventsByPodID {
	pod := g.podRecords.getCurrent(pid)
	if g.cacheEnabled() {
  	// updateCache() will inspect the pod and update the cache. If an
  	// error occurs during the inspection, we want PLEG to retry again
  	// in the next relist. To achieve this, we do not update the
  	// associated podRecord of the pod, so that the change will be
  	// detect again in the next relist.
  	// TODO: If many pods changed during the same relist period,
  	// inspecting the pod and getting the PodStatus to update the cache
  	// serially may take a while. We should be aware of this and
  	// parallelize if needed.
  	if err := g.updateCache(pod, pid); err != nil {
    	glog.Errorf("PLEG: Ignoring events for pod %s/%s: %v", pod.Name, pod.Namespace, err)
    	:
  	}
  	:
	}
	// Update the internal storage and send out the events.
	g.podRecords.update(pid)
	for i := range events {
  	// Filter out events that are not reliable and no other components use yet.
  	if events[i].Type == ContainerChanged {
    	   continue
  	}
  	g.eventChannel <- events[i]
     }
  }
The trace updateCache() call stack details are below. Multiple remote requests are called by GetPodStatus() for pod inspection.
//// pkg/kubelet/pleg/generic.go - updateCache()

func (g *GenericPLEG) updateCache(pod *kubecontainer.Pod, pid types.UID) error {
:
    timestamp := g.clock.Now()
    // TODO: Consider adding a new runtime method
    // GetPodStatus(pod *kubecontainer.Pod) so that Docker can avoid listing
    // all containers again.
    status, err := g.runtime.GetPodStatus(pod.ID, pod.Name, pod.Namespace)
  :
    g.cache.Set(pod.ID, status, err, timestamp)
    return err
}

//// pkg/kubelet/kuberuntime/kuberuntime_manager.go - GetPodStatus()

// GetPodStatus retrieves the status of the pod, including the
// information of all containers in the pod that are visible in Runtime.
func (m *kubeGenericRuntimeManager) GetPodStatus(uid kubetypes.UID, name, namespace string) (*kubecontainer.PodStatus, error) {
  podSandboxIDs, err := m.getSandboxIDByPodUID(uid, nil)
  :
    for idx, podSandboxID := range podSandboxIDs {
   	 podSandboxStatus, err := m.runtimeService.PodSandboxStatus(podSandboxID)
	:
    }

    // Get statuses of all containers visible in the pod.
    containerStatuses, err := m.getPodContainerStatuses(uid, name, namespace)
  :
}

//// pkg/kubelet/kuberuntime/kuberuntime_sandbox.go - getSandboxIDByPodUID()

// getPodSandboxID gets the sandbox id by podUID and returns ([]sandboxID, error).
// Param state could be nil in order to get all sandboxes belonging to same pod.
func (m *kubeGenericRuntimeManager) getSandboxIDByPodUID(podUID kubetypes.UID, state *runtimeapi.PodSandboxState) ([]string, error) {
  :
  sandboxes, err := m.runtimeService.ListPodSandbox(filter)
  :
  return sandboxIDs, nil
}

//// pkg/kubelet/remote/remote_runtime.go - PodSandboxStatus()

// PodSandboxStatus returns the status of the PodSandbox.
func (r *RemoteRuntimeService) PodSandboxStatus(podSandBoxID string) (*runtimeapi.PodSandboxStatus, error) {
    ctx, cancel := getContextWithTimeout(r.timeout)
    defer cancel()

    resp, err := r.runtimeClient.PodSandboxStatus(ctx, &runtimeapi.PodSandboxStatusRequest{
   	 PodSandboxId: podSandBoxID,
    })
  :
    return resp.Status, nil
}

//// pkg/kubelet/kuberuntime/kuberuntime_container.go - getPodContainerStatuses()

// getPodContainerStatuses gets all containers' statuses for the pod.
func (m *kubeGenericRuntimeManager) getPodContainerStatuses(uid kubetypes.UID, name, namespace string) ([]*kubecontainer.ContainerStatus, error) {
  // Select all containers of the given pod.
  containers, err := m.runtimeService.ListContainers(&runtimeapi.ContainerFilter{
	LabelSelector: map[string]string{types.KubernetesPodUIDLabel: string(uid)},
  })
  :
  // TODO: optimization: set maximum number of containers per container name to examine.
  for i, c := range containers {
	status, err := m.runtimeService.ContainerStatus(c.Id)
	:
  }
  :
  return statuses, nil
}
We have taken a look at the relist process through related source code and called stack trace. I hope this gives you more details about PLEG and how to update the required data in the process.
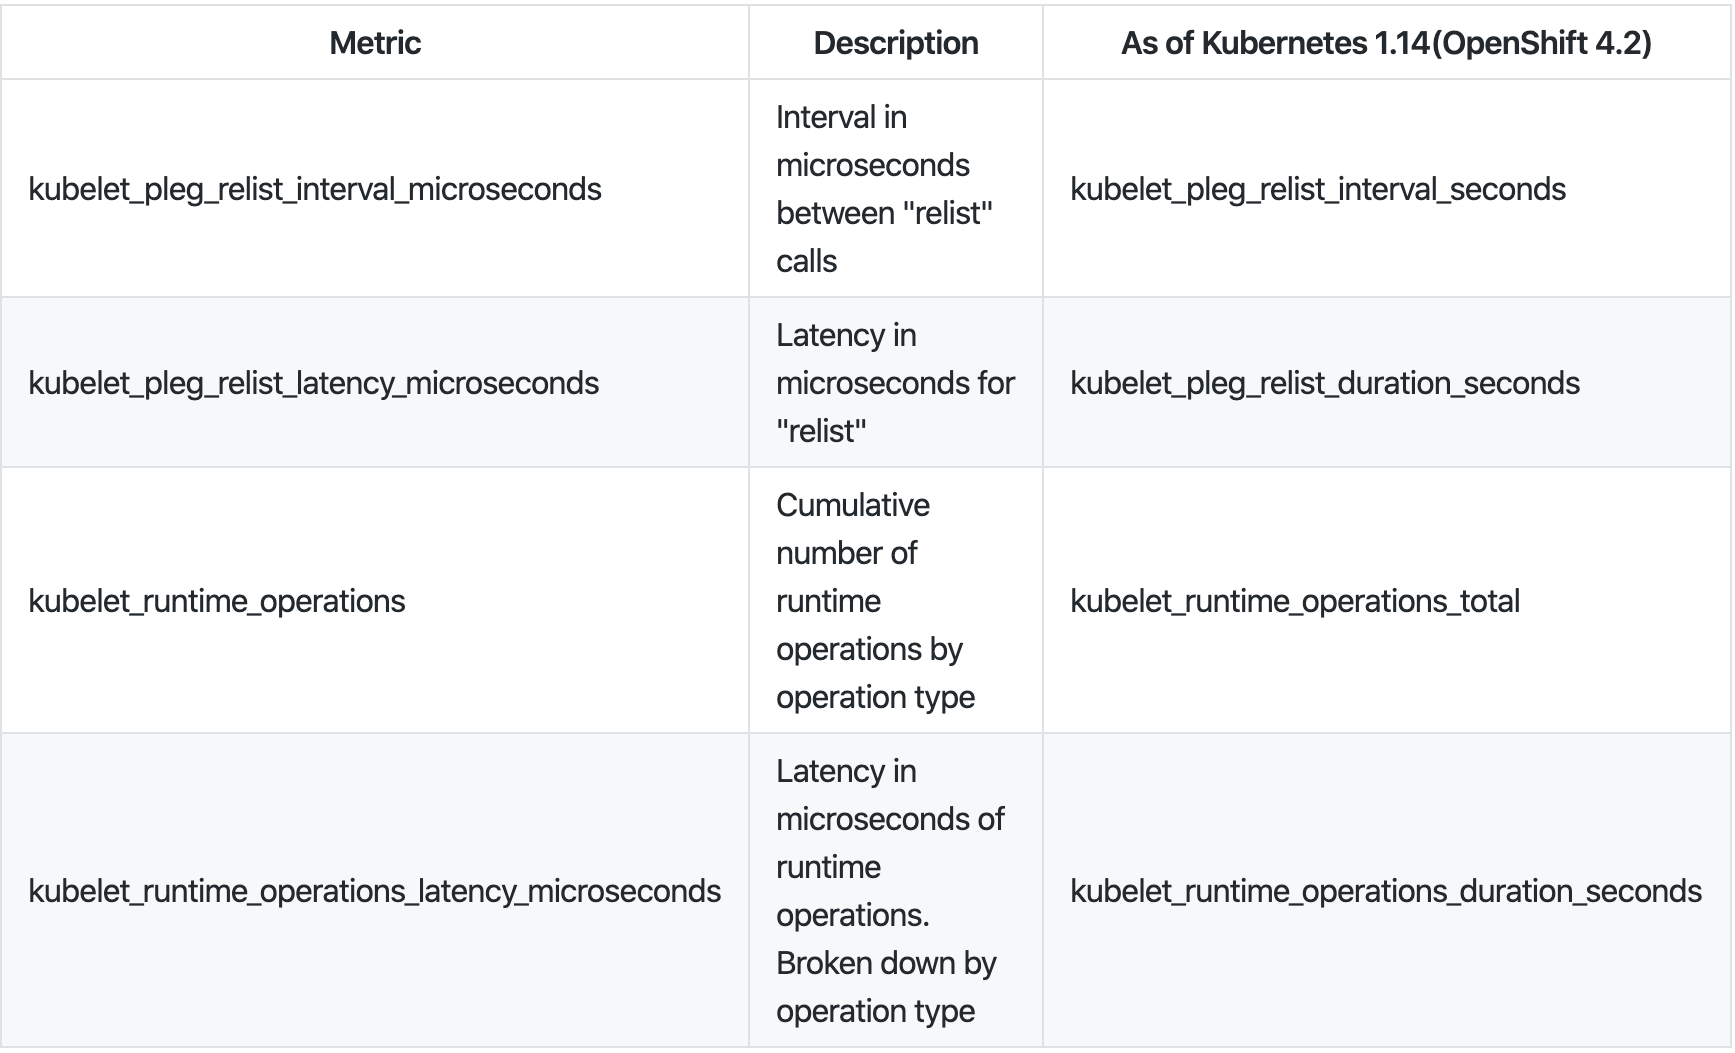
Monitoring "relist"
We can monitor the relist latency using kubelet metrics. The relist period is 1 second, in other words relist complete time (kubelet_pleg_relist_latency_microseconds) + 1 second is kubelet_pleg_relist_interval_microseconds. Additionally, you can monitor how long each operation will take in container runtime. These metrics are also helpful to troubleshoot.
You can take the metrics using https://127.0.0.1:10250/metrics on the node host.
# HELP kubelet_pleg_relist_interval_microseconds Interval in microseconds between relisting in PLEG.
# TYPE kubelet_pleg_relist_interval_microseconds summary
kubelet_pleg_relist_interval_microseconds{quantile="0.5"} 1.054052e+06
kubelet_pleg_relist_interval_microseconds{quantile="0.9"} 1.074873e+06
kubelet_pleg_relist_interval_microseconds{quantile="0.99"} 1.126039e+06
kubelet_pleg_relist_interval_microseconds_count 5146

# HELP kubelet_pleg_relist_latency_microseconds Latency in microseconds for relisting pods in PLEG.
# TYPE kubelet_pleg_relist_latency_microseconds summary
kubelet_pleg_relist_latency_microseconds{quantile="0.5"} 53438
kubelet_pleg_relist_latency_microseconds{quantile="0.9"} 74396
kubelet_pleg_relist_latency_microseconds{quantile="0.99"} 115232
kubelet_pleg_relist_latency_microseconds_count 5106

# HELP kubelet_runtime_operations Cumulative number of runtime operations by operation type.
# TYPE kubelet_runtime_operations counter
kubelet_runtime_operations{operation_type="container_status"} 472
kubelet_runtime_operations{operation_type="create_container"} 93
kubelet_runtime_operations{operation_type="exec"} 1
kubelet_runtime_operations{operation_type="exec_sync"} 533
kubelet_runtime_operations{operation_type="image_status"} 579
kubelet_runtime_operations{operation_type="list_containers"} 10249
kubelet_runtime_operations{operation_type="list_images"} 782
kubelet_runtime_operations{operation_type="list_podsandbox"} 10154
kubelet_runtime_operations{operation_type="podsandbox_status"} 315
kubelet_runtime_operations{operation_type="pull_image"} 57
kubelet_runtime_operations{operation_type="remove_container"} 49
kubelet_runtime_operations{operation_type="run_podsandbox"} 28
kubelet_runtime_operations{operation_type="start_container"} 93
kubelet_runtime_operations{operation_type="status"} 1116
kubelet_runtime_operations{operation_type="stop_container"} 9
kubelet_runtime_operations{operation_type="stop_podsandbox"} 33
kubelet_runtime_operations{operation_type="version"} 564

# HELP kubelet_runtime_operations_latency_microseconds Latency in microseconds of runtime operations. Broken down by operation type.
# TYPE kubelet_runtime_operations_latency_microseconds summary
kubelet_runtime_operations_latency_microseconds{operation_type="container_status",quantile="0.5"} 12117
kubelet_runtime_operations_latency_microseconds{operation_type="container_status",quantile="0.9"} 26607
kubelet_runtime_operations_latency_microseconds{operation_type="container_status",quantile="0.99"} 27598
kubelet_runtime_operations_latency_microseconds_count{operation_type="container_status"} 486
kubelet_runtime_operations_latency_microseconds{operation_type="list_containers",quantile="0.5"} 29972
kubelet_runtime_operations_latency_microseconds{operation_type="list_containers",quantile="0.9"} 47907
kubelet_runtime_operations_latency_microseconds{operation_type="list_containers",quantile="0.99"} 80982
kubelet_runtime_operations_latency_microseconds_count{operation_type="list_containers"} 10812
kubelet_runtime_operations_latency_microseconds{operation_type="list_podsandbox",quantile="0.5"} 18053
kubelet_runtime_operations_latency_microseconds{operation_type="list_podsandbox",quantile="0.9"} 28116
kubelet_runtime_operations_latency_microseconds{operation_type="list_podsandbox",quantile="0.99"} 68748
kubelet_runtime_operations_latency_microseconds_count{operation_type="list_podsandbox"} 10712
kubelet_runtime_operations_latency_microseconds{operation_type="podsandbox_status",quantile="0.5"} 4918
kubelet_runtime_operations_latency_microseconds{operation_type="podsandbox_status",quantile="0.9"} 15671
kubelet_runtime_operations_latency_microseconds{operation_type="podsandbox_status",quantile="0.99"} 18398
kubelet_runtime_operations_latency_microseconds_count{operation_type="podsandbox_status"} 323
:
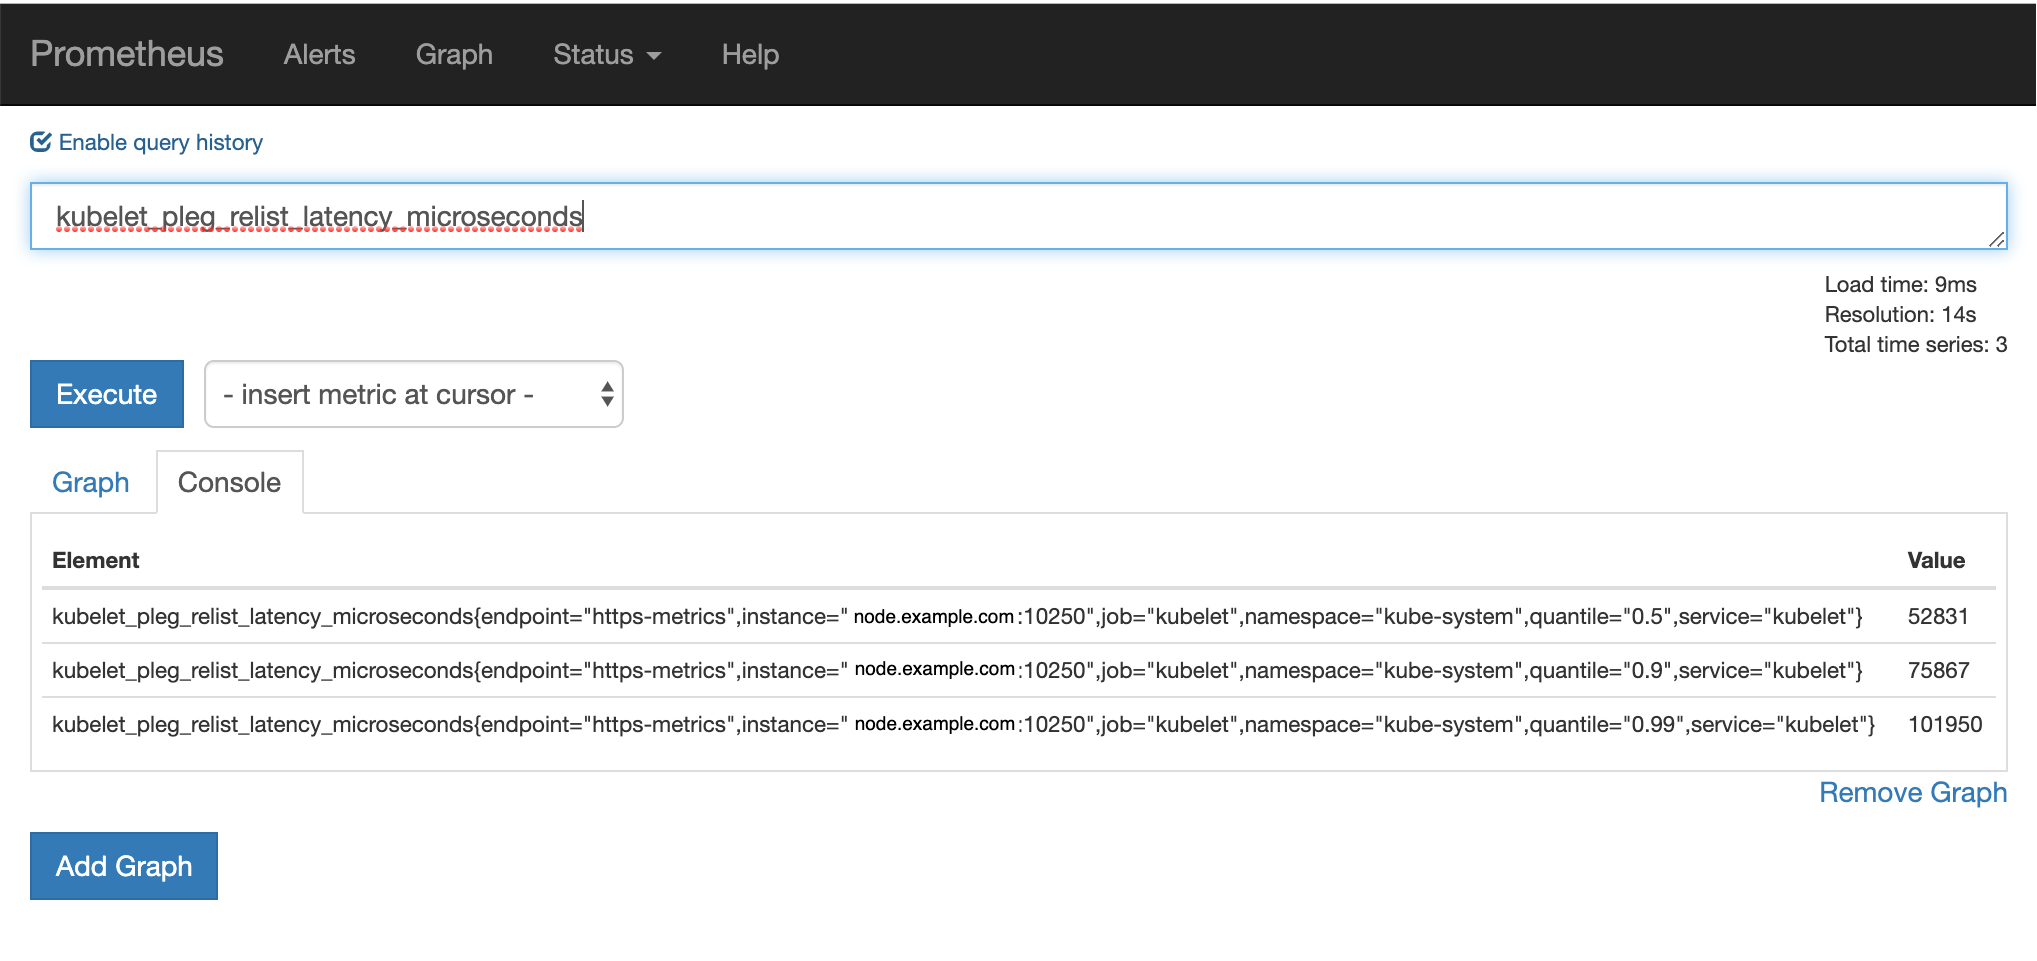
The above metrics can monitor using Prometheus by default on Red Hat OpenShift.
Conclusions
In my experience, "PLEG is not healthy" can happen due to various causes, and I believe there are many potential causes we have not run into yet. I'd like to introduce the following causes for your additional information.
- Container runtime latency or timeout (performance degradation, deadlock, bugs...) during remote requests.
- Too many running pods for host resources or too many running pods on high-spec hosts to complete the relist within 3 min. As seen in this article, events and latency are proportional to the pod numbers regardless of host resources.
- Deadlock in PLEG relist has been fixed as of Kubernetes 1.14 (OpenShift 4.2).
- CNI bugs when getting a pod network status.