In modern cloud-native environments, distributed tracing is essential for maintaining visibility into complex microservices. However, deploying a complete, end-to-end tracing stack on Red Hat OpenShift has traditionally required significant manual effort. To address this, the cluster observability operator now introduces the ObservabilityInstaller custom resource (CR). This new capability automates the deployment and integration of the entire tracing ecosystem, moving from a fragmented manual process to a unified, declarative installation.
Traditional multistep installation
Previously, administrators had to install each operator individually, provision their respective custom resources, manually configure role-based access control (RBAC), and link the OpenTelemetry collector to the storage backend. This multistep workflow was not only time consuming but also increased the risk of configuration errors.
A production-ready tracing stack on OpenShift relies on three foundational components:
- Red Hat build of OpenTelemetry manages data collection and ingestion.
- Tempo operator provides scalable, high-performance trace storage.
- Cluster observability operator delivers the integrated visualization and UI components.
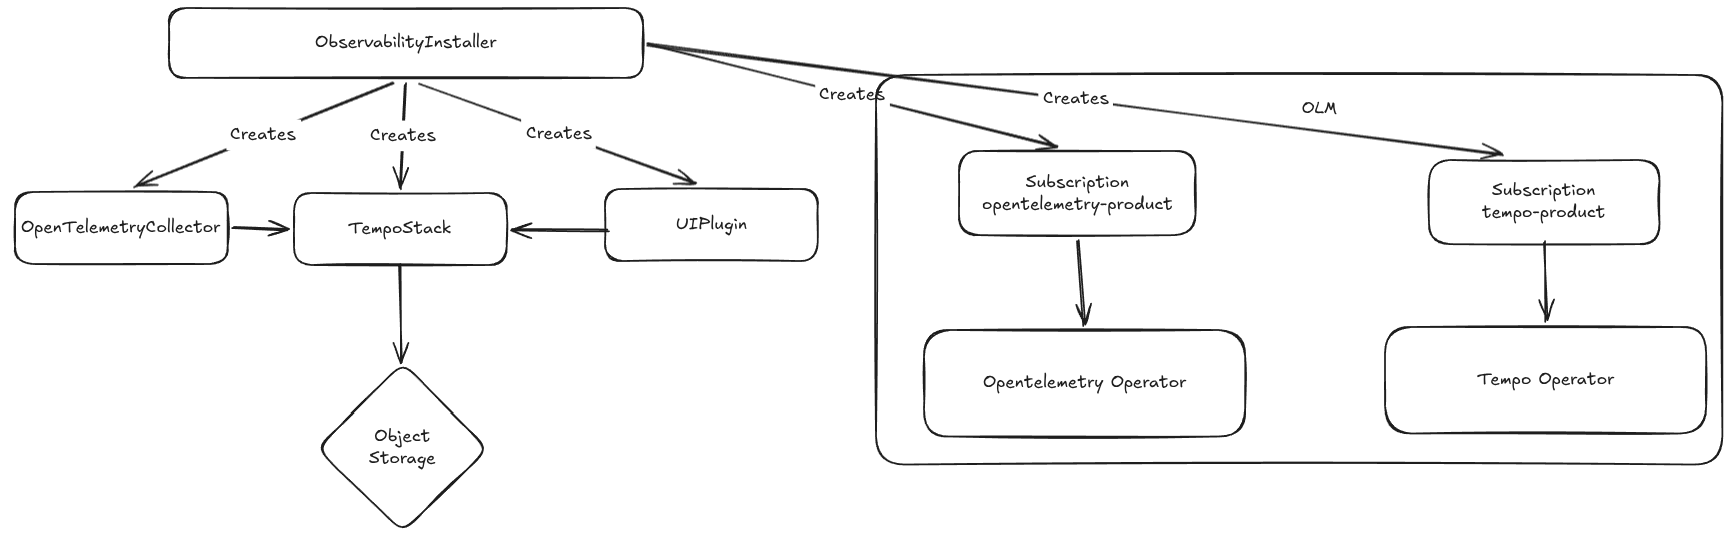
Figure 1 illustrates the high-level architecture including all components.
Streamline deployment with ObservabilityInstaller
The ObservabilityInstaller CR acts as a high-level orchestrator. It simplifies the process by automating the provisioning of the OpenTelemetryCollector, TempoStack, and the tracing UIPlugin.
Notably, the operator can also manage the installation of the prerequisite operators themselves. If they are already present on the cluster, the ObservabilityInstaller intelligently skips that step and proceeds to configuration.
To begin the installation of the end-to-end tracing system, we must first set up an S3-compatible object storage to serve as the backend for Tempo. For this purpose, we will utilize Red Hat OpenShift Data Foundation, specifically leveraging the lightweight multicluster gateway component.
apiVersion: v1
kind: Namespace
metadata:
  name: openshift-storage
  labels:
    openshift.io/cluster-monitoring: "true"
---
apiVersion: operators.coreos.com/v1
kind: OperatorGroup
metadata:
  name: openshift-storage-operatorgroup
  namespace: openshift-storage
spec:
  targetNamespaces:
    - openshift-storage
---
apiVersion: operators.coreos.com/v1alpha1
kind: Subscription
metadata:
  name: mcg-operator
  namespace: openshift-storage
spec:
  channel: stable-4.19
  installPlanApproval: Automatic
  name: mcg-operator
  source: redhat-operators
  sourceNamespace: openshift-marketplace
---
apiVersion: noobaa.io/v1alpha1
kind: NooBaa
metadata:
  name: noobaa
  namespace: openshift-storage
spec:
  dbResources:
    requests:
      cpu: "0.1"
      memory: 1Gi
  dbType: postgres
  coreResources:
    requests:
      cpu: "0.1"
      memory: 1Gi
The NooBaa CR provisions the object storage backed by PVs with cluster’s default storage class. We can customize the persistent volumes with BackingStore and BucketClass CRs and use the Postgres DB to store metadata.
After deploying the object storage, we can continue by deploying an end-to-end distributed tracing system. Do not forget to update the accessKeyID. The command to get the updated ID is provided in the manifest.
apiVersion: v1
kind: Namespace
metadata:
  name: observability
---
# ObjectBucketClaim for tracing storage
apiVersion: objectbucket.io/v1alpha1
kind: ObjectBucketClaim
metadata:
  name: tracing-bucket
  namespace: observability
spec:
  bucketName: tracing-bucket
  storageClassName: openshift-storage.noobaa.io
---
apiVersion: v1
kind: ConfigMap
metadata:
  name: openshift-service-ca
  namespace: observability
  annotations:
    service.beta.openshift.io/inject-cabundle: "true"
data: {}
---
apiVersion: observability.openshift.io/v1alpha1
kind: ObservabilityInstaller
metadata:
  name: tracing
  namespace: observability
spec:
  capabilities:
    tracing:
      enabled: true
      operators:
        install: true
      storage:
        objectStorage:
          s3:
            endpoint: https://s3.openshift-storage.svc:443
            bucket: tracing-bucket
            accessKeyID: alpBATHU5yrA4oQJdwv3  # oc get secret tracing-bucket -n observability -o jsonpath='{.data.AWS_ACCESS_KEY_ID}' | base64 -d
            accessKeySecret:
              name: tracing-bucket
              key: AWS_SECRET_ACCESS_KEY
          tls:
            caConfigMap:
              name: openshift-service-ca
              key: service-ca.crt
The tracing.enabled command instructs the cluster observability to provision the tracing infrastructure. The operators.install command ensures the installation of the Red Hat build of OpenTelemetry and Tempo operator.
After applying the manifest, the cluster observability begins provisioning the necessary objects:
NAME READY STATUS RESTARTS AGE
tempo-tracing-compactor-56b4f5f678-k2t5p 1/1 Running 0 83s
tempo-tracing-distributor-b548d48bb-hwxqt 1/1 Running 0 84s
tempo-tracing-gateway-5698c9c5fc-gwrdc 2/2 Running 0 83s
tempo-tracing-ingester-0 1/1 Running 0 83s
tempo-tracing-querier-644d6bd4bf-sdtd9 1/1 Running 0 83s
tempo-tracing-query-frontend-7fb779f696-gck2d 1/1 Running 0 83s
tracing-collector-675d5cf48f-bdwtg 1/1 Running 0 82s
And services:
tempo-tracing-compactor: 7946/TCP, 3200/TCP
tempo-tracing-distributor: 4318/TCP, 4317/TCP, 3200/TCP
tempo-tracing-gateway: 8090/TCP, 8081/TCP, 8080/TCP
tempo-tracing-gossip-ring: 7946/TCP
tempo-tracing-ingester: 3200/TCP, 9095/TCP
tempo-tracing-querier: 7946/TCP, 3200/TCP, 9095/TCP
tempo-tracing-query-frontend: 3200/TCP, 9095/TCP
tempo-tracing-query-frontend-discovery: 3200/TCP, 9095/TCP, 9096/TCP
tracing-collector: 14250/TCP, 4317/TCP, 4318/TCP, 14268/TCP, 6831/UDP, 6832/UDP, 9411/TCP
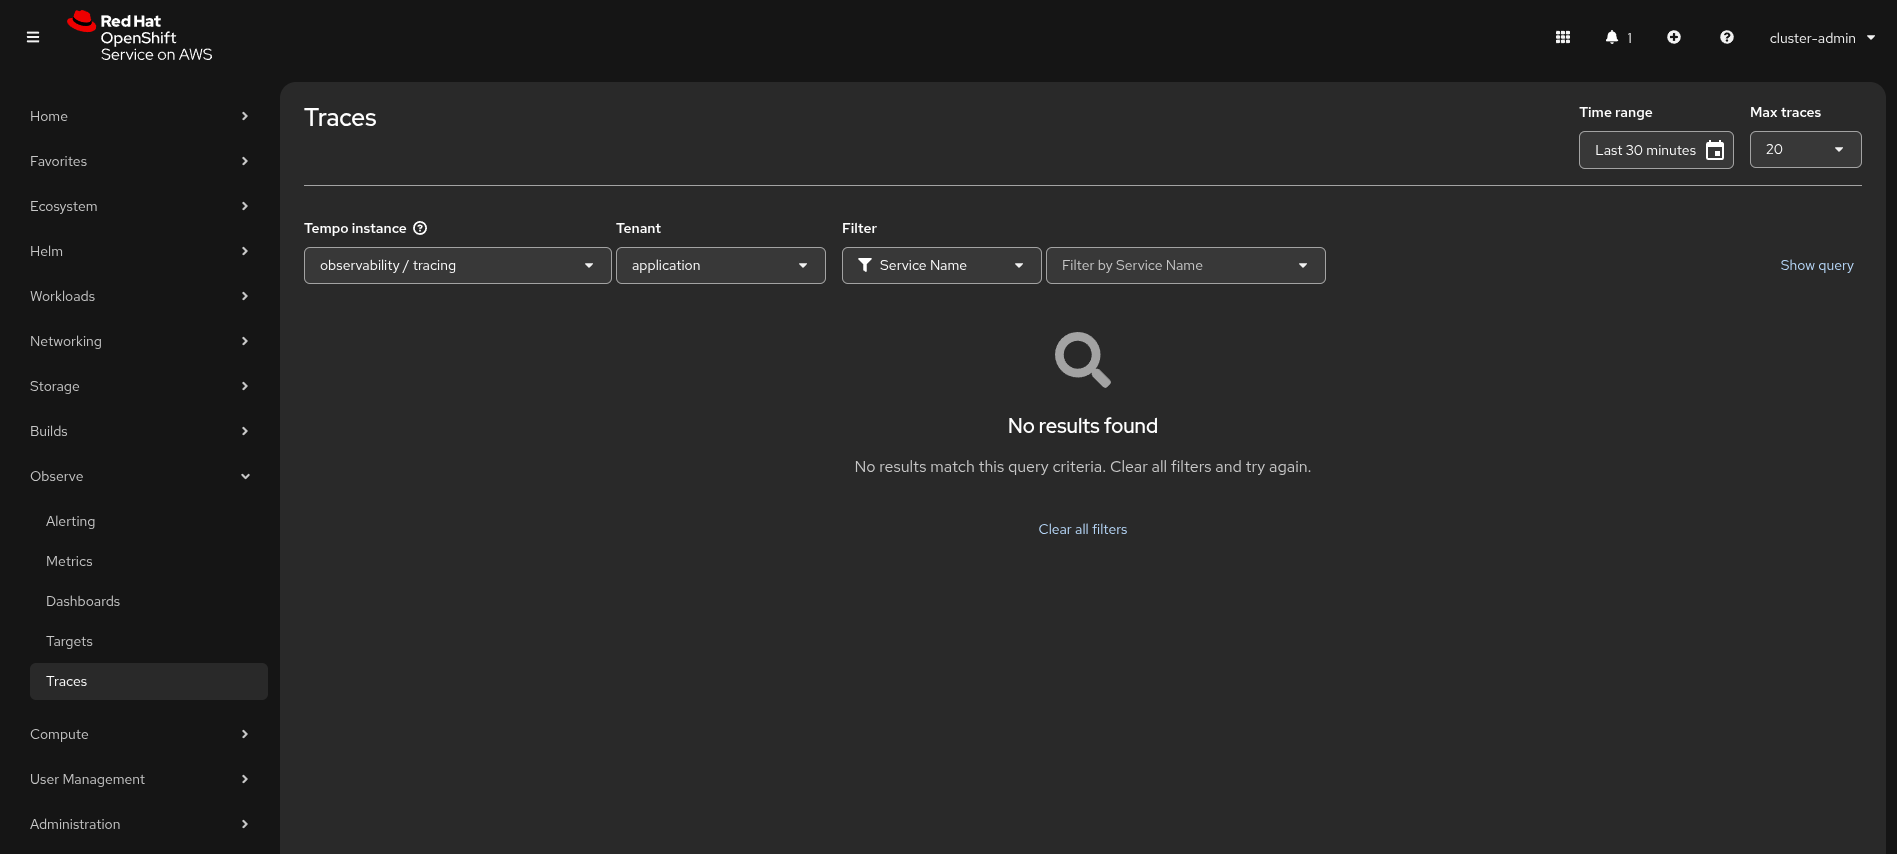
tracing-collector-headless: 14250/TCP, 4317/TCP, 4318/TCP, 14268/TCP, 6831/UDP, 6832/UDP, 9411/TCPAfter installation, there is no need for manual UI configuration. Simply navigate to the OpenShift console, go to the Observe menu, and select Traces. Your workload traces will be accessible under the application tenant.
The services created are as follows:
tempo-tracing-compactor:              7946/TCP, 3200/TCP
tempo-tracing-distributor:            4318/TCP, 4317/TCP, 3200/TCP
tempo-tracing-gateway:                8090/TCP, 8081/TCP, 8080/TCP
tempo-tracing-gossip-ring:            7946/TCP
tempo-tracing-ingester:               3200/TCP, 9095/TCP
tempo-tracing-querier:                7946/TCP, 3200/TCP, 9095/TCP
tempo-tracing-query-frontend:         3200/TCP, 9095/TCP
tempo-tracing-query-frontend-discovery: 3200/TCP, 9095/TCP, 9096/TCP
tracing-collector:                    14250/TCP, 4317/TCP, 4318/TCP, 14268/TCP, 6831/UDP, 6832/UDP, 9411/TCP
tracing-collector-headless:           14250/TCP, 4317/TCP, 4318/TCP, 14268/TCP, 6831/UDP, 6832/UDP, 9411/TCP
Figure 2 shows tracing the UI plug-in with the provisioned Tempo instance.
Object storage support
In our example, we used a multicloud gateway from OpenShift Data Foundation which provides S3 APIs. However, the installer CR also supports other object storage types, such as Microsoft Azure Blob Storage and Google Cloud Storage.
The following is an Azure example:
apiVersion: observability.openshift.io/v1alpha1
kind: ObservabilityInstaller
metadata:
  name: tracing
  namespace: observability
spec:
  capabilities:
    tracing:
      enabled: true
      operators:
        install: true
      storage:
        objectStorage:
          azure:
           container:
           accountName:
           accountKeySecret:
             name:
             key:
Learn more
The ObservabilityInstaller is designed to accelerate time-to-value for teams implementing distributed tracing. It provides an optimized out-of-the-box experience while maintaining flexibility for power users. While the cluster observability manages the core configuration, administrators can still modify some underlying fields in the generated CRs (e.g., replica counts or resource requests) to meet specific production requirements.
Check out these resources for more information: