Redhat Developers  Logo
  • Products

    Featured

    • Red Hat Enterprise Linux
      Red Hat Enterprise Linux Icon
    • Red Hat OpenShift AI
      Red Hat OpenShift AI
    • Red Hat Enterprise Linux AI
      Linux icon inside of a brain
    • Image mode for Red Hat Enterprise Linux
      RHEL image mode
    • Red Hat OpenShift
      Openshift icon
    • Red Hat Ansible Automation Platform
      Ansible icon
    • Red Hat Developer Hub
      Developer Hub
    • View All Red Hat Products
    • Linux

      • Red Hat Enterprise Linux
      • Image mode for Red Hat Enterprise Linux
      • Red Hat Universal Base Images (UBI)
    • Java runtimes & frameworks

      • JBoss Enterprise Application Platform
      • Red Hat build of OpenJDK
    • Kubernetes

      • Red Hat OpenShift
      • Microsoft Azure Red Hat OpenShift
      • Red Hat OpenShift Virtualization
      • Red Hat OpenShift Lightspeed
    • Integration & App Connectivity

      • Red Hat Build of Apache Camel
      • Red Hat Service Interconnect
      • Red Hat Connectivity Link
    • AI/ML

      • Red Hat OpenShift AI
      • Red Hat Enterprise Linux AI
    • Automation

      • Red Hat Ansible Automation Platform
      • Red Hat Ansible Lightspeed
    • Developer tools

      • Red Hat Trusted Software Supply Chain
      • Podman Desktop
      • Red Hat OpenShift Dev Spaces
    • Developer Sandbox

      Developer Sandbox
      Try Red Hat products and technologies without setup or configuration fees for 30 days with this shared Openshift and Kubernetes cluster.
    • Try at no cost
  • Technologies

    Featured

    • AI/ML
      AI/ML Icon
    • Linux
      Linux Icon
    • Kubernetes
      Cloud icon
    • Automation
      Automation Icon showing arrows moving in a circle around a gear
    • View All Technologies
    • Programming Languages & Frameworks

      • Java
      • Python
      • JavaScript
    • System Design & Architecture

      • Red Hat architecture and design patterns
      • Microservices
      • Event-Driven Architecture
      • Databases
    • Developer Productivity

      • Developer productivity
      • Developer Tools
      • GitOps
    • Secure Development & Architectures

      • Security
      • Secure coding
    • Platform Engineering

      • DevOps
      • DevSecOps
      • Ansible automation for applications and services
    • Automated Data Processing

      • AI/ML
      • Data Science
      • Apache Kafka on Kubernetes
      • View All Technologies
    • Start exploring in the Developer Sandbox for free

      sandbox graphic
      Try Red Hat's products and technologies without setup or configuration.
    • Try at no cost
  • Learn

    Featured

    • Kubernetes & Cloud Native
      Openshift icon
    • Linux
      Rhel icon
    • Automation
      Ansible cloud icon
    • Java
      Java icon
    • AI/ML
      AI/ML Icon
    • View All Learning Resources

    E-Books

    • GitOps Cookbook
    • Podman in Action
    • Kubernetes Operators
    • The Path to GitOps
    • View All E-books

    Cheat Sheets

    • Linux Commands
    • Bash Commands
    • Git
    • systemd Commands
    • View All Cheat Sheets

    Documentation

    • API Catalog
    • Product Documentation
    • Legacy Documentation
    • Red Hat Learning

      Learning image
      Boost your technical skills to expert-level with the help of interactive lessons offered by various Red Hat Learning programs.
    • Explore Red Hat Learning
  • Developer Sandbox

    Developer Sandbox

    • Access Red Hat’s products and technologies without setup or configuration, and start developing quicker than ever before with our new, no-cost sandbox environments.
    • Explore Developer Sandbox

    Featured Developer Sandbox activities

    • Get started with your Developer Sandbox
    • OpenShift virtualization and application modernization using the Developer Sandbox
    • Explore all Developer Sandbox activities

    Ready to start developing apps?

    • Try at no cost
  • Blog
  • Events
  • Videos

Linux on Arm (aarch64) servers: Can they handle datacenter-level networks?

December 10, 2024
Marcelo Ricardo Leitner
Related topics:
LinuxApplication modernization
Related products:
Red Hat Enterprise Linux

Share:

    Arm chips are often thought of as chips for small and dedicated embedded systems, but that hasn’t been the case for a while. In this series, we’ll review a couple of benchmarks done on server grade Arm aarch64 chips.

    To make things clear from the get-go, "Arm" is NOT an architecture or a chip vendor, though it's often confused for these things. Actually, it’s the name of the intellectual property (IP) provider for many IPs, including the architecture in question, "aarch64". So, the actual architecture name is "aarch64", and similarly, another well known architecture in datacenters is "x86_64".

    Server and chip overview

    In this series we will use two types of servers: one that will serve as a traffic generator and the other as the device under test (DUT), which is an aarch64 system. The DUT has 80 Neoverse-N1 cores clocked at 3.00GHz, 250GB of memory DDR4 RDIMM 3200 MHz and Mellanox Technologies MT2892 Family [ConnectX-6 Dx] network adapter. The traffic generator is another server grade system, which we’ll tell if it became the bottleneck for the test.

    As CPU cache sizes are very impactful on performance, we have a handy summary table below for the CPU type we used.

    Cache sizes

    Neoverse-N1

    L1

    64Ki Instruction and 64Ki Data per Core

    L2

    1 MiB per Core

    SLC/L3

    32 MiB

    Tests and test topology

    We have two servers. One is used as a traffic generator and the DUT server. For the sake of narrowing our focus, we will only report the results from the DUT. They are connected to a 100Gbps switch that has its ports isolated by a VLAN.

    For the DUT server, Collaborative Processor Performance Control (CPPC) and Lower Power Idle (LPI) are disabled in BIOS.

    The kernel is configured for 4k page size and the kernel cmdline for aarch64 is as follows:

    intel_iommu=on default_hugepagesz=1G hugepagesz=1G hugepages=16 pci=realloc isolcpus=55,57,119,121 iommu.passthrough=1

    The tests require two cores: one for the application and another for the NIC interrupts. The cmdline specifies two other cores that don’t exist, and that’s just to ease the configuration.

    It’s worth highlighting that iomem.strict was used with the default value. For the DUT, it’s 1.

    Write allocation to system level cache (SLC) was enabled with:

    # setpci -s 0000:00:01.0 8e8.l=78007800

    We will use this configuration for all the posts on this series, unless advised, while varying the connectivity in terms of logical network interfaces. That is, add tunneling, OvS, etc. and some other aspects, such as Adaptive Interrupt Coalescing (AIC) and power savings.

    Regarding tests, we’ll run iperf3 TCP single stream and UDP with big (MTU-sized) and small (60 bytes) packets. We’ll analyze the performance observed and CPU usage. All of them run for 60 seconds, ten times.

    The basics

    The most simple configuration for a server is to use the NIC without any extra layer on it. That is, bare Ethernet. That’s what we will cover in this article. We will only turn AIC off in ethtool which is a known tuning for performance and also to make tests more stable.

    To turn AIC off, we use:

    # ethtool -C <interface> adaptive-rx off adaptive-tx off

    Tests with ELN

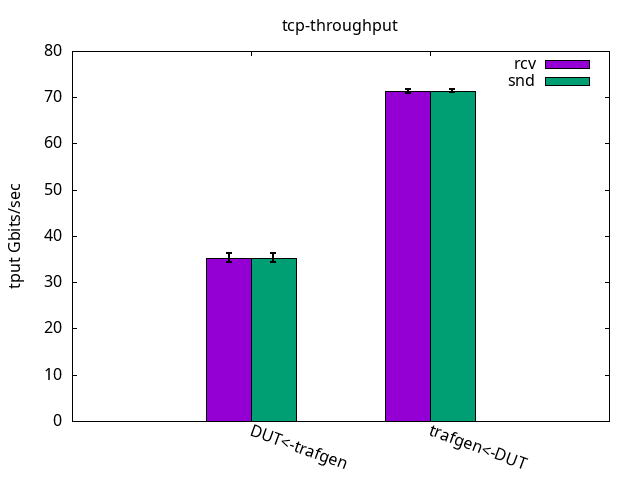
    With an ELN kernel, kernel-6.9.0-0.rc4.37.eln136, the results are the following. Each pair of bars is a test. For example, in the first pair, the generated traffic is in green while the received traffic by the DUT is in purple. For TCP they are the same but they will vary on UDP tests. The error markers are stdev out of 10 runs of 1 minute.

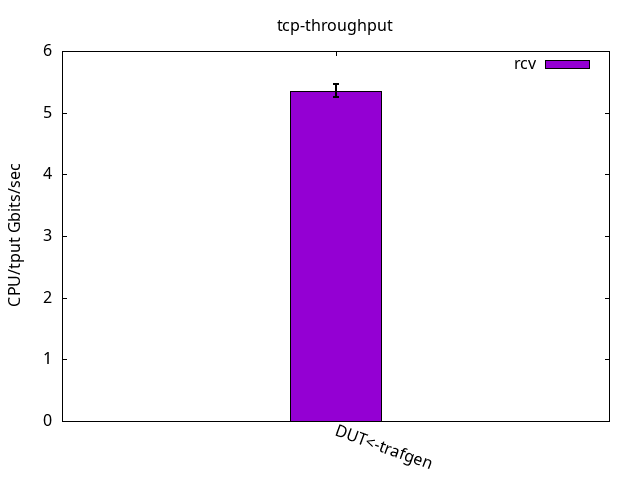
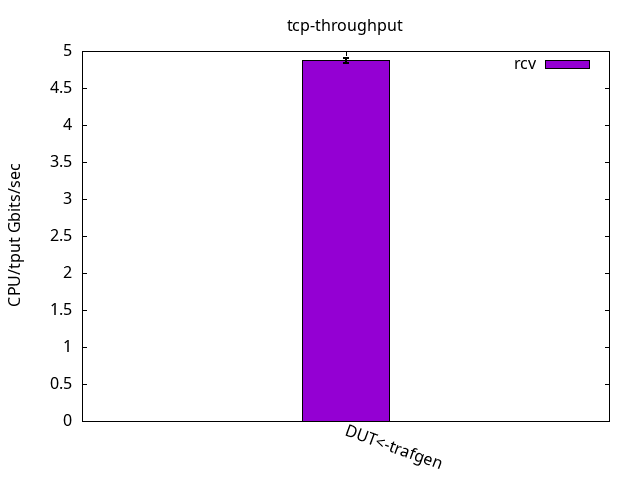
    For the CPU/throughput graphs, the total CPU consumption for both cores, application and IRQ, are summed (theoretical maximum of 200 then) and then divided by the observed throughput. The lesser the number, the better (less CPU used to pump the same amount of traffic).

    TCP throughput

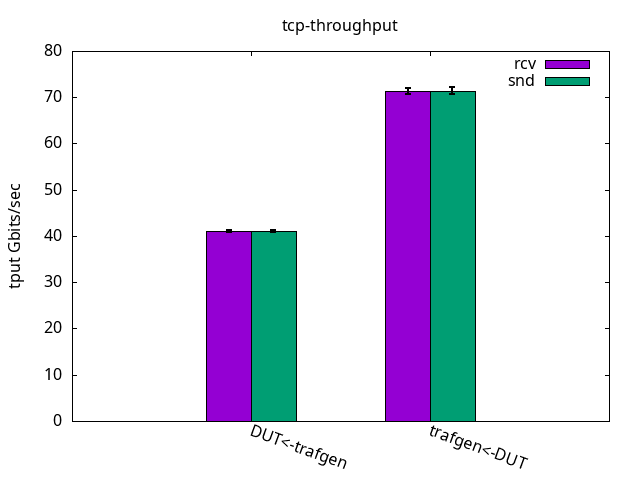
    TCP tests were always limited by the receiver CPU usage, including on the traffic generator side when the DUT was sending traffic. The DUT was able to send 71.44+-0.40Gbps and to receive 35.28+-0.96Gbps, as you can observe in the following graph (see Figure 1).

    DUT sends 71Gbps and receives 35Gbps
    Figure 1: TCP throughput.

    Figures 2 and 3 below details the CPU utilization.

    Bar graph showing almost 5.5% of CPU usage per Gbits/sec
    Figure 2: DUT CPU % per throughput on receive.
                     DUT rcv
                        CPU App %usr     2.7+-0.5
                        CPU App %sys     86.2+-1.6
                        CPU App %irq     0.0+-0.0
                        CPU App %soft    0.0+-0.0
                        CPU App %idle    11.1+-1.3
                        CPU S-IRQ %usr   0.0+-0.0
                        CPU S-IRQ %sys   0.1+-0.0
                        CPU S-IRQ %irq   0.0+-0.0
                        CPU S-IRQ %soft  99.9+-0.1
                        CPU S-IRQ %idle  0.1+-0.0
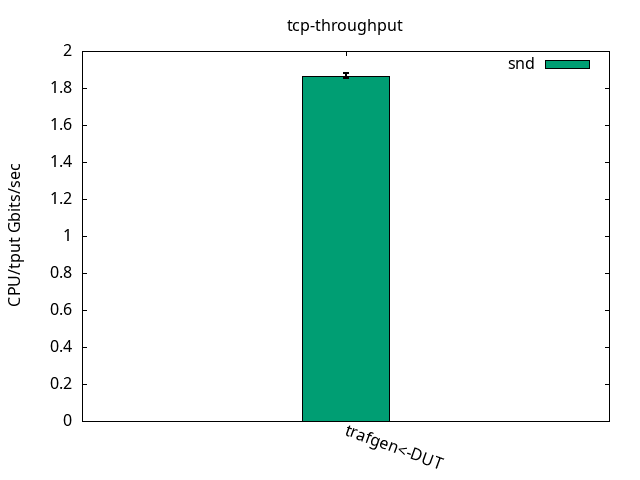
    Bar graph showing 1.8% of CPU usage per TX Gbits/sec
    Figure 3: DUT CPU % per throughput on send.
                     DUT snd
                        CPU App %usr     1.1+-0.1
                        CPU App %sys     90.0+-0.9
                        CPU App %irq     0.0+-0.0
                        CPU App %soft    0.0+-0.0
                        CPU App %idle    8.8+-1.0
                        CPU S-IRQ %usr   0.0+-0.0
                        CPU S-IRQ %sys   0.2+-0.3
                        CPU S-IRQ %irq   0.0+-0.0
                        CPU S-IRQ %soft  42.1+-0.9
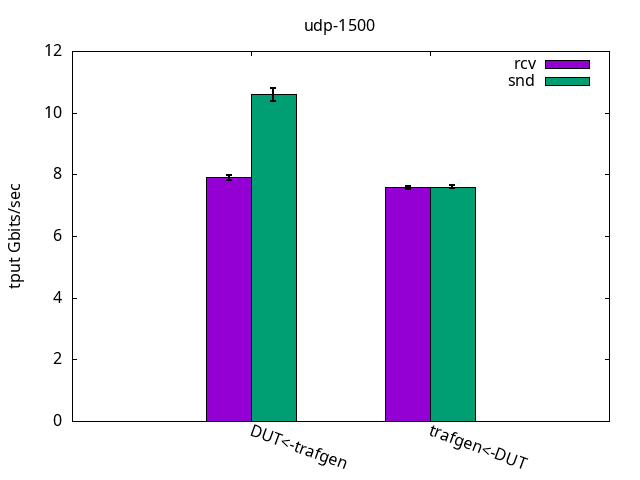
                        CPU S-IRQ %idle  57.8+-1.0

    UDP 1500 bytes

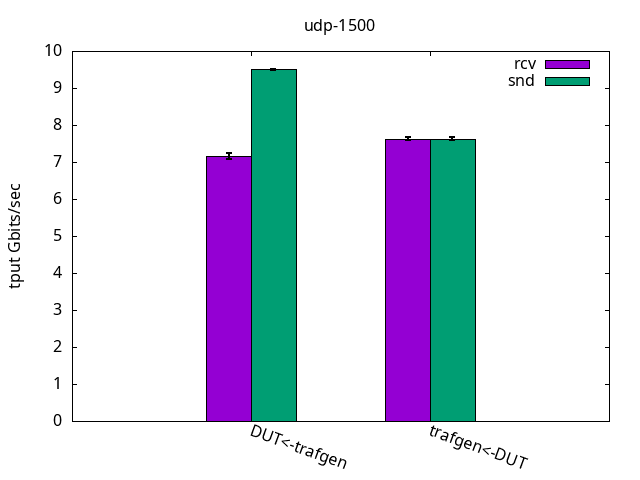
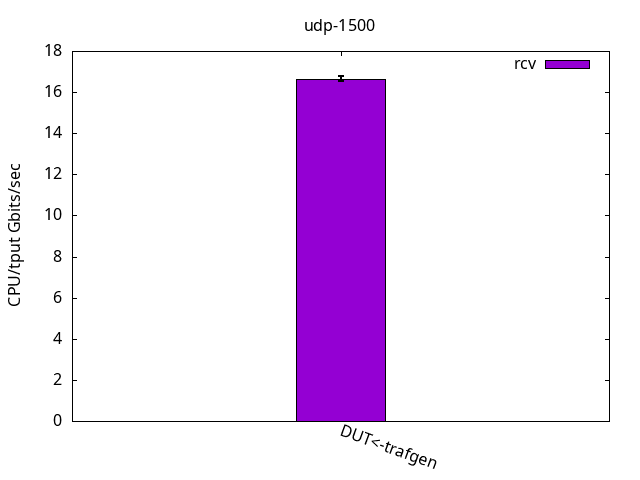
    UDP is different from TCP because it doesn’t have accelerations like TCP Segmentation Offload (TSO) and doesn’t pace itself. That means sender and receiver now can walk at their own pace, which is shown in Figure 4. Here, for sending and also receiving, the DUT performance was limited by the application CPU only, while it still had some CPU %idle time left on the IRQ CPU, as shown in Figures 5 and 6 and their respective tables.
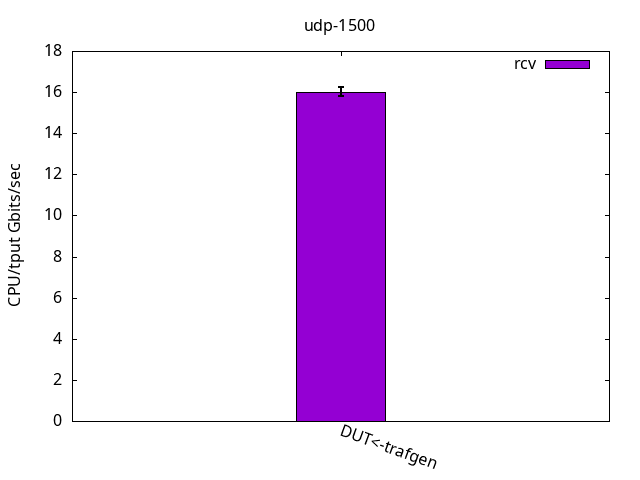
    Bar graph showing trafgen and DUT throughputs, with DUT being able to send and receive nearly almost 8Gbps
    Figure 4: UDP 1500 bytes throughput.
    ELN UDP 1500 rx cpu usage showing 16% of CPU per Gbps
    Figure 5: DUT CPU % per throughput on receive.
                     DUT rcv
                        CPU App %usr     14.3+-0.5
                        CPU App %sys     85.7+-0.5
                        CPU App %irq     0.0+-0.0
                        CPU App %soft    0.0+-0.0
                        CPU App %idle    0.0+-0.0
                        CPU S-IRQ %usr   0.1+-0.3
                        CPU S-IRQ %sys   0.1+-0.2
                        CPU S-IRQ %irq   0.0+-0.0
                        CPU S-IRQ %soft  26.4+-1.6
                        CPU S-IRQ %idle  73.4+-1.7
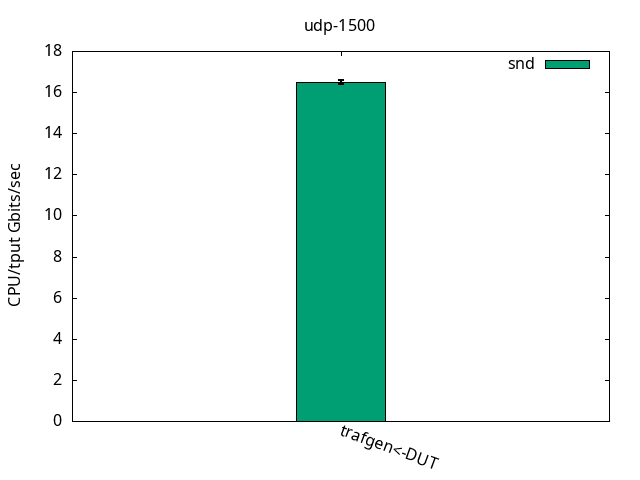
    ELN UDP 1500 tx cpu usage showing 16% of CPU per Gbps
    Figure 6: DUT CPU % per throughput on send.
                     DUT snd
                        CPU App %usr     7.3+-0.5
                        CPU App %sys     92.6+-0.5
                        CPU App %irq     0.0+-0.0
                        CPU App %soft    0.0+-0.0
                        CPU App %idle    0.1+-0.0
                        CPU S-IRQ %usr   0.1+-0.2
                        CPU S-IRQ %sys   0.0+-0.0
                        CPU S-IRQ %irq   0.0+-0.0
                        CPU S-IRQ %soft  25.3+-0.6
                        CPU S-IRQ %idle  74.6+-0.8

    UDP 60 bytes

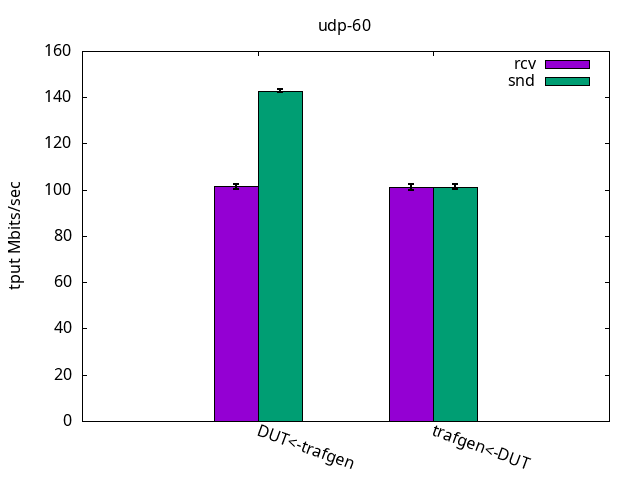
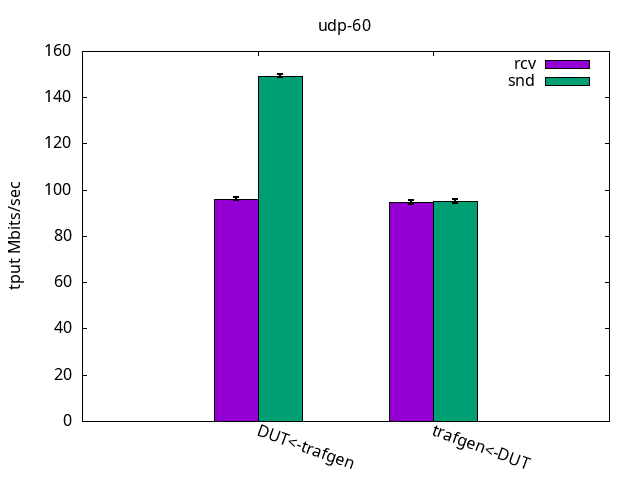
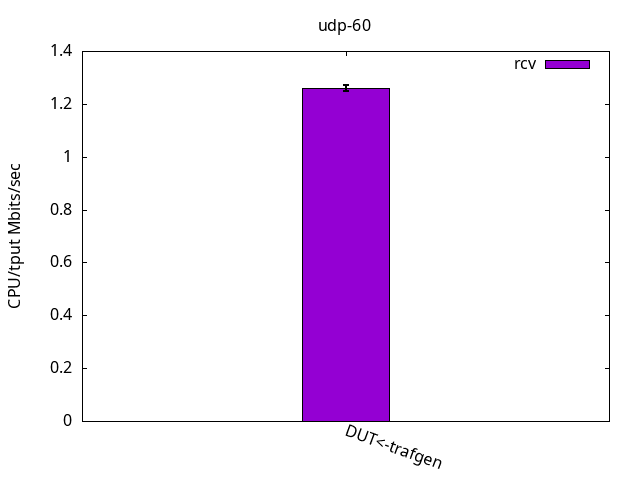
    This test is interesting because it’s often viewed as an "ops/sec" (operations per second). As the packets are very small, it puts aside the time spent copying payload and is basically testing how many packets per second the system can handle if it weren’t for that. Again, as with the previous test, the test was limited by the application CPU only, be it sender or receiver. See Figures 7-9 and their respective tables.
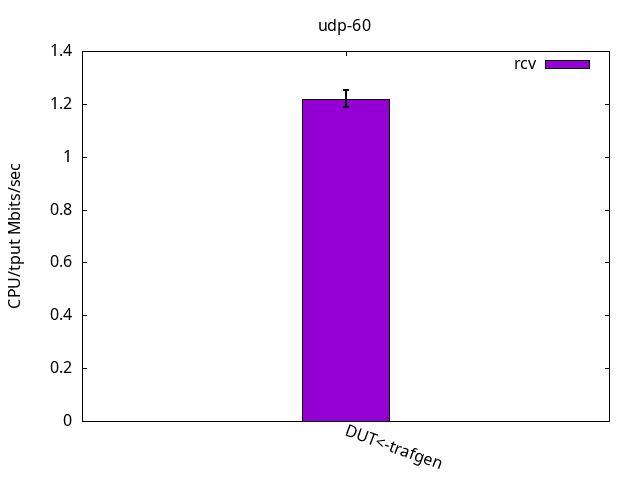
    ELN UDP 60 bytes bar graph throughput showing DUT being able to handle 100Mbps
    Figure 7: UDP 60 bytes throughput.
    Bar graph showing almost 1.2% of CPU usage per Gbits/sec on receive
    Figure 8: DUT CPU % per throughput on receive.
                    DUT rcv
                        CPU App %usr     15.6+-0.6
                        CPU App %sys     84.3+-0.6
                        CPU App %irq     0.0+-0.0
                        CPU App %soft    0.0+-0.0
                        CPU App %idle    0.0+-0.0
                        CPU S-IRQ %usr   0.1+-0.4
                        CPU S-IRQ %sys   0.1+-0.3
                        CPU S-IRQ %irq   0.0+-0.0
                        CPU S-IRQ %soft  23.6+-2.1
                        CPU S-IRQ %idle  76.2+-2.4
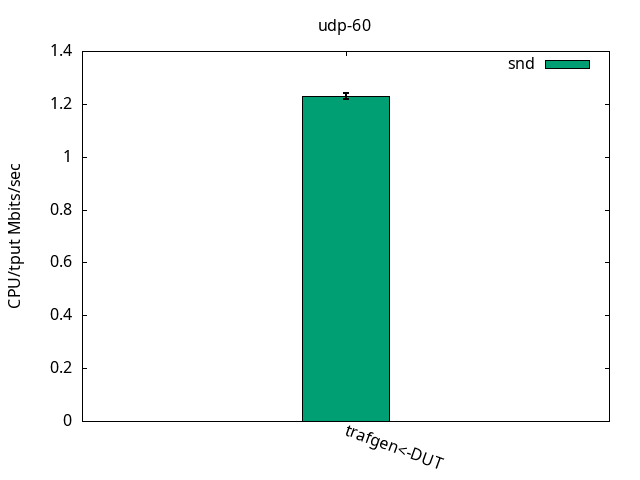
    Bar graph showing 1.2% of CPU usage per TX Gbits/sec
    Figure 9: DUT CPU % per throughput on send.
                    DUT snd
                        CPU App %usr     8.1+-0.6
                        CPU App %sys     91.9+-0.6
                        CPU App %irq     0.0+-0.0
                        CPU App %soft    0.0+-0.0
                        CPU App %idle    0.1+-0.0
                        CPU S-IRQ %usr   0.0+-0.0
                        CPU S-IRQ %sys   0.2+-0.4
                        CPU S-IRQ %irq   0.0+-0.0
                        CPU S-IRQ %soft  24.3+-1.0
                        CPU S-IRQ %idle  75.5+-1.2

    Tests with Red Hat Enterprise Linux 9.4

    Red Hat Enterprise Linux 9.4 kernel is kernel-5.14.0-427.el9 and that’s what we tested here, with the same procedure as above.

    TCP throughput

    Similarly to the ELN kernel, throughput was limited by the receiver CPUs. The DUT was able to send 71.44+-0.73Gbps and to receive 41.02+-0.25Gbps, as you can see in Figure 10. While sending it was similar to ELN kernel but when receiving, it was 17% faster. The CPU usage is detailed on Figures 11 and 12 and their respective tables.

    Bar graph showing trafgen and DUT throughputs, with DUT being able to send 70Gbps and receive 42Gbps
    Figure 10: TCP throughput.
    Bar graph showing almost 5% of CPU usage per Gbits/sec
    Figure 11: DUT CPU % per throughput on receive.
                    DUT rcv
                        CPU App %usr     0.9+-0.1
                        CPU App %sys     99.0+-0.1
                        CPU App %irq     0.0+-0.0
                        CPU App %soft    0.0+-0.0
                        CPU App %idle    0.1+-0.1
                        CPU S-IRQ %usr   0.0+-0.0
                        CPU S-IRQ %sys   0.1+-0.0
                        CPU S-IRQ %irq   0.0+-0.0
                        CPU S-IRQ %soft  99.9+-0.1
                        CPU S-IRQ %idle  0.0+-0.0
    Bar graph showing DUT using 1.9% of CPU per tx Gbps
    Figure 12: DUT CPU % per throughput on send.
                    DUT snd
                        CPU App %usr     0.9+-0.1
                        CPU App %sys     92.9+-0.9
                        CPU App %irq     0.0+-0.0
                        CPU App %soft    0.0+-0.0
                        CPU App %idle    6.1+-0.8
                        CPU S-IRQ %usr   0.0+-0.0
                        CPU S-IRQ %sys   0.0+-0.0
                        CPU S-IRQ %irq   0.0+-0.0
                        CPU S-IRQ %soft  40.3+-0.4
                        CPU S-IRQ %idle  59.7+-0.4

    UDP 1500 bytes

    The results shown in Figure 13 below, compared to the ELN kernel, were close and the same limiting factors applied. That is, the application CPU was the bottleneck of the test, and is detailed on Figures 14 and 15 and their respective tables.

    Bar graph showing DUT being able to send 7.5Gbps and receive 7.1Gbps
    Figure 13: UDP 1500 bytes throughput.
    Bar graph showing DUT using 16.5% of CPU per Gbps on rcv
    Figure 14: DUT CPU % per throughput on receive.
                    DUT rcv
                        CPU App %usr     12.4+-0.4
                        CPU App %sys     87.6+-0.4
                        CPU App %irq     0.0+-0.0
                        CPU App %soft    0.0+-0.0
                        CPU App %idle    0.0+-0.0
                        CPU S-IRQ %usr   0.0+-0.0
                        CPU S-IRQ %sys   0.0+-0.0
                        CPU S-IRQ %irq   0.0+-0.0
                        CPU S-IRQ %soft  23.8+-1.3
                        CPU S-IRQ %idle  76.2+-1.3
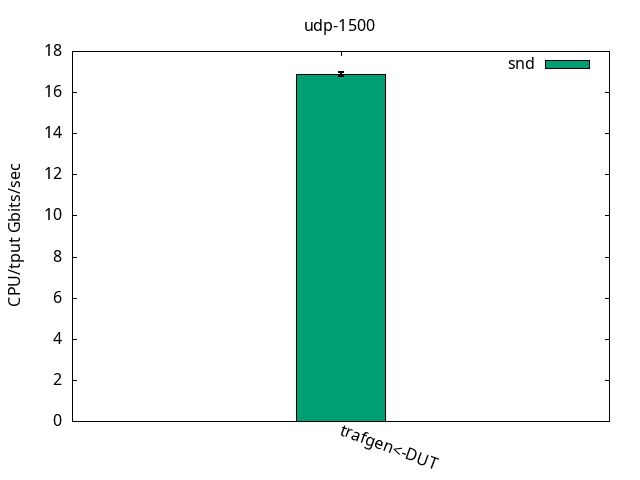
    Bar graph RHEL UDP 1500 bytes CPU % per throughput showing 16.5% per Gbps
    Figure 15: DUT CPU % per throughput on send.
                    DUT snd
                        CPU App %usr     7.0+-0.4
                        CPU App %sys     92.9+-0.4
                        CPU App %irq     0.0+-0.0
                        CPU App %soft    0.0+-0.0
                        CPU App %idle    0.1+-0.0
                        CPU S-IRQ %usr   0.0+-0.0
                        CPU S-IRQ %sys   0.0+-0.0
                        CPU S-IRQ %irq   0.0+-0.0
                        CPU S-IRQ %soft  24.4+-0.4
                        CPU S-IRQ %idle  75.6+-0.4

    UDP 60 bytes

    The throughput results, with a consistent 95Mbps for send and also receive, is shown in Figure 16. Once again, the application CPU was the bottleneck for the test, while leaving plenty of %idle CPU time on the IRQ CPU, and is detailed on Figures 17 and 18 and their respective tables.

    Bar graph showing DUT being able to handle 95Mbps on both tx and rx
    Figure 16: UDP 60 bytes throughput.
    Bar graph showing 1.25% of CPU usage per Mbps on receive
    Figure 17: DUT CPU % per throughput on receive.
                    DUT rcv
                        CPU App %usr     13.2+-0.4
                        CPU App %sys     86.7+-0.4
                        CPU App %irq     0.0+-0.0
                        CPU App %soft    0.0+-0.0
                        CPU App %idle    0.1+-0.0
                        CPU S-IRQ %usr   0.0+-0.0
                        CPU S-IRQ %sys   0.0+-0.0
                        CPU S-IRQ %irq   0.0+-0.0
                        CPU S-IRQ %soft  21.2+-0.6
                        CPU S-IRQ %idle  78.8+-0.6
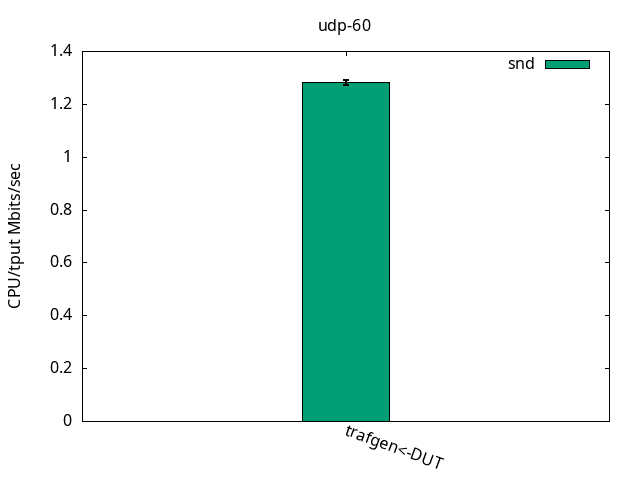
    Bar graph showing 1.25% CPU usage per Mbps on tx
    Figure 18: DUT CPU % per throughput on send.
                    DUT snd
                        CPU App %usr     7.2+-0.3
                        CPU App %sys     92.8+-0.3
                        CPU App %irq     0.0+-0.0
                        CPU App %soft    0.0+-0.0
                        CPU App %idle    0.1+-0.0
                        CPU S-IRQ %usr   0.0+-0.0
                        CPU S-IRQ %sys   0.0+-0.0
                        CPU S-IRQ %irq   0.0+-0.0
                        CPU S-IRQ %soft  21.8+-0.9
                        CPU S-IRQ %idle  78.2+-0.9

    Conclusions

    With all the results above, it is clear that the bandwidth handled by a single core on the DUT server is very capable of sustaining real and updated networking workloads while still having a considerable processing power left unused on the chip.

    It is worth mentioning that the DUT server was launched mid-2020 and that aarch64 designs often have plenty of cores which the applications can use to scale.

    Please don’t hesitate to reach out in case you are interested in more details!

    Related Posts

    • OpenJDK on AArch64: We have a release

    • OpenJDK, AArch64, and Fedora

    • How Red Hat ported OpenJDK to 64-bit Arm: A community history

    • The importance of standardization to emerging 64-bit ARM servers

    • The ARM Arc

    Recent Posts

    • Ollama or vLLM? How to choose the right LLM serving tool for your use case

    • How to build a Model-as-a-Service platform

    • How Quarkus works with OpenTelemetry on OpenShift

    • Our top 10 articles of 2025 (so far)

    • The benefits of auto-merging GitHub and GitLab repositories

    What’s up next?

    The Linux Commands cheat sheet covers the top Linux commands that are useful for developers to know, complete with code examples and easy-to-learn shortcuts.

    Get the cheat sheet
    Red Hat Developers logo LinkedIn YouTube Twitter Facebook

    Products

    • Red Hat Enterprise Linux
    • Red Hat OpenShift
    • Red Hat Ansible Automation Platform

    Build

    • Developer Sandbox
    • Developer Tools
    • Interactive Tutorials
    • API Catalog

    Quicklinks

    • Learning Resources
    • E-books
    • Cheat Sheets
    • Blog
    • Events
    • Newsletter

    Communicate

    • About us
    • Contact sales
    • Find a partner
    • Report a website issue
    • Site Status Dashboard
    • Report a security problem

    RED HAT DEVELOPER

    Build here. Go anywhere.

    We serve the builders. The problem solvers who create careers with code.

    Join us if you’re a developer, software engineer, web designer, front-end designer, UX designer, computer scientist, architect, tester, product manager, project manager or team lead.

    Sign me up

    Red Hat legal and privacy links

    • About Red Hat
    • Jobs
    • Events
    • Locations
    • Contact Red Hat
    • Red Hat Blog
    • Inclusion at Red Hat
    • Cool Stuff Store
    • Red Hat Summit
    © 2025 Red Hat

    Red Hat legal and privacy links

    • Privacy statement
    • Terms of use
    • All policies and guidelines
    • Digital accessibility

    Report a website issue