Page
Migrate your OpenShift Service Mesh to OpenTelemetry
Now that we have completed all the necessary configurations, it’s time for our migration demonstration. This will proceed in several distinct phases, ensuring that important spaces are moved carefully and legacy versions decommissioned appropriately.
Prerequisites:
- Created Jaeger instance
- Deployed OpenTelemetry (OTEL) and Red Hat OpenShift Service Mesh
- Subscribed Tempo Operator
- Hybrid Cloud Console access
In this lesson, you will:
- Ensure OTEL is functioning properly.
- Route OpenShift Service Mesh by updating the control plane.
- Decommission legacy components.
Initial state verification (zero-downtime check)
This is a structured, step-by-step plan for performing the phased migration of your Red Hat OpenShift Service Mesh telemetry from Jaeger to OTEL/Tempo.
Before modifying the service mesh, ensure the OTEL Collector is functioning correctly as a pass-through with the following steps:
- Verify trace flow: Send test traces using your legacy methods (e.g., Zipkin clients or an unconfigured Istio/Envoy instance configured for Zipkin) to the
otel-collector:9411endpoint. - Verify dual export: Confirm that the same traces are visible in both user interfaces.
Service mesh target re-routing
This phase is the crucial shift, involving only a control plane configuration update within your service mesh (e.g., Istio's MeshConfig or Telemetry resources) without touching the application code.
- Update proxy configuration: Change the service mesh configuration to direct all sidecar proxies (Envoy) to the new OTEL collector endpoint for trace ingestion.
- Action: Change the target endpoint that the service mesh sidecars use from the standalone Jaeger service (which typically emit Zipkin or legacy Jaeger formats) to
user-collector.istio-system.svc.cluster.local:9411(the Collector's Zipkin receiver). - Verify flow through collector: Continue monitoring Jaeger and Tempo UIs. Traces should continue flowing uninterrupted, confirming the Collector is now the central traffic router and translator.
Configuration steps for the transition
To set up the configuration for your transition, follow these steps.
Create a namespace-specific Telemetry
CustomResource(CR):cat <<'EOF' | oc create -f- apiVersion: telemetry.istio.io/v1 kind: Telemetry metadata: name: default namespace: istio-system spec: accessLogging: - providers: - name: envoy metrics: - overrides: - disabled: false providers: - name: prometheus tracing: - providers: - name: zipkin randomSamplingPercentage: 100 - providers: - name: otel randomSamplingPercentage: 100 EOFContinue updating all namespaces with specific Telemetry CR one by one.
Adjust the sampling percentage for the Zipkin provider Telemetry CR:
oc patch Telemetry mesh-logging-default \
  --type=merge \
  -p '{"spec": {"tracing": [{"providers": [{"name":"zipkin"}], "randomSamplingPercentage": 50}, {"providers": [{"name":"otel"}], "randomSamplingPercentage": 100}]}}'
Continue to downsample the percentage for the Zipkin provider Telemetry CR by repeating the last command with decreased
randomSamplingPercentagevalues.After finishing all Telemetry configuration to use OTEL only, we can start downsampling to the Jaeger instance in the
OpenTelemetryCollectorby adjusting the weight of theprobabilistic_sampler/jaeger.oc -n istio-system edit opentelemetrycollector user spec: configuration: processors: probabilistic_sampler/jaeger: sampling_percentage: 100 # … 80 … 50 … 30 … 0Putting the OTEL collector as a smart routing, buffering, and transformation API as the primary interface for OpenShift Service Mesh and application-generated signals like traces, logs, metrics, will now provide a smooth transition between Jaeger deployment and Tempo. With our configurations, we have reduced the downsampling percentage in comparison to the legacy exporter Zipkin. This will allow us to get volume traces much faster and without interruption, as displayed in the downsampling examples.
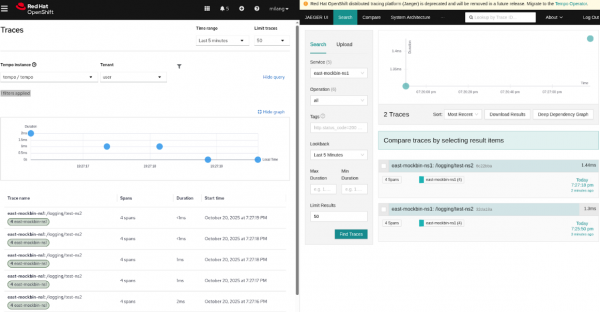
Figure 1: In this comparison, we can see Tempo sampling at 100 and Jaeger sampling much lower at 50. 
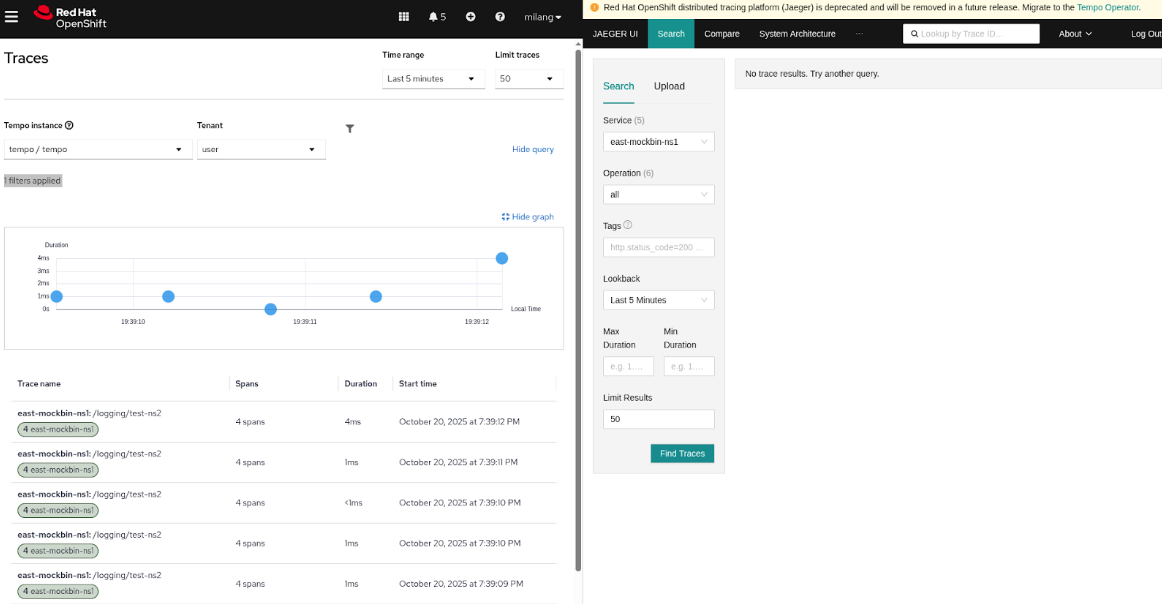
Figure 2: In this comparison, we can see Tempo sampling at 100 and Jaeger sampling much lower at 0.

Decommission legacy components
Once all production traffic is confirmed to be using OTLP and successfully reaching Tempo, you can clean up the leftover legacy components.
- Disable legacy receivers: Remove the Zipkin receiver from your Telemetry and your
opentelemetrycollector. - Decommission Jaeger: Shut down the Jaeger backend container, as it is no longer receiving primary data.
The migration is complete when the otel-collector is running a clean configuration, receiving only native OTLP data, and exporting solely to your new standard, Tempo.
Congratulations! You have successfully migrated from a legacy infrastructure, to a much quicker standard. Now you can take what you have learned and apply it to your own components, bringing everything up to speed with more opportunities to modernize as technologies change.
Ready to learn more about service meshes?
- Bridging the gap: Integrate legacy VMs into a zero trust Service Mesh
- How to achieve multi-cluster resiliency with Red Hat
- Introducing Istio Service Mesh for Microservices