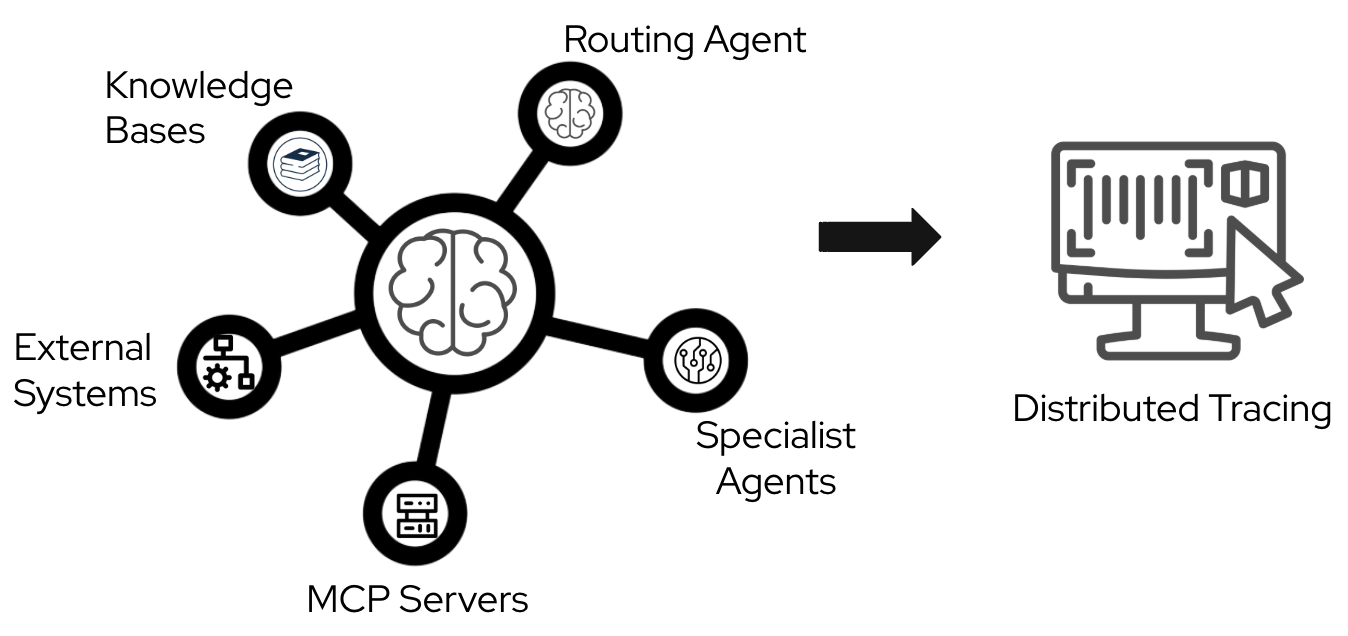
Agentic applications often involve complex interactions between routing agents, specialist agents, knowledge bases, Model Context Protocol (MCP) servers, and external systems. This complexity makes debugging in production difficult without clear visibility. A multi-agent AI system involves complex interactions between these components and requires end-to-end visibility through distributed tracing, as shown in Figure 1.
In this blog post, I will show you a practical way to set up distributed tracing for an agentic workflow, based on lessons learned while developing the it-self-service-agent AI quickstart. You will learn how to configure OpenTelemetry to track requests end-to-end across application workloads, MCP servers, and Llama Stack.
About AI quickstarts
AI quickstarts are a catalog of ready-to-run industry-specific use cases for your Red Hat AI environment. These AI quickstarts provide a fast, hands-on way to see how AI powers solutions on reliable, open source infrastructure. To learn more, read AI quickstarts: An easy and practical way to get started with Red Hat AI.
This is the sixth post in a series covering what we learned while developing the it-self-service-agent AI quickstart. Catch up on the previous parts in the series:
- Part 1: AI quickstart: Self-service agent for IT process automation
- Part 2: AI meets you where you are: Slack, email & ServiceNow
- Part 3: Prompt engineering: Big vs. small prompts for AI agents
- Part 4: Automate AI agents with the Responses API in Llama Stack
- Part 5: Eval-driven development: Build and evaluate reliable AI agents
- Part 6: Distributed tracing for agentic workflows with OpenTelemetry
- Part 7: 3 lessons for building reliable ServiceNow AI integrations
- Part 8: Guardrails: Enterprise safety shields with Llama Stack
- Part 9: Deploy with confidence: Continuous integration and continuous delivery for agentic AI
Distributed tracing for agentic workloads
In the first part of this article, I will explain how to produce tracing spans from application workloads using a remote OpenTelemetry collector. Then, we will explore ways to configure the tracing infrastructure on Red Hat OpenShift.
This post uses OpenTelemetry version 1.37.0, though other versions may work. For more information on the standard, see the OpenTelemetry page. The examples in this post use Python, but OpenTelemetry libraries are available for most popular programming languages.
What is OpenTelemetry?
OpenTelemetry is an open source observability framework. It provides a unified set of APIs, libraries, and instrumentation to capture distributed traces, metrics, and logs. It emerged from the merger of OpenTracing and OpenCensus in 2019 and is now the industry standard for application observability.
OpenTelemetry provides several advantages:
- Vendor neutrality: Instrument code once and export telemetry data to any compatible backend, such as Jaeger, Tempo, or Zipkin.
- Broad language support: Official SDKs are available for most major programming languages, including Python, Java, Go, and JavaScript.
- Automatic instrumentation: Many popular frameworks and libraries offer auto-instrumentation, reducing the amount of custom code needed.
- Context propagation: Built-in mechanisms maintain trace context across service boundaries. This is essential for distributed systems.
- Active ecosystem: Strong community support, regular updates, and backing from major cloud providers and observability vendors
Distributed tracing is essential for agentic applications. These architectures often involve routing agents, specialist agents, LLM inference, MCP servers, and external integrations. OpenTelemetry helps you trace requests across these different components. You can correlate spans to understand the execution flow and find performance bottlenecks.
Context propagation
The it-self-service-agent AI quickstart demonstrates a realistic production architecture for agentic applications. It consists of multiple loosely coupled services that communicate via events. Understanding how requests flow through this system enables effective observability.
Architecture components
The AI quickstart deploys these main components:
- Request manager: The central entry point that normalizes incoming requests from multiple channels (Slack, email, command-line interface, webhooks, web UI) into a standardized format.
- Agent service: The AI orchestration engine that routes requests between a routing agent and specialist agents.
- Integration dispatcher: Handles bidirectional communication with external channels, routing agent responses back to users via their original communication channel.
- Llama Stack: Provides LLM inference endpoints for agent reasoning. It also manages tool calling, function execution, and vector database operations for knowledge base retrieval.
- MCP servers: Model Context Protocol servers provide tools for integrating with external systems.
- Eventing layer: Routes CloudEvents between services.
The challenge of distributed tracing
In this architecture, a single user request moves across several service boundaries at different times:
- When a user sends a message through Slack, the integration dispatcher receives a webhook and forwards it to the request manager.
- The request manager creates or updates a session and publishes a CloudEvent.
- The eventing layer routes this event to the agent service, which processes the request.
- During this process, the agent service might query a knowledge base, call an MCP server, or request inference from the Llama Stack.
- Finally, the agent service publishes a response CloudEvent. The eventing layer routes this response back to the integration dispatcher, which sends it to the user on Slack.
Without context propagation, each service creates isolated, disconnected spans. You might see individual operations in a tracing backend, but you lose the causal relationships that show which operations triggered specific downstream calls.
How context propagation works
OpenTelemetry solves this using the W3C Trace Context standard for trace context propagation. Each trace is assigned a unique trace ID that remains constant across all services involved in processing that request. When calls cross service boundaries, the request carries the trace context. This context includes the trace ID and parent span ID in the format version-traceid-spanid-sampled. This allows downstream services to continue the trace instead of starting a new one.
The following example shows a trace and span ID injected as an HTTP header:
traceparent: 00-1e9a84a8c5ae45c30b1305a0f41ed275-215435bcec6efa72-00The propagation mechanism works through a simple extract-and-inject pattern:
- Extract: When a service receives a request, it pulls the trace context from the metadata.
- Inject: When that service makes an outbound call, it adds the current trace context to the request metadata. This allows the receiving service to continue the trace.
This pattern ensures that when you view a trace in Jaeger or the OpenShift console, you see the complete request flow with defined parent-child relationships between spans, even across asynchronous service boundaries.
A typical trace shows all components correlated under a single trace ID. This includes the initial HTTP request, agent interactions, LLM inference calls, knowledge base queries, and MCP tool invocations.
Instrumenting Llama Stack
Llama Stack includes native OpenTelemetry support. Enabling tracing requires configuration only, with no custom instrumentation code. Once enabled, Llama Stack automatically produces spans for LLM inference requests, tool invocations, and vector database operations. These spans include attributes such as model names, token counts, and tool parameters.
For example, the default Llama Stack 0.2 configuration defines a telemetry component as follows:
telemetry:
  - provider_id: meta-reference
    provider_type: inline::meta-reference
    config:
      sinks: ${env.TELEMETRY_SINKS:=console,sqlite,otel_trace}
      service_name: {{ include "llama-stack.fullname" . }}
      otel_exporter_otlp_endpoint: ${env.OTEL_EXPORTER_OTLP_ENDPOINT:=}
Llama Stack 0.3.x uses a simpler configuration. You only need to set environment variables:
env:
  - name: OTEL_EXPORTER_OTLP_ENDPOINT
    value: {{ .Values.otelExporter }}
  - name: TELEMETRY_SINKS
    value: console,sqlite,otel_trace
Tracing limitations with MCP servers
In Llama Stack 0.2.x and 0.3.x, the span context does not automatically propagate from the Llama Stack server to the MCP servers during a Responses API call. You must manually inject the parent tracing context into the HTTP headers when Llama Stack calls an MCP server. Use the following method.
Adapted from agent-service/src/agent_service/langgraph/responses_agent.py:
from opentelemetry.propagate import inject
# Prepare headers for MCP server request
tool_headers = {}
inject(tool_headers)
logger.debug(
    f"Injected tracing headers for MCP server {server_name}: {list(tool_headers.keys())}"
)
This results in an additional header in the MCP server configuration passed to the Responses API:
 [
      {
          "type": "mcp",
          "server_label": "snow",
          "server_url": "http://mcp-self-service-agent-snow:8000/mcp",
          "require_approval": "never",
          "headers": {
              "traceparent": "00-0af7651916cd43dd8448eb211c80319c-b7ad6b7169203331-01",
              "tracestate": "",
          }
      }
  ]
Auto-instrumentation: HTTP clients and FastAPI
The it-self-service-agent AI quickstart consists of several components. We added OpenTelemetry support to the components we built.
The OpenTelemetry spans you capture depend on the frameworks used in the components. For example, in the it-self-service-agent quickstart, most communication between workloads uses REST API calls. We want to capture these calls in our tracing, producing a span for each invocation while maintaining the causal relationships between them.
Use auto-instrumentation whenever a library supports it. For example, we used the OpenTelemetry instrumentation HTTPx and OpenTelemetry FastAPI Instrumentation libraries to instrument all REST server and client requests and responses within the AI quickstart. This approach produces spans for all calls without requiring custom code. These libraries also handle context propagation, so you do not need to pass context from parent calls to child calls manually.
In our project, we added these instrumentation libraries to all modules that use the frameworks, along with the base libraries for the OpenTelemetry APIs, SDK, and exporter.
The AI quickstart components use these dependencies:
Adapted from tracing-config/pyproject.toml:
"opentelemetry-exporter-otlp-proto-http==1.37.0",
"opentelemetry-instrumentation-httpx==0.58b0",
"opentelemetry-api>=1.37.0",
"opentelemetry-sdk>=1.37.0",
"opentelemetry-instrumentation-fastapi>=0.58b0"
When using auto-instrumentation, define environment variables for the framework.
For example, in our project's auto-instrumented components, we set the following variables:
Adapted from helm/templates/_service-deployment.tpl:
ENV OTEL_SERVICE_NAME=${SERVICE_NAME}
ENV OTEL_PYTHON_LOGGING_AUTO_INSTRUMENTATION_ENABLED=true
ENV OTEL_EXPORTER_OTLP_ENDPOINT=${OTEL_EXPORTER_OTLP_ENDPOINT}
The presence of OTEL_EXPORTER_OTLP_ENDPOINT programmatically configures the trace, span, and batch processors.
Propagate context when making calls across components. Use the following code to propagate context and maintain span correlation.
Adapted from tracing-config/src/tracing_config/auto_tracing.py:
from opentelemetry.propagate import set_global_textmap
from opentelemetry.trace.propagation.tracecontext import TraceContextTextMapPropagator
# Set up propagator
set_global_textmap(TraceContextTextMapPropagator())
Enable the HTTPX client auto-instrumentation.
Adapted from request-manager/src/request_manager/main.py and similar service main files:
# Set up instrumentations
HTTPXClientInstrumentor().instrument()
Finally, enable the FastAPI instrumentation.
Adapted from request-manager/src/request_manager/main.py and similar service main files:
from opentelemetry.instrumentation.fastapi import FastAPIInstrumentor
# app is FastAPI instance
FastAPIInstrumentor.instrument_app(app)
Manual instrumentation: MCP servers
During development, we did not find a FastMCP auto-instrumentation library that met our requirements, so we used manual instrumentation to trace MCP server calls.
When using manual instrumentation, you must integrate manually created spans with automatically instrumented spans. The main task is maintaining trace context propagation. This ensures that manually created spans identify their parent spans and that child operations—such as automatically instrumented HTTP calls—continue the trace.
Setting up manual instrumentation
Initialize the OpenTelemetry tracer before creating spans manually. Perform this setup once during module initialization.
Adapted from mcp-servers/snow/src/snow/tracing.py:
from opentelemetry import trace
from opentelemetry.sdk.trace import TracerProvider
from opentelemetry.sdk.trace.export import BatchSpanProcessor
from opentelemetry.exporter.otlp.proto.http.trace_exporter import OTLPSpanExporter
import os
# Initialize tracer provider if not already initialized
if not trace.get_tracer_provider():
    provider = TracerProvider()
    trace.set_tracer_provider(provider)
# Configure OTLP exporter if endpoint is provided
otel_endpoint = os.getenv("OTEL_EXPORTER_OTLP_ENDPOINT")
if otel_endpoint:
    otlp_exporter = OTLPSpanExporter(endpoint=otel_endpoint)
    span_processor = BatchSpanProcessor(otlp_exporter)
    trace.get_tracer_provider().add_span_processor(span_processor)
# Get tracer for this service
tracer = trace.get_tracer(__name__, "1.0.0")
Context extraction and span creation
Next, we need to extract the parent trace context from incoming requests. This ensures that manually created spans appear as children of the parent span in the trace to maintain the relationship between operations.
When an MCP server receives a tool invocation request, HTTP headers transmit the trace context. As covered earlier, the W3C Trace Context standard specifies that trace context is carried in the traceparent header. Extract this context to use it as the parent when creating a span.
Adapted from mcp-servers/snow/src/snow/tracing.py:
from opentelemetry.propagate import extract
from opentelemetry.trace import Status, StatusCode
headers = ctx.request_context.headers
# Convert headers to dict-like format expected by propagator
# Normalize header keys to lowercase as traceparent is case-insensitive
carrier = {k.lower(): v for k, v in dict(headers).items()}
# Extract context from headers using the global propagator
parent_context = extract(carrier)
# Create span with parent context
span_name = f"mcp.tool.{func.__name__}"
with tracer.start_as_current_span(span_name, context=parent_context) as span:
    # Set semantic attributes following OpenTelemetry conventions
    span.set_attribute("mcp.tool.name", func.__name__)
    span.set_attribute("mcp.server.name", server_name)

    # Record function arguments as attributes for debugging
    for i, arg in enumerate(args):
        span.set_attribute(f"mcp.tool.arg.{i}", str(arg))
    for key, value in kwargs.items():
        span.set_attribute(f"mcp.tool.param.{key}", str(value))

    try:
        # Execute the tool function
        # The span context will automatically propagate to any
        # instrumented HTTP calls made within this function
        result = func(*args, **kwargs)
        span.set_status(Status(StatusCode.OK))
        return result
    except Exception as e:
        # Record the exception and set error status
        span.record_exception(e)
        span.set_status(Status(StatusCode.ERROR, str(e)))
        raise
Additional considerations for manual instrumentation
Follow these best practices to ensure your manual instrumentation is consistent and efficient.
Span naming conventions
Use consistent, hierarchical names that reflect the operation you are tracing. For MCP tools, we used the pattern mcp.tool.{tool_name} to filter and group related spans in the tracing UI.
Attribute best practices
Follow these guidelines to capture meaningful context while maintaining performance and security:
- Use semantic attribute names that follow OpenTelemetry semantic conventions.
- For custom attributes, use a consistent prefix (such as
mcp.) to avoid conflicts. - Be mindful of attribute value size; large values can impact trace storage and query performance.
- Include enough context to debug issues, but avoid sensitive data such as passwords or tokens.
Error handling
Set the span status for each operation:
StatusCode.OKfor successful operations.StatusCode.ERRORfor failures. You can also include a descriptive message.- Use
span.record_exception()to capture exception details. This method adds stack traces and exception metadata to the span.
Context propagation
When you create a span using start_as_current_span(), it becomes the active span in the current context. Automatically instrumented operations, such as HTTP calls, that occur within that context become child spans. This integration between manual and automatic instrumentation simplifies tracking across your application.
Performance impact
Manual instrumentation adds minimal overhead (often microseconds per span), but you should be cautious when creating too many fine-grained spans for trivial operations. Avoid setting attributes that require expensive computations; evaluate these lazily if possible. You should also avoid including large data structures as attribute values, as they can impact performance.
Decorator pattern for clean integration
To make manual instrumentation less intrusive in the AI quickstart, we wrapped MCP tool functions with a decorator that handles all the tracing logic.
Adapted from mcp-servers/snow/src/snow/tracing.py:
from functools import wraps
def trace_mcp_tool(server_name: str):
    """Decorator to automatically trace MCP tool invocations."""
    def decorator(func):
        @wraps(func)
        def wrapper(*args, **kwargs):
            # Extract context from request (implementation depends on framework)
            headers = get_request_headers()  # Framework-specific
            carrier = {k.lower(): v for k, v in dict(headers).items()}
            parent_context = extract(carrier)

            span_name = f"mcp.tool.{func.__name__}"
            with tracer.start_as_current_span(span_name, context=parent_context) as span:
                span.set_attribute("mcp.tool.name", func.__name__)
                span.set_attribute("mcp.server.name", server_name)
                # ... rest of instrumentation ...
                return func(*args, **kwargs)
        return wrapper
    return decorator
# Usage:
@trace_mcp_tool(server_name="snow")
def get_employee_laptop_info(employee_id: str):
    # Tool implementation
    pass
This pattern separates tracing logic from business logic. This makes the codebase easier to maintain and ensures consistent instrumentation across all MCP tools.
Llama Stack tracing configuration
This configuration works with Llama Stack 0.2.x and 0.3.x. For information about newer versions, see the Llama Stack telemetry documentation.
Define the telemetry to include the OTEL exporter and the otel_trace sink if you define an otelExporter at the root application level.
Define the telemetry for Llama Stack 0.2.x as follows.
Adapted from Helm values passed to the llama-stack subchart (configured in helm/values.yaml):
telemetry:
  - provider_id: meta-reference
    provider_type: inline::meta-reference
    config:
      sqlite_db_path: ${env.SQLITE_DB_PATH:=~/.llama/distributions/starter/trace_store.db}
      {{- if .Values.otelExporter }}
      sinks: ${env.TELEMETRY_SINKS:=console,sqlite,otel_trace}
      service_name: {{ include "llama-stack.fullname" . }}
      otel_exporter_otlp_endpoint: ${env.OTEL_EXPORTER_OTLP_ENDPOINT:=}
      {{- else }}
      sinks: ${env.TELEMETRY_SINKS:=console,sqlite}
      {{- end }}
For Llama Stack 0.3.x, you only need to set environment variables.
Adapted from Helm values passed to the llama-stack subchart (configured in helm/values.yaml):
env:
  {{- if .Values.otelExporter }}
  - name: OTEL_EXPORTER_OTLP_ENDPOINT
    value: {{ .Values.otelExporter }}
  {{- end }}
  {{- if .Values.telemetrySinks }}
  - name: TELEMETRY_SINKS
    value: {{ .Values.telemetrySinks }}
  {{- end }}
Collect traces with a Jaeger All-in-One server
To visualize the spans produced in earlier sections, deploy a Jaeger All-in-One server using Podman:
docker run --rm --name jaeger \
 -p 16686:16686 \
 -p 4317:4317 \
 -p 4318:4318 \
 -p 5778:5778 \
 -p 9411:9411 \
 cr.jaegertracing.io/jaegertracing/jaeger:2.14.0
The it-self-service-agent repository includes a make target called jaeger-deploy to deploy a Jaeger instance in the same namespace as the AI quickstart. For more details, see the Jaeger getting started guide.
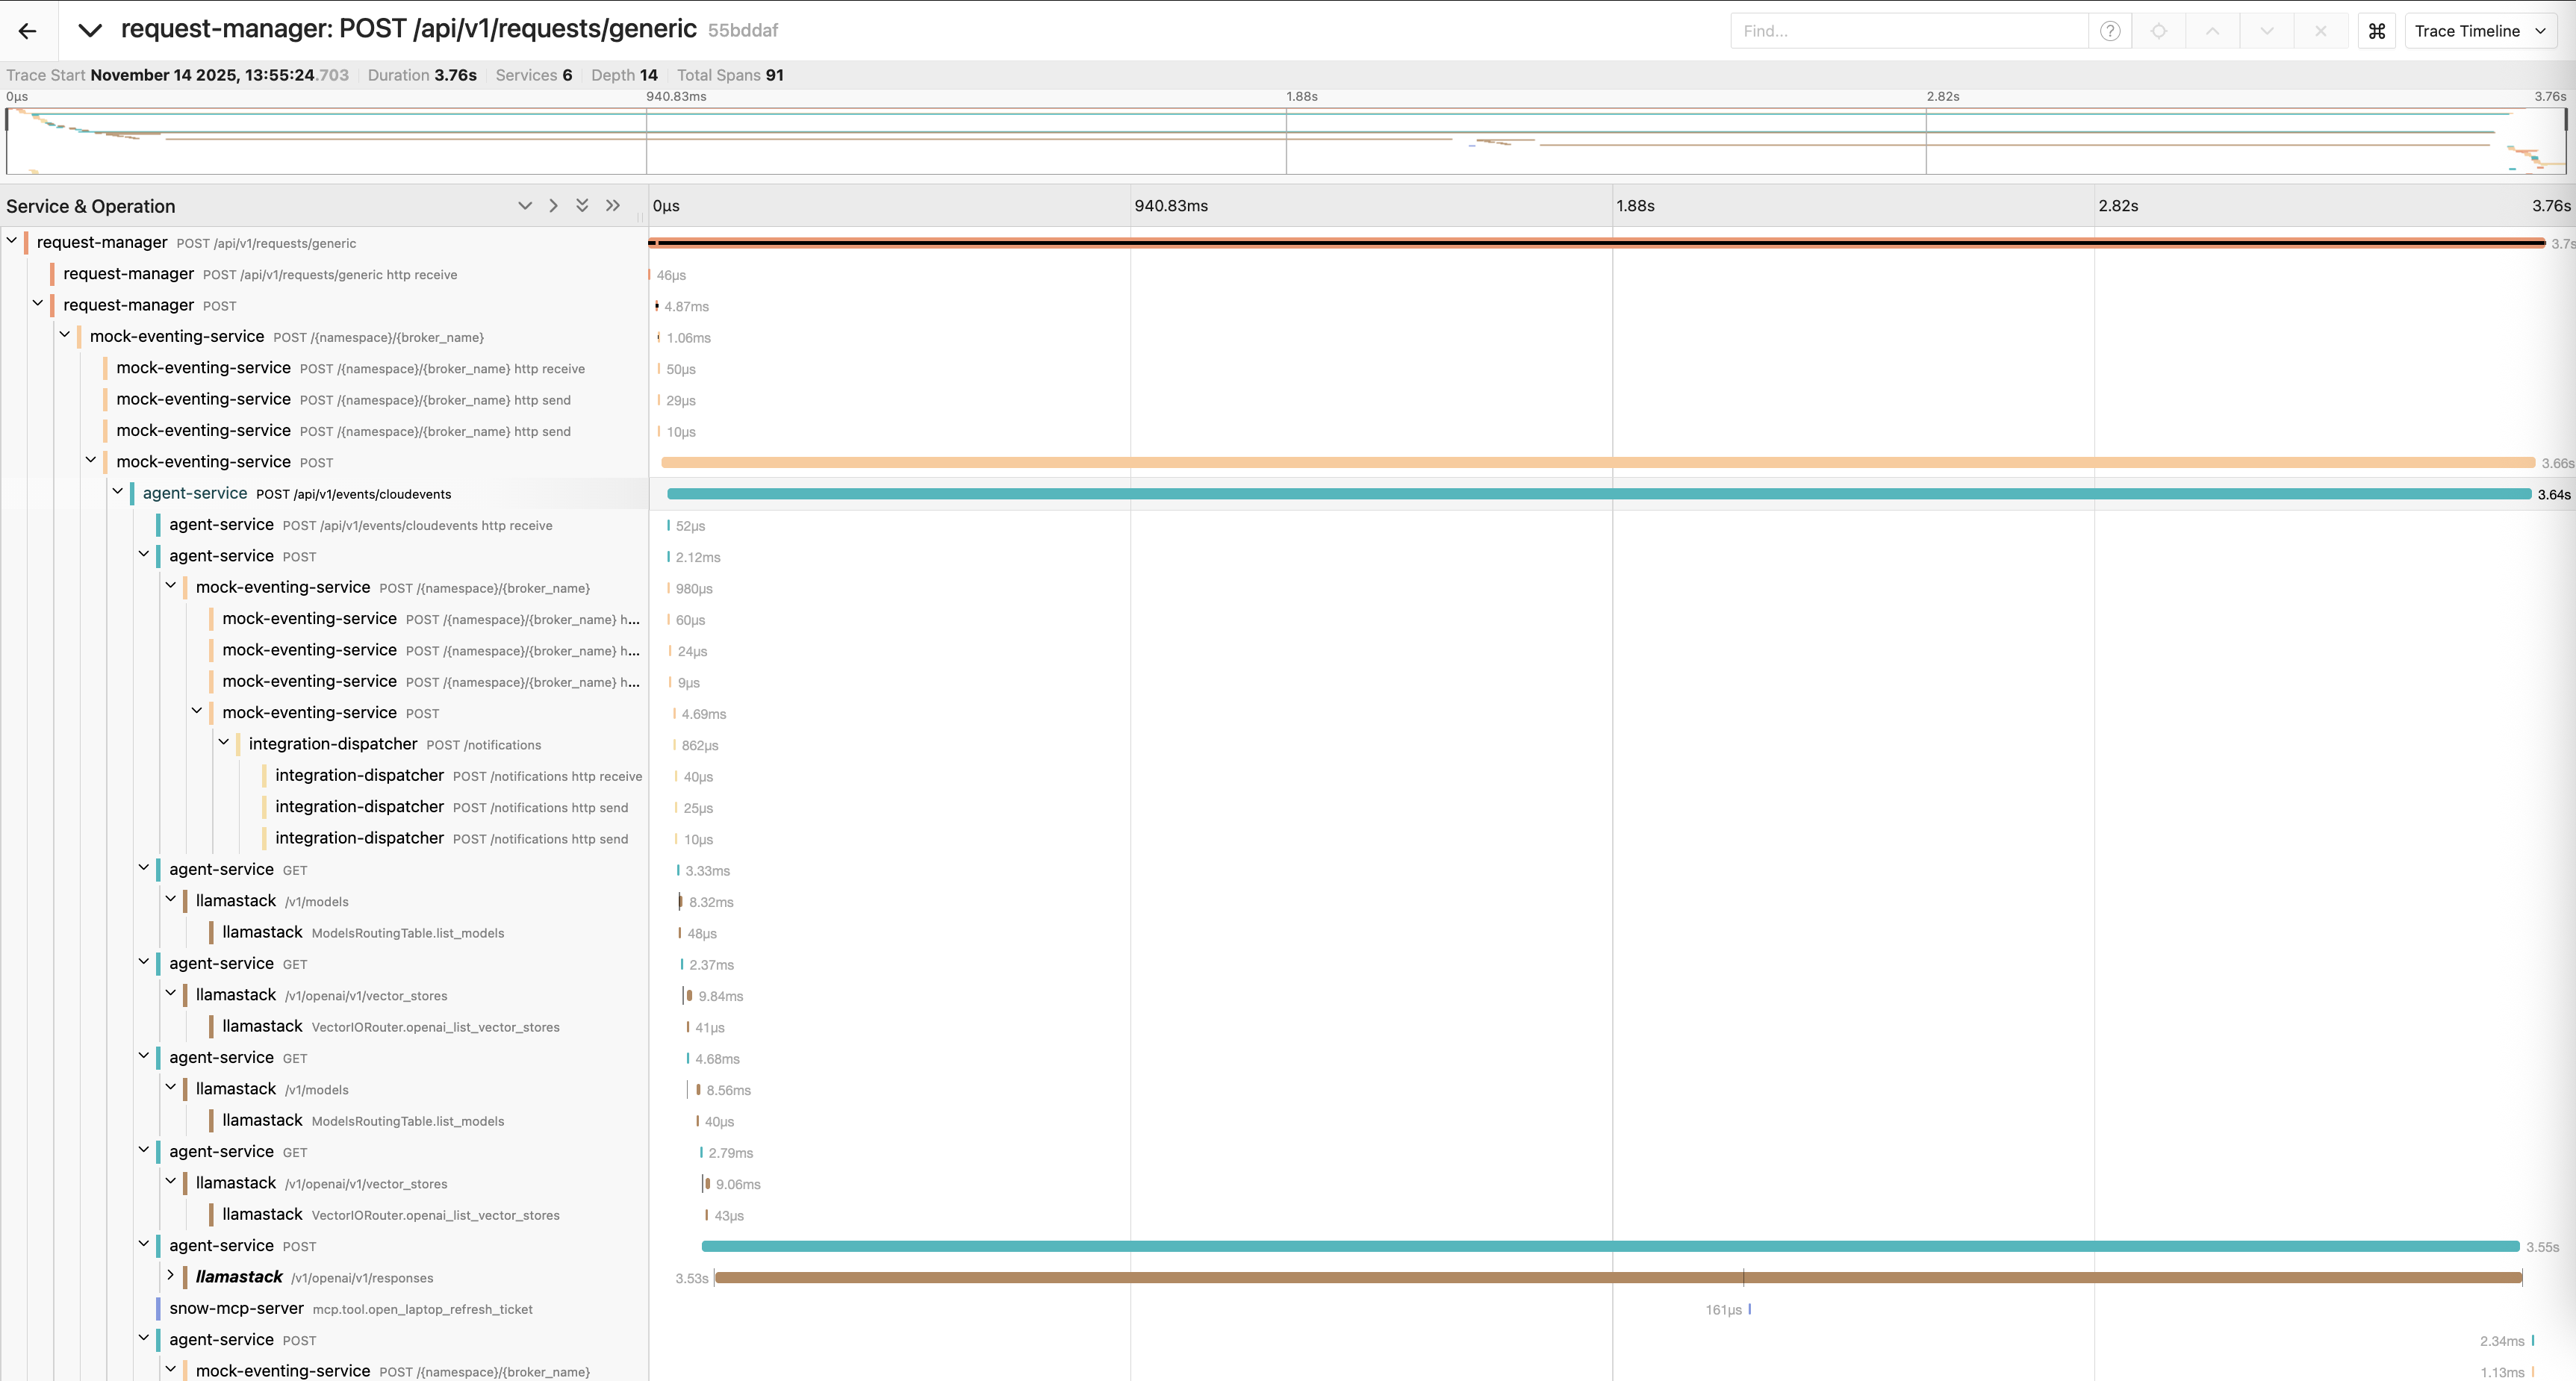
After deploying the server, you can visualize the spans and trace distribution over time, as shown in Figure 2.
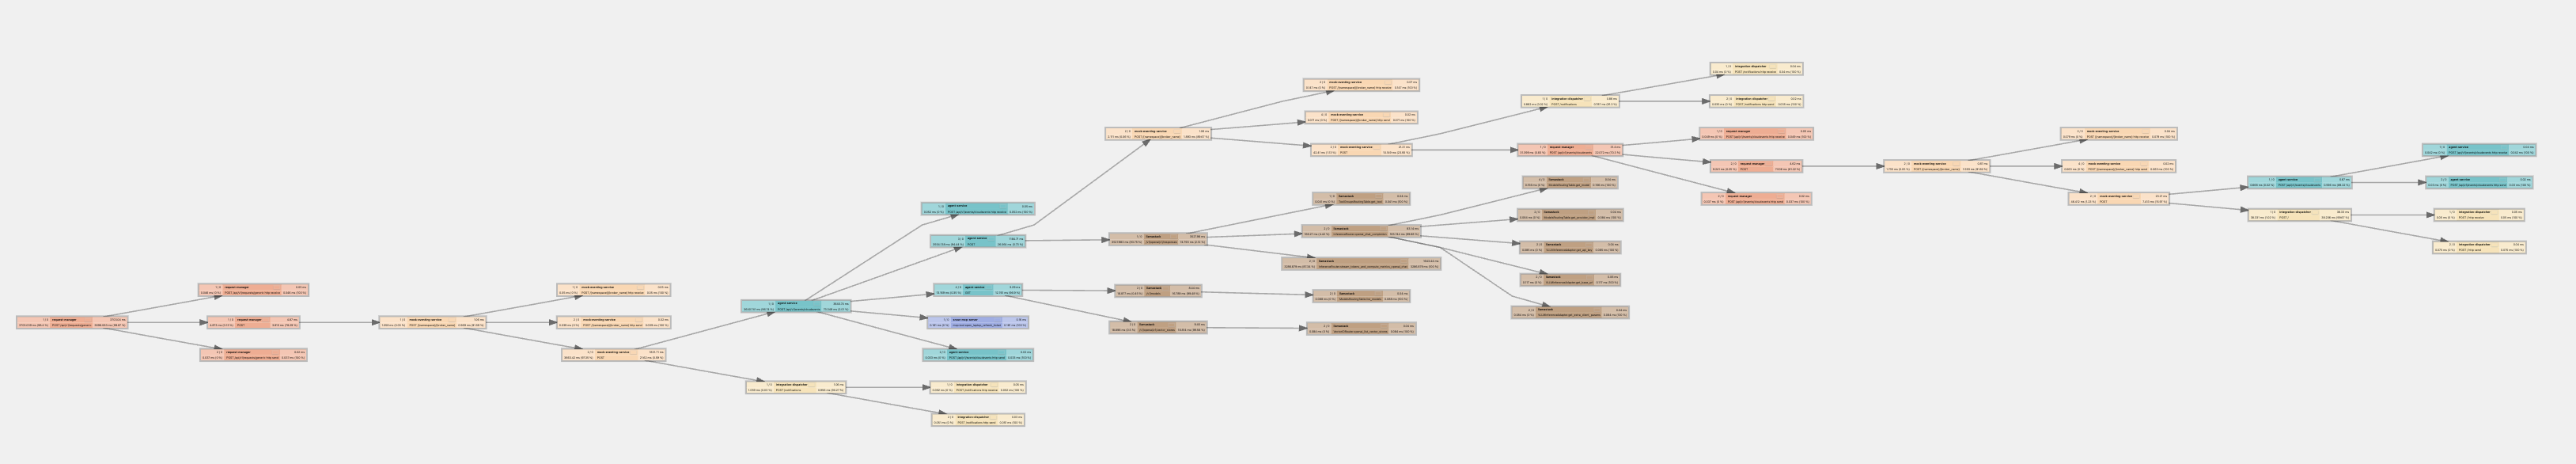
You can also analyze the relationships between different service calls by viewing the same data in a graph format, as shown in Figure 3.
Trace structures are often complex. A typical request includes several nested calls:
request-manager: POST /api/v1/requests/generic [3.75s]
└─ mock-eventing-service: POST [3.66s]
└─ agent-service: POST /api/v1/events/cloudevents [3.64s]
├─ mock-eventing-service: POST /{namespace}/{broker_name} [1.03ms]
│ └─ integration-dispatcher: POST /notifications [1ms]
├─ agent-service: GET [3.68ms]
│ └─ llamastack: /v1/models [8.21ms]
├─ agent-service: GET [2.53ms]
│ └─ llamastack: /v1/openai/v1/vector_stores [9.43ms]
├─ agent-service: POST [3.55s]
├─ llamastack: /v1/openai/v1/responses [3.54s]
│ ├─ llamastack: InferenceRouter.openai_chat_completion [88.26ms]
│ ├─ llamastack: InferenceRouter.stream_tokens_openai_chat [1.88s]
│ ├─ llamastack: InferenceRouter.openai_chat_completion [90.65ms]
│ └─ llamastack: InferenceRouter.stream_tokens_openai_chat [1.39s]
└─ snow-mcp-server: mcp.tool.open_laptop_refresh_ticket [11.93ms]
In this example, the LLM inference call accounts for most of the request time. This is common in agentic applications.
Collect traces with Red Hat OpenShift Distributed Tracing
The solution in the previous section is best for test or development environments.
For production, we recommend using the OpenShift Distributed Tracing Platform. Configure the collector by following the OpenShift documentation.
This approach collects traces globally in the OpenShift console instead of a dedicated project or namespace. Because the console is cluster-wide, tracing data might come from multiple tenants.
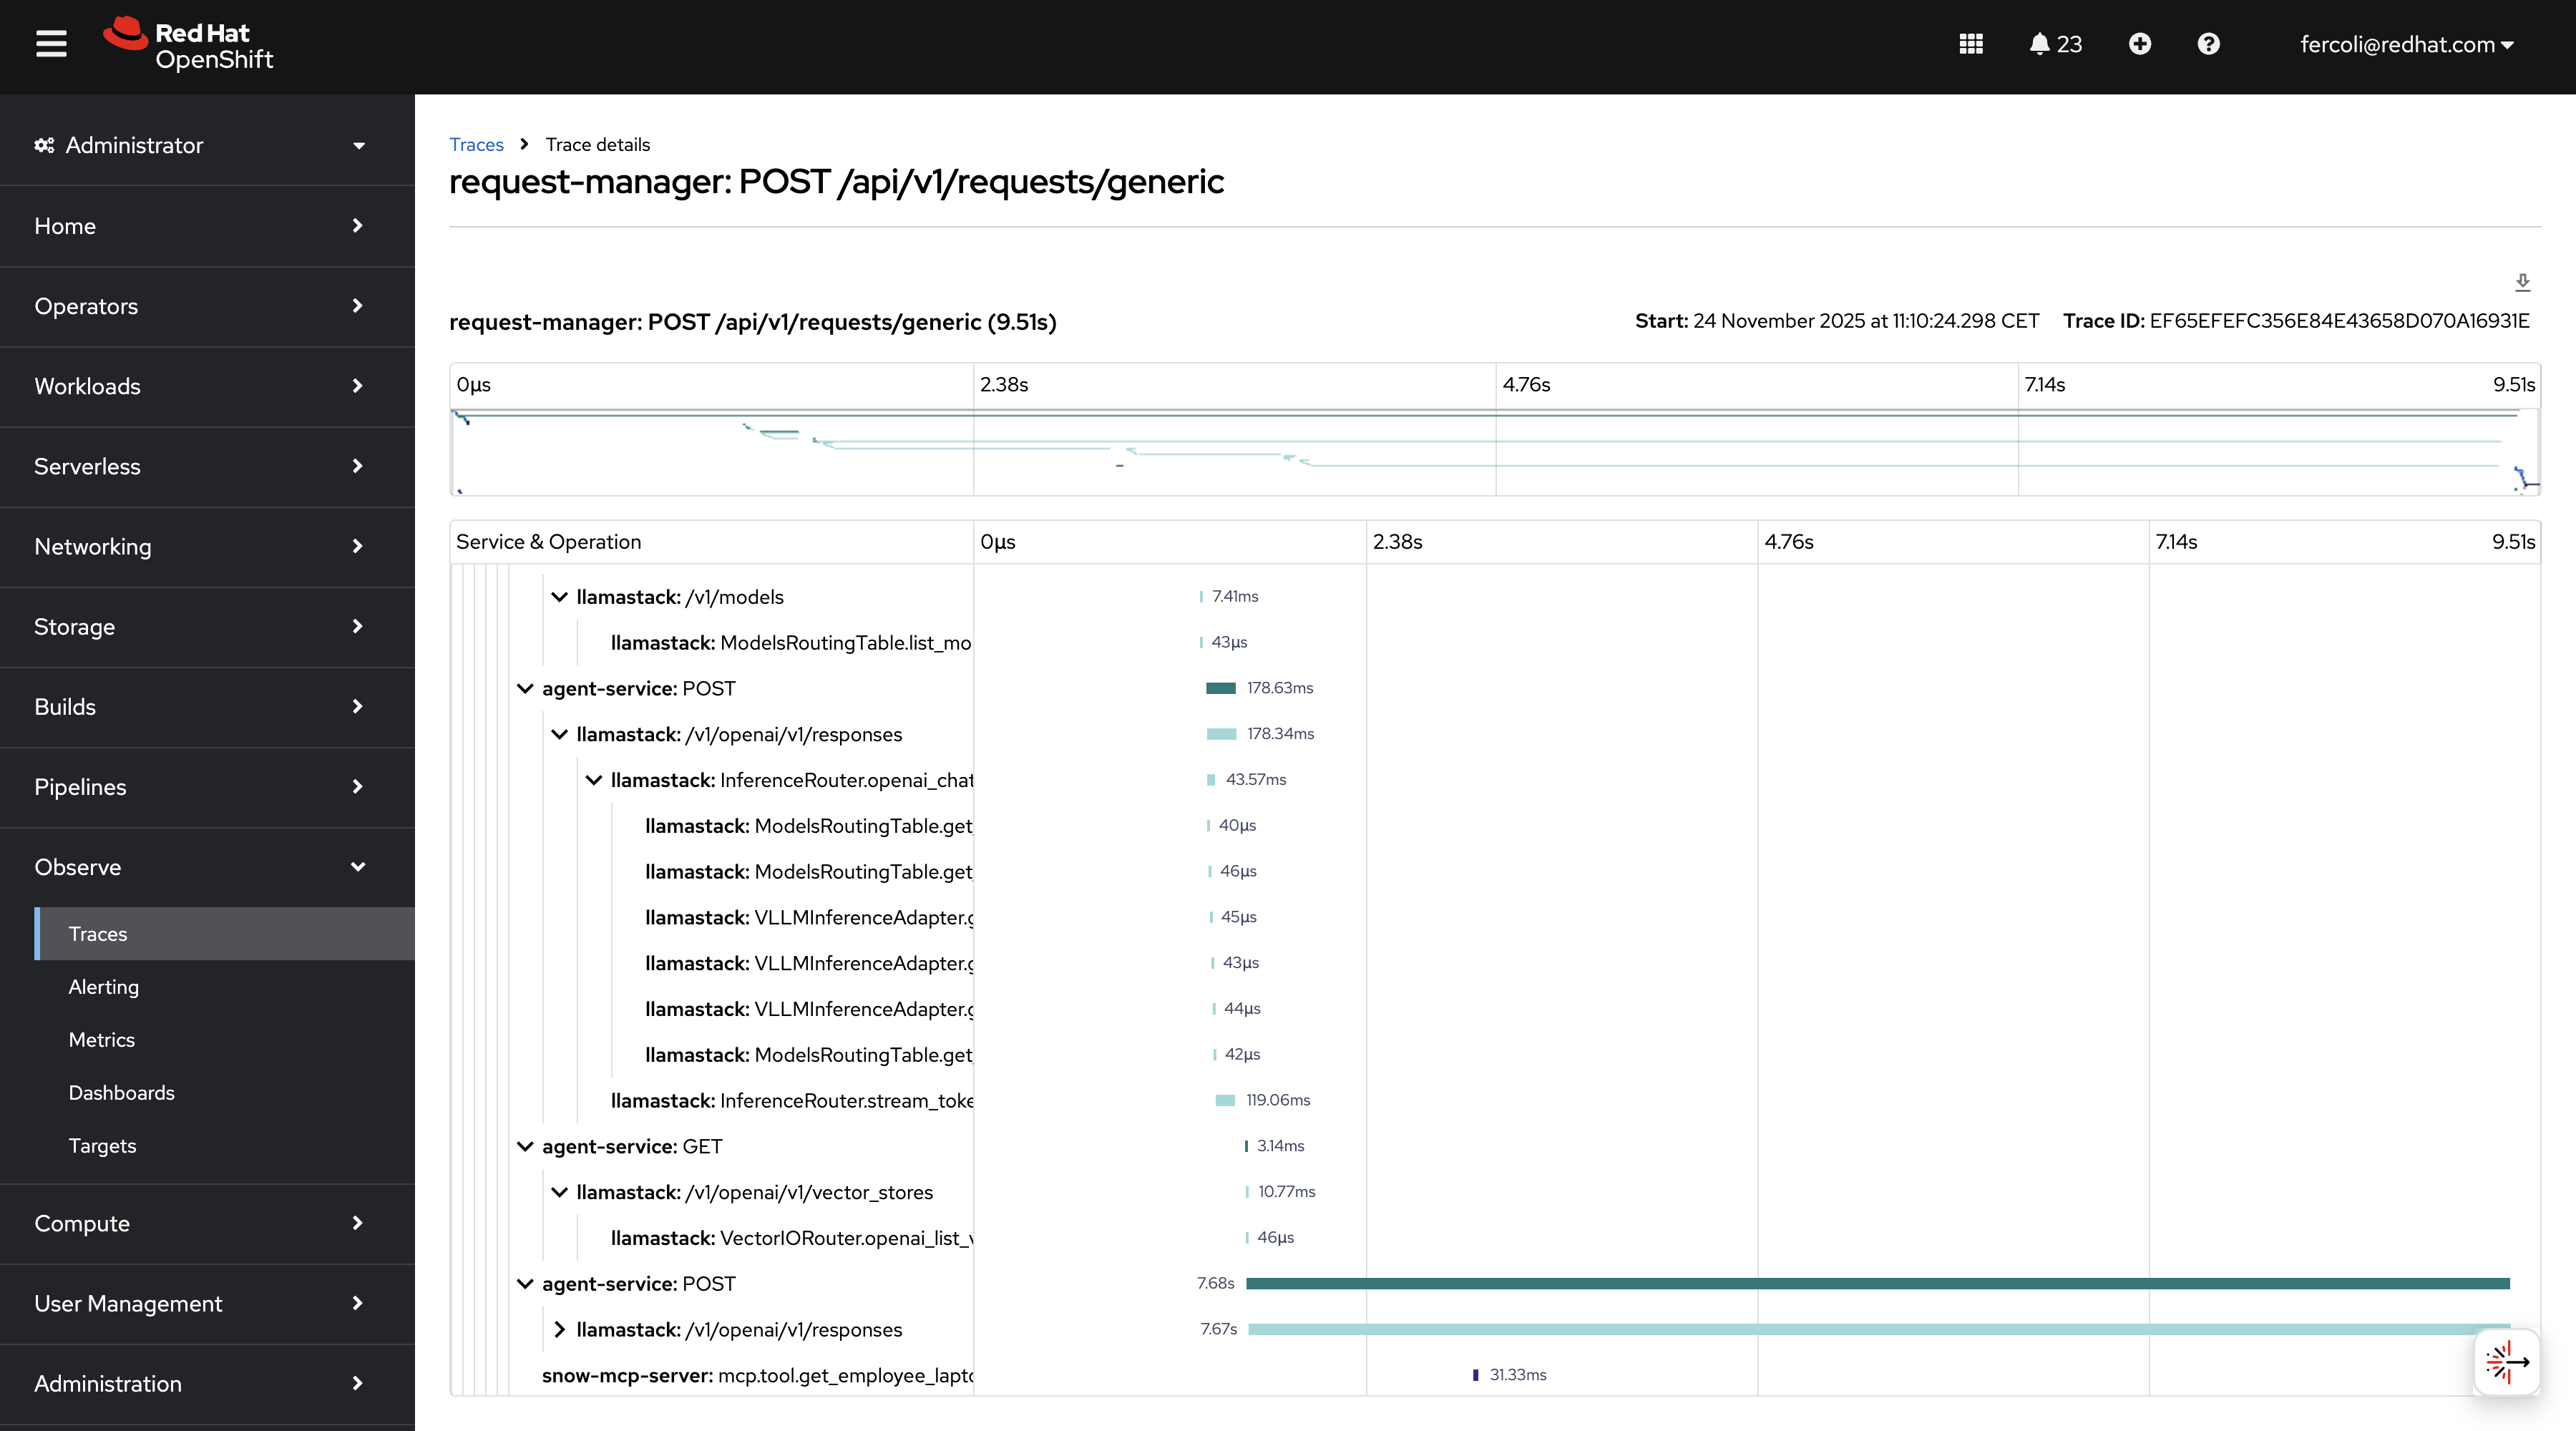
You can access traces through the OpenShift console by selecting Observe > Traces (Figure 4).
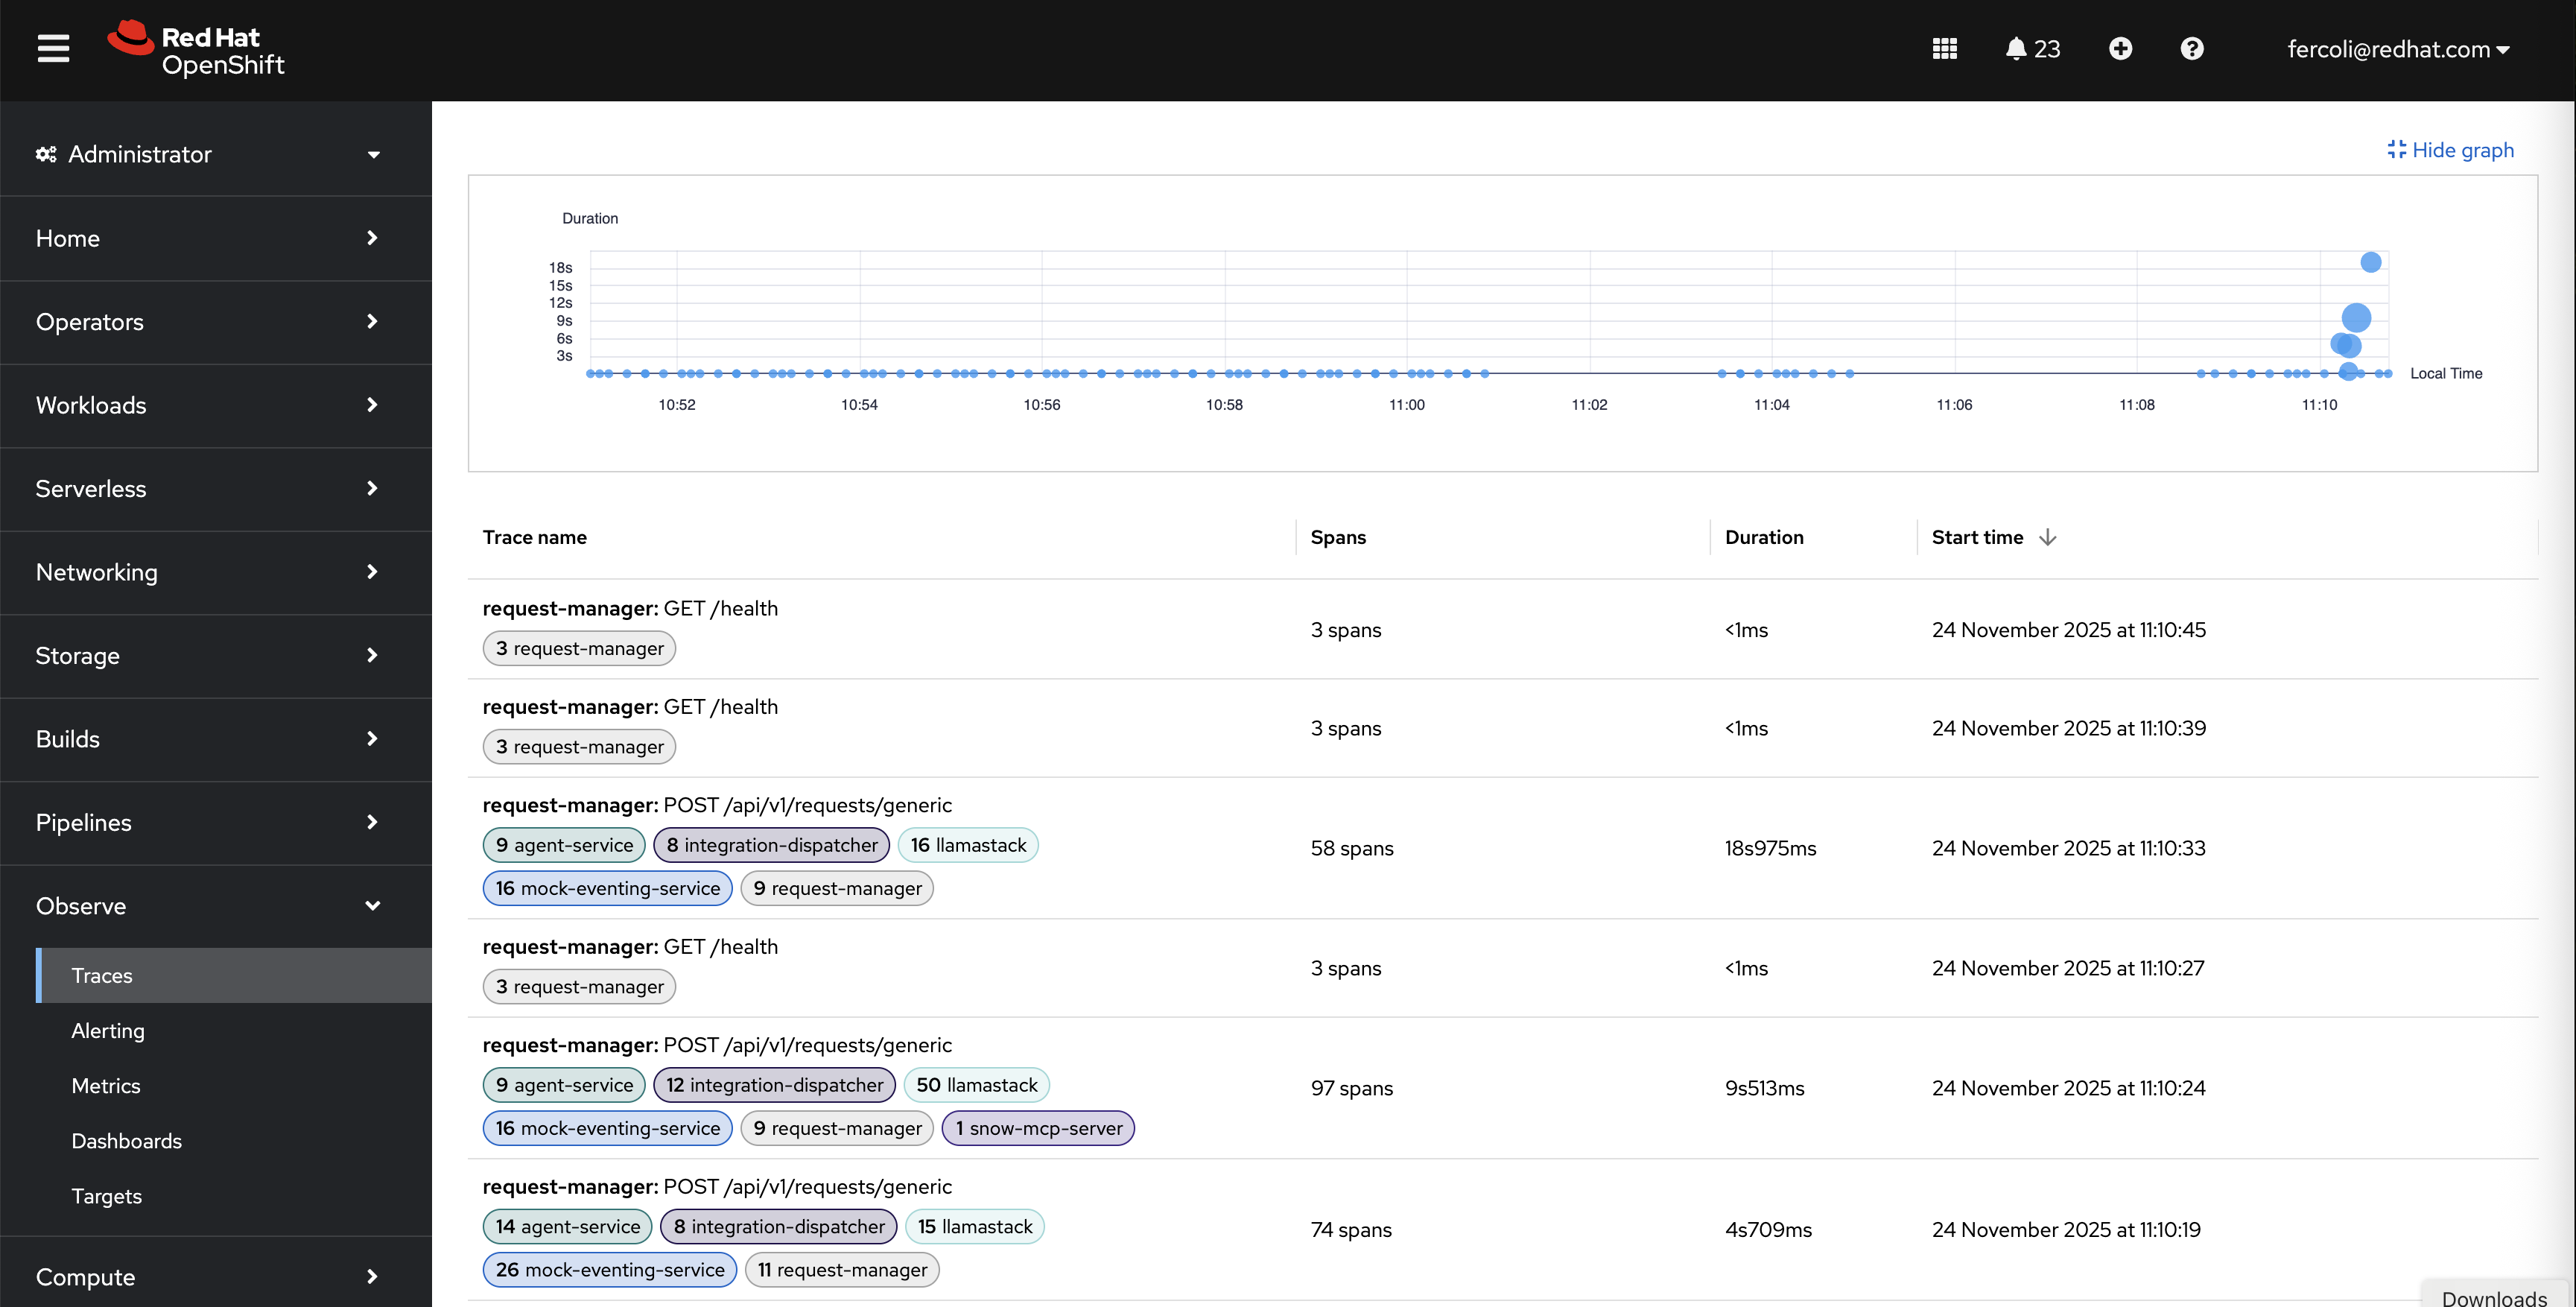
The interface filters tracing spans by criteria such as tenants, service name, namespace, status, duration, and custom attributes.
This view provides:
- Duration graph: A visual timeline that shows trace distribution and duration over time.
- Trace list: Filterable table of all traces with span counts, durations, and timestamps (see Figure 5).
- Service filtering: Filter traces by services such as
request-manager,agent-service,llamastack, andsnow-mcp-server. - Quick access: Click any trace to view detailed span breakdown.
The Red Hat build of OpenTelemetry Operator manages the opentelemetry.io/v1beta1.OpenTelemetryCollector custom resource. It is available through the OLM in the redhat-operators catalog. The operator handles the deployment, configuration, and lifecycle of OpenTelemetry Collector instances.
The lls-observability AI quickstart provides details on how to deploy Red Hat OpenShift Distributed Tracing.
Wrapping up
In this post, we covered how to instrument a Llama Stack-based agentic system with OpenTelemetry and shared lessons learned while developing the it-self-service-agent AI quickstart. Visit the it-self-service-agent repository to learn more about the overall implementation.
Next steps
Try it yourself! Run the AI quickstart (60-90 minutes) to deploy a working multi-agent system.
- Save time: You can have a working system in under 90 minutes rather than spending weeks building orchestration and evaluation frameworks from scratch. Start in testing mode to explore the system, then switch to production mode using Knative Eventing and Kafka when you are ready to scale.
- What you'll learn: Production patterns for AI agent systems that apply beyond IT automation, such as how to test non-deterministic systems, implement distributed tracing for asynchronous AI workflows, integrate LLMs with enterprise systems safely, and design for scale. These patterns transfer to any agentic AI project.
- Customization path: The laptop refresh agent is just one example. The same framework supports Privacy Impact Assessments, Request for Proposal (RFP) generation, access requests, software licensing, or your own custom IT processes. Swap the specialist agent, add your own MCP servers for different integrations, customize the knowledge base and define your own evaluation metrics.
Learn more
If this blog post sparked your interest in the IT self-service agent AI quickstart, here are additional resources.
- Browse the AI quickstarts catalog for other production-ready use cases, including fraud detection, document processing, and customer service automation.
- Questions? Open an issue in the it-self-service-agent GitHub repository.
- Learn more about the tech stack: