Debugging function parameters with Dyninst
Automate app analysis by using Dyninst to debug function parameters. The suite simplifies the process via dynamic and static analysis and instrumentation tools.

Automate app analysis by using Dyninst to debug function parameters. The suite simplifies the process via dynamic and static analysis and instrumentation tools.

C++17 is now the default version in the GNU Compiler Collection. Find out what you need to know when updating your code to C++17 with GCC 11.

Do you need a quick way to solve bugs in foreign library code? Learn how to use SystemTap for statement tracing and differential analysis in any library.

Easily switch between GCC and Clang for your RPM package. Learn the necessary changes and best practices to allow a spec file to build with both GCC and Clang.

Help GCC detect buffer overflows by using source-level annotations. This article describes three simple annotation types to detect out-of-bounds accesses.

Learn about Valgrind's undocumented --trace-flags option for debugging. The tutorial helps you add fused-multiply-add support for the AArch64 processor by Arm.
Discover which runtime languages, web servers, and databases are included in Red Hat Software Collections 3.7, as well as new updates to Developer Toolset 10.1.
Modern device drivers on servers need to exploit available CPUs to keep up with network traffic. Learn how using XDP and CPUMAP redirect boosts performance.
Pseudo-normal numbers represent a gap in floating point number classification in the long double format on Intel x86. Find out how glibc and GCC address it.
Get a quick overview of all the C++ standarization proposals that went before the ISO C++ Core and Evolution Working Groups in 2020.
Explore Clang compiler features like static analysis, sanitizers, and fuzz testing, and learn how building with multiple compilers benefits your projects.
Debugging memory errors can be challenging, and having the right tool helps. See how Valgrind and Sanitizers compare for common C and C++ memory errors.
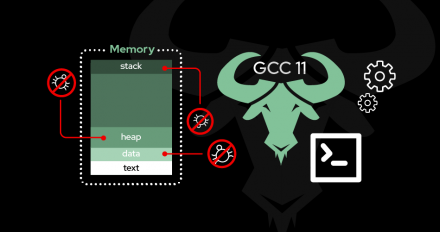
Explore more features in GCC 11 that can help detect dynamic memory bugs in C and C++, and learn about the compiler's limitations.
Want Clang to compile faster? Learn why optimizing the LineOffsetMapping function was a good start, and how it was optimized for both SSE and bithacks.
Learn how you can go back in time and replay what went wrong in a C/C++ program with rr (a GNU Debugger Linux enhancement) in this short demo.

Get an overview of the C/C++ performance and usability enhancements in OpenMP 5.0 and 5.1, including features now integrated in GCC 11.

Find out what's new in Red Hat Software Collections 3.7 and Red Hat Developer Toolset 10.1, including updated PostgreSQL, Ruby, and MariaDB collections.

Get introduced to the GNU Debugger (GDB) with this new series. Part 1 explores advanced startup options, faster command execution, and more.

Dynamic memory management bugs are hard to find and frequently targeted in C and C++ programs, but GCC 11's enhanced malloc attribute is here to help.

Find out about the new value range propagation abilities coming to GCC 11, and what else you can expect from Project Ranger in GCC 12.
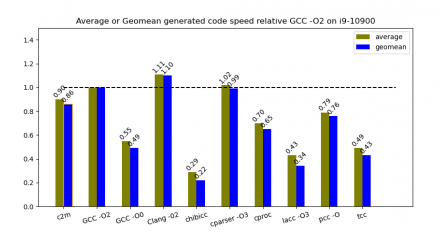
Find out how the MIR project's C JIT compiler and interpreter compares to other C compilers for generated code and compilation speed.

Find out how Valgrind Memcheck detects memory leaks in your C or C++ programs, and how to integrate Valgrind into your test suites for early detection.

The GNU C Library's iconv utility had a problem with hanging character set conversions. Learn how rewriting iconv's option parsing solved the issue.
Get a guided tour of using Visual Studio Code's remote SSH extension to edit and compile remote LLVM on your Fedora Linux operating system.
The GNU C Library's 2.33 release adds buffer overflow protection for C/C++ programs. Find out how _FORTIFY_SOURCE=3 improves overflow protection in glibc.