Imagine this: It's late. A major incident just rocked your production environment. Teams are scrambling, alarms are flying, and after some emergency actions, the site is back up. Crisis averted?
Not really.
When you finally sit down to figure out what actually happened, the most important thing—the logs—are gone. Overwritten. Lost in the rush. No clear trigger, no breadcrumbs, just a black hole where your root cause should be.
It's like showing up at a crime scene after the evidence has been wiped clean.
Too often, we run into incidents where critical system data is missing:
- System logs are gone when we need them most
- We don't know what triggered the failure
- Emergency recovery efforts erase the very clues we needed to investigate
This doesn't just delay resolution, it blocks it entirely. Without logs, your root cause analysis becomes a guessing game. Engineering teams lack the data they need to improve the product. Support teams can't explain what went wrong. And customer trust takes a hit.
Event-based FIR collector
We wanted to break this cycle. So we built a system utility tool that acts like a black box recorder for your production infrastructure. It's called the event-based automatic first information report (FIR) collector. The concept is simple but powerful: Automatically capture system context the moment an incident begins—not hours later, not after someone remembers to log in and collect data.
Here's what it does:
- Watches for key system events, like node failures, upgrades, workload expansions
- Triggers a must-gather process automatically
- Stores logs off site temporarily (1–2 days) so they're safe even if local systems go down
- Cleans up after the retention period, so there's no extra ops overhead
It works even when no one's physically on site. That's the beauty of event-driven automation.
Event-driven workflow
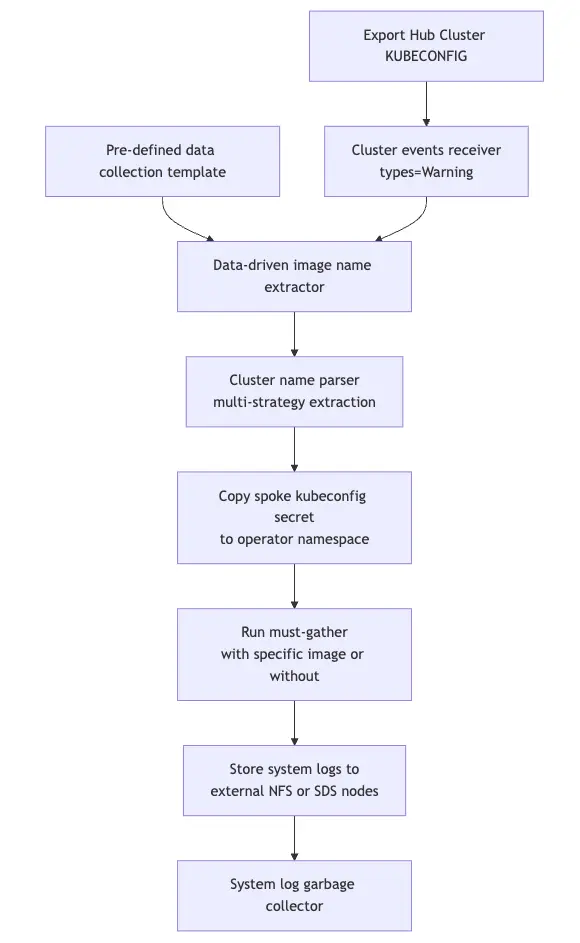
The workflow of event-based automatic first information report (FIR) collector is documented in the project's Git repository and illustrated in figure 1:
Real-world scenarios: Why this matters
We've seen this tool prove its worth in all kinds of production environments:
Direct site incidents
- Node replacements (scale in/out)
- OS or software upgrades
- CNF/workload expansions
Indirect incidents
- Unknown outages where customer teams have no idea what happened ("We walked in and the cluster was already down…")
This tool gives you instant historical insight—a snapshot of the system at the time of failure. It's a game-changer for post-incident reviews.
Why this tool is different
There are plenty of great tools in the observability space—Prometheus, OCP Telemetry, logging operators. But they all assume someone is watching, or that the logs will still be there when you go looking.
This tool works when no one's watching. It acts automatically and immediately, triggered by the event itself—not by a human response.
It's not here to replace Prometheus alerts or logging stacks—it complements them by filling the biggest gap: The moment right before everything breaks.
Event-driven pattern matching
This operator is specifically designed for multi-cluster environments, like those managed by Red Hat Advanced Cluster Management. It runs centrally on a hub cluster, keeping a watchful eye over your spoke (managed) clusters.
We've built this to be lean and extensible:
- Event triggers can be customized per cluster/site
- It integrates with existing must-gather payloads
- Log data can be sent to remote S3-compatible storage or other distributed systems
- You define the grace period for cleanup (typically 1–2 days)
In the future, we're looking at plug-and-play integration with AI models running on Red Hat OpenShift for root cause and defect escape analysis.
To understand how this works in practice, let's look at how the operator handles a failing spoke cluster without overwhelming the hub cluster.
Instead of heavy, continuous polling, the operator acts purely on Kubernetes events. An EventReconciler watches the hub cluster specifically for Type=Warning events. When a warning fires, the operator runs the event message through a pre-defined Go template engine that maps specific regex patterns to specialized must-gather images.
To see the full picture from event data to a regex match to the must-gather job execution, let's look at an example event payload and the core diagnostic rule configuration (internal/config/template.go):
// 1. Operator catches a Type=Warning event on hub
{
  "type": "Warning",
  "reason": "ETCDCorruption",
  "message": "ClusterDeployment spoke-prod-1 etcd database corruption detected",
  "involvedObject": {
    "kind": "ClusterDeployment",
    "name": "spoke-prod-1"
  }
}

// 2. Event message matches against pre-defined regex rules
func LoadTemplates() []DiagnosticRule {
    return []DiagnosticRule{
        {
            Name:    "ETCD Corruption",
            Pattern: regexp.MustCompile(`(?i)etcd.*database.*corruption`),
            Image:   "<your-registry>/diagnostic-operator-system/ose-must-gather:latest",
        },
        {
            Name:    "OVN Network Failure",
            Pattern: regexp.MustCompile(`(?i)Network.*CNI.*failed`),
            Image:   "<your-registry>/diagnostic-operator-system/ose-must-gather:latest",
        },
    }
}
Once a pattern matches (for example, an etcd corruption), the operator doesn't just blindly execute a script. Instead, it uses a multi-strategy priority parser to extract the specific spoke cluster's name from the event—checking the InvolvedObject.Kind, looking for a spoke- namespace prefix, or falling back to regex extraction.
After identifying the cluster, the operator dynamically copies the spoke cluster's kubeconfig secret into its own namespace and spins up a lightweight, independent Kubernetes job.
This job mounts a ReadWriteMany (RWX) PersistentVolume (backed by NFS or OpenShift Data Foundation) and executes the targeted must-gather.
This approach is completely non-blocking. The Hub operator goes right back to watching for events, while the Kubernetes job handles the hard work of log collection and relies on the cluster's native TTL controller to garbage-collect itself when finished.
Try it yourself
Reading about automated diagnostics is one thing, but watching it capture a volatile cluster state in real time is another.
You can test the event-driven diagnostic operator right now. The entire project is open source. Check out the architecture, the multi-strategy parsing logic, and the deployment manifests in the public repository.
To get started locally:
- Clone the repository and spin up a local cluster using Red Hat OpenShift Local.
- Ensure you have a ReadWriteMany (RWX) StorageClass available (NFS works great for testing).
- Follow the
README.mdinstructions from the Git repository to apply the RBAC and Deployment manifests. - Apply a test etcd warning event and watch the operator instantly spin up a diagnostic job!
Join the conversation, and what's next
We're just getting started. We want to hear from:
- SREs and customer operations team who have been burned by missing logs.
- Platform engineers looking to harden their observability strategy.
- Product teams curious about how this could tie into CI/CD pipelines or release validation.
- Anyone with thoughts on how to make this more powerful and user-friendly.
As OpenShift and Kubernetes administrators, we know that no two cluster environments fail in exactly the same way. I built this operator to solve a specific set of pain points in multi-cluster and Red Hat Advanced Cluster Management for Kubernetes environments, but I want to know how it fits into your workflow.
Currently, the diagnostic rules are compiled into the operator, but moving to dynamic, CRD-based rule management is on the roadmap. If you have ideas for new default diagnostic triggers, want to contribute to the CRD migration, or just want to share how you are using it, please drop by the GitHub repo and open an issue.
Thanks to Didier Wojciechowski and Kirsten Laskoski for reviewing this article.

