We are glad to announce that the cluster observability operator 1.4 release introduces a technology preview of the Red Hat build of Perses in the Red Hat OpenShift Container Platform and Red Hat Advanced Cluster Management for Kubernetes consoles.
Overview and benefits
Red Hat build of Perses is a downstream version of the open source Perses project, functioning as a dashboarding tool designed specifically for displaying observability data. It features native support for Kubernetes role-based access control (RBAC) to ensure secure access to visualizations.
The cluster observability operator ships Red Hat build of Perses, which acts as a central hub that simplifies the OpenShift user journey by consolidating the installation, management, and visualization of observability components. In other words, it is a meta-operator that deploys standalone monitoring stacks, correlates observability signals, and manages user interface (UI) plug-ins that integrate directly into the OpenShift web console.
This release brings several new capabilities:
- Dashboard management UI: A new subtab navigates to a dashboard list page where users can filter, sort, create, delete, rename, and duplicate dashboards.
- Direct editing: Users can edit dashboard contents, including panels, PanelGroups, and variables directly through the OpenShift user interface.
- Grafana import tool: An import feature allows users to upload or paste Grafana JSON or YAML configurations, automatically detected and converted into PersesDashboard resources.
- Datasource configuration: Administrators can now configure observability data sources through custom resources (CRs) in the web console. This includes support for metrics (Prometheus and Thanos), logging (Loki), and tracing (Tempo).
- Built-in RBAC roles: The operator automatically deploys specific ClusterRoles (e.g., persesdashboard-viewer-role, persesdatasource-editor-role) to manage permissions for dashboards and datasources.
Key benefits of leveraging Red Hat build of Perses for OpenShift users include:
- Simplified Grafana migration: OpenShift users transitioning from legacy stacks can easily port their existing Grafana dashboards using the UI import tool, CLI, or Go SDK. Furthermore, users can leverage community mixins (prebuilt, modular dashboards for workloads like Kubernetes or Node) to rapidly adopt key observability metrics without rewriting dashboards from scratch.
- Intuitive UI experience and customizable dashboards: By embedding dashboard creation and editing directly into the OpenShift console, users experience a unified workflow and avoid the need to manage complex YAML files manually or switch to external dashboarding platforms.
- Enhanced security and scoping: Native Kubernetes RBAC integration means the dashboard list automatically filters to show only resources a user has authorization to view. Administrators can securely restrict data visibility by choosing between a PersesDatasource (locked to a specific project) and a PersesGlobalDatasource (accessible across all projects).
Next, we’ll describe two guides to help you get started. One demonstrates how to build your own customized dashboards within the OpenShift console, and the other provides a step-by-step guide for migrating your existing Grafana dashboards to Perses.
Customizable dashboards guide
An interactive tutorial demonstrates how to create your own dashboard in the OpenShift console. This tutorial specifically covers how to import a dashboard and how to edit a table panel, which includes adding column settings, conditional format, and links.
New dashboard features
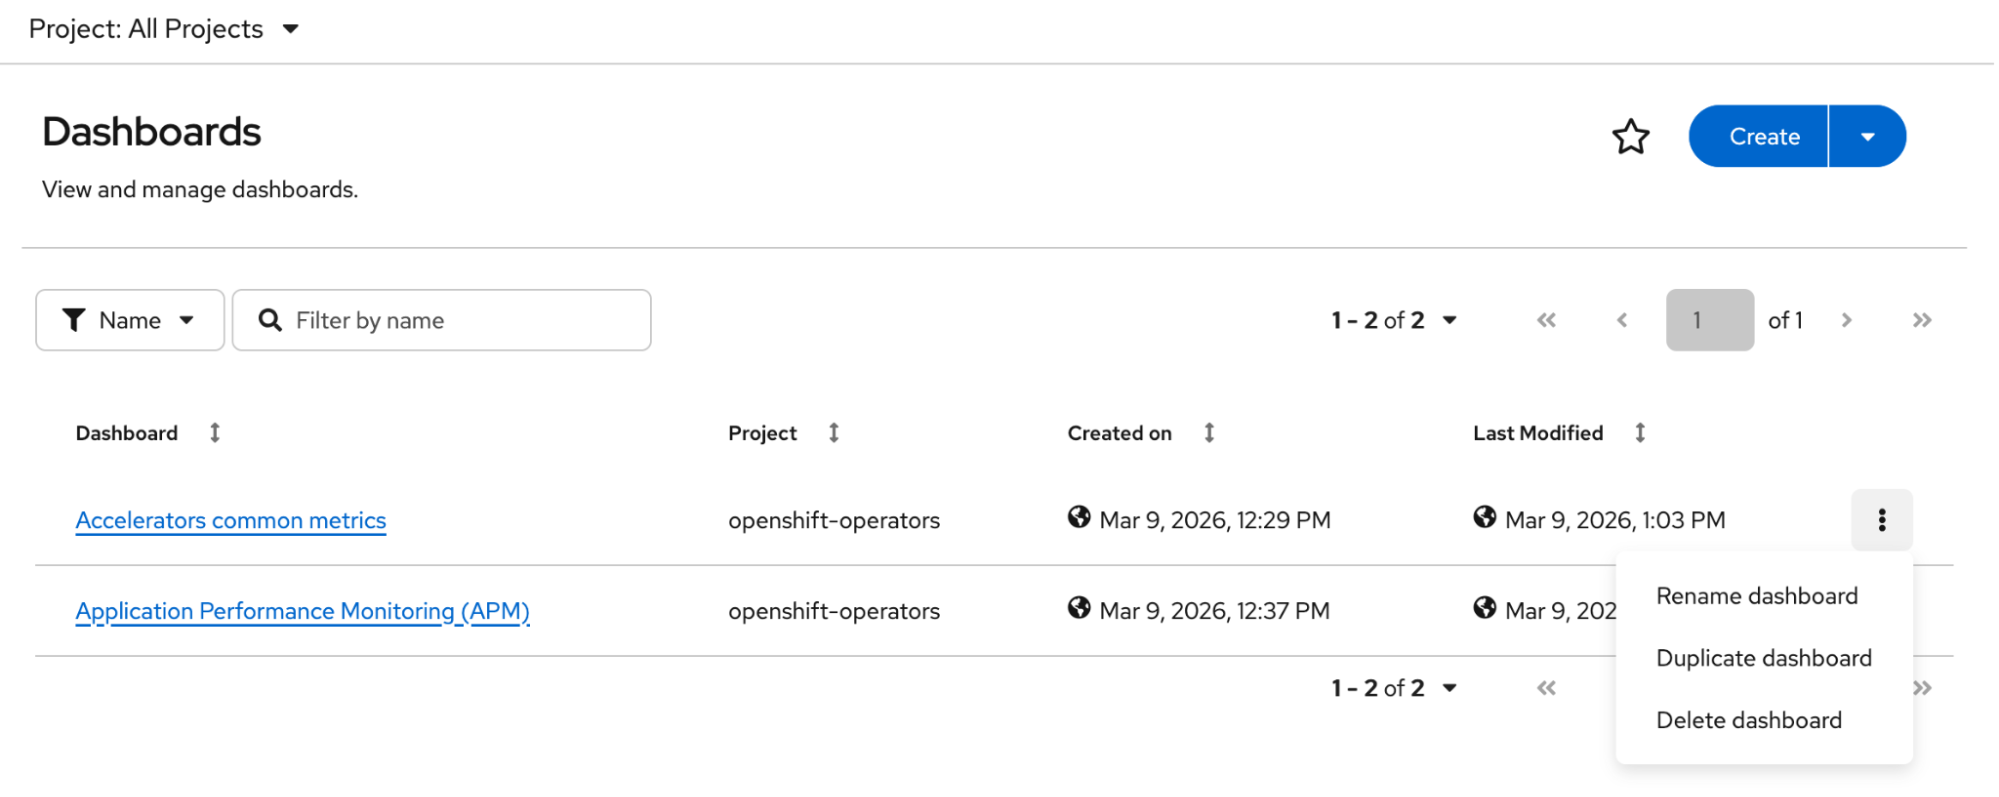
Now the dashboard subtab navigates to the dashboard list page, which allows users to quickly view, filter, and sort a list of dashboards in a project. On this page, users can delete, rename, and duplicate dashboards through the user interface, making dashboard management easier and more intuitive (Figure 1). With native support for Kubernetes role-based access control (RBAC), Red Hat build of Perses ensures that the displayed list of dashboards is limited only to those the current user is authorized to access.
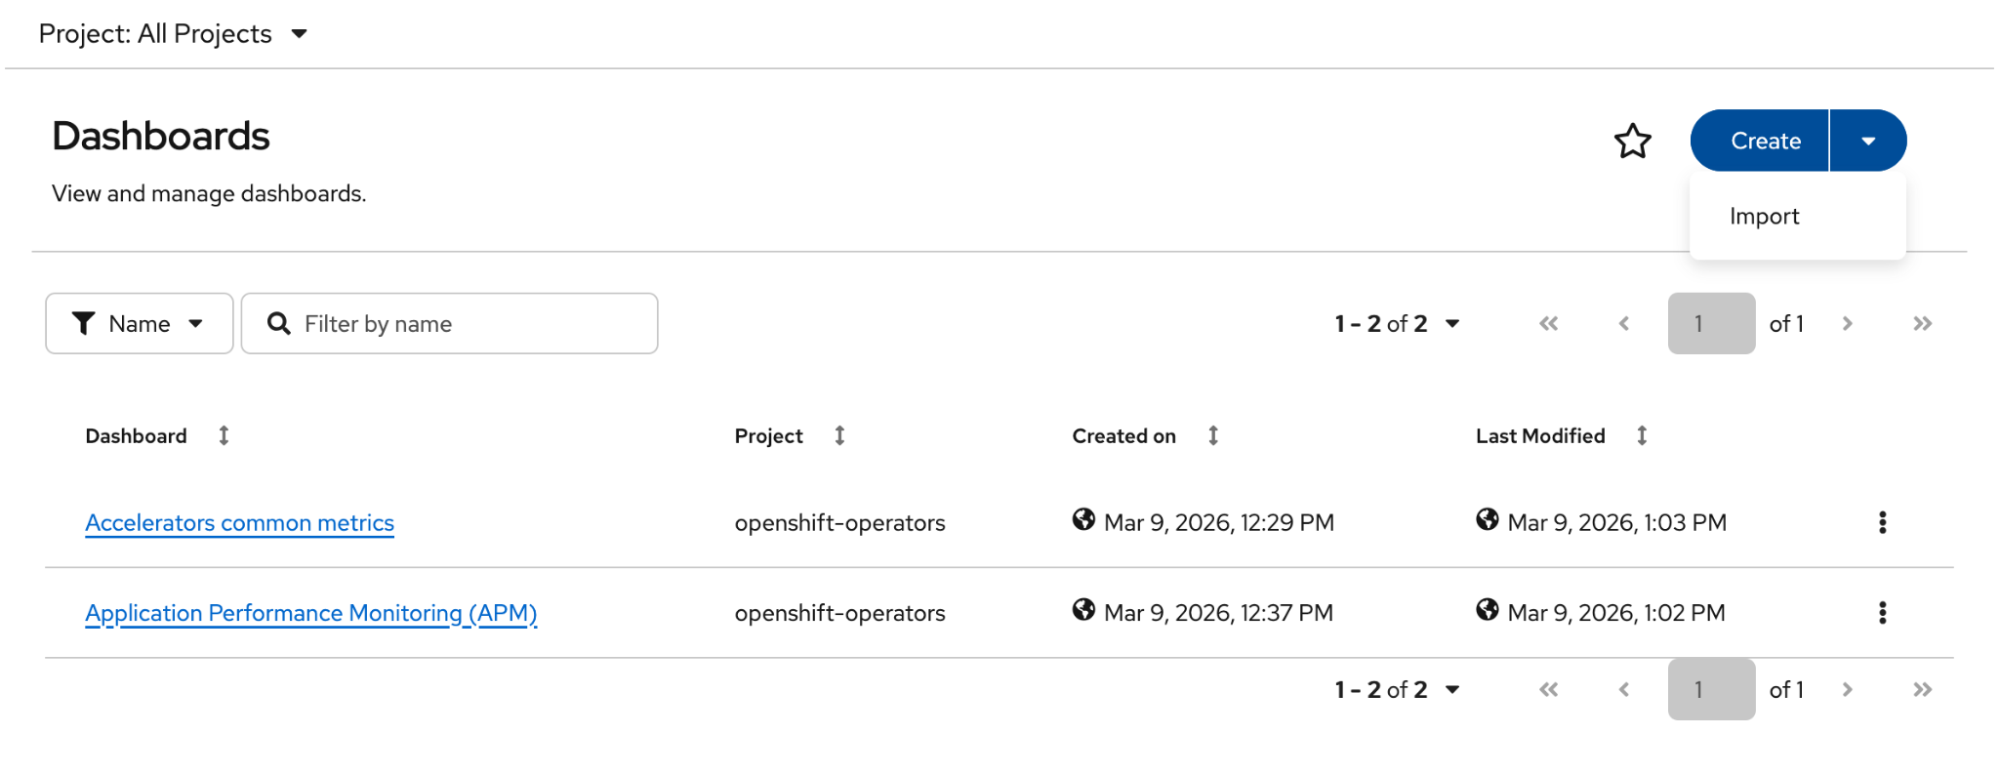
Users can also create and import dashboards on this page (Figure 2).
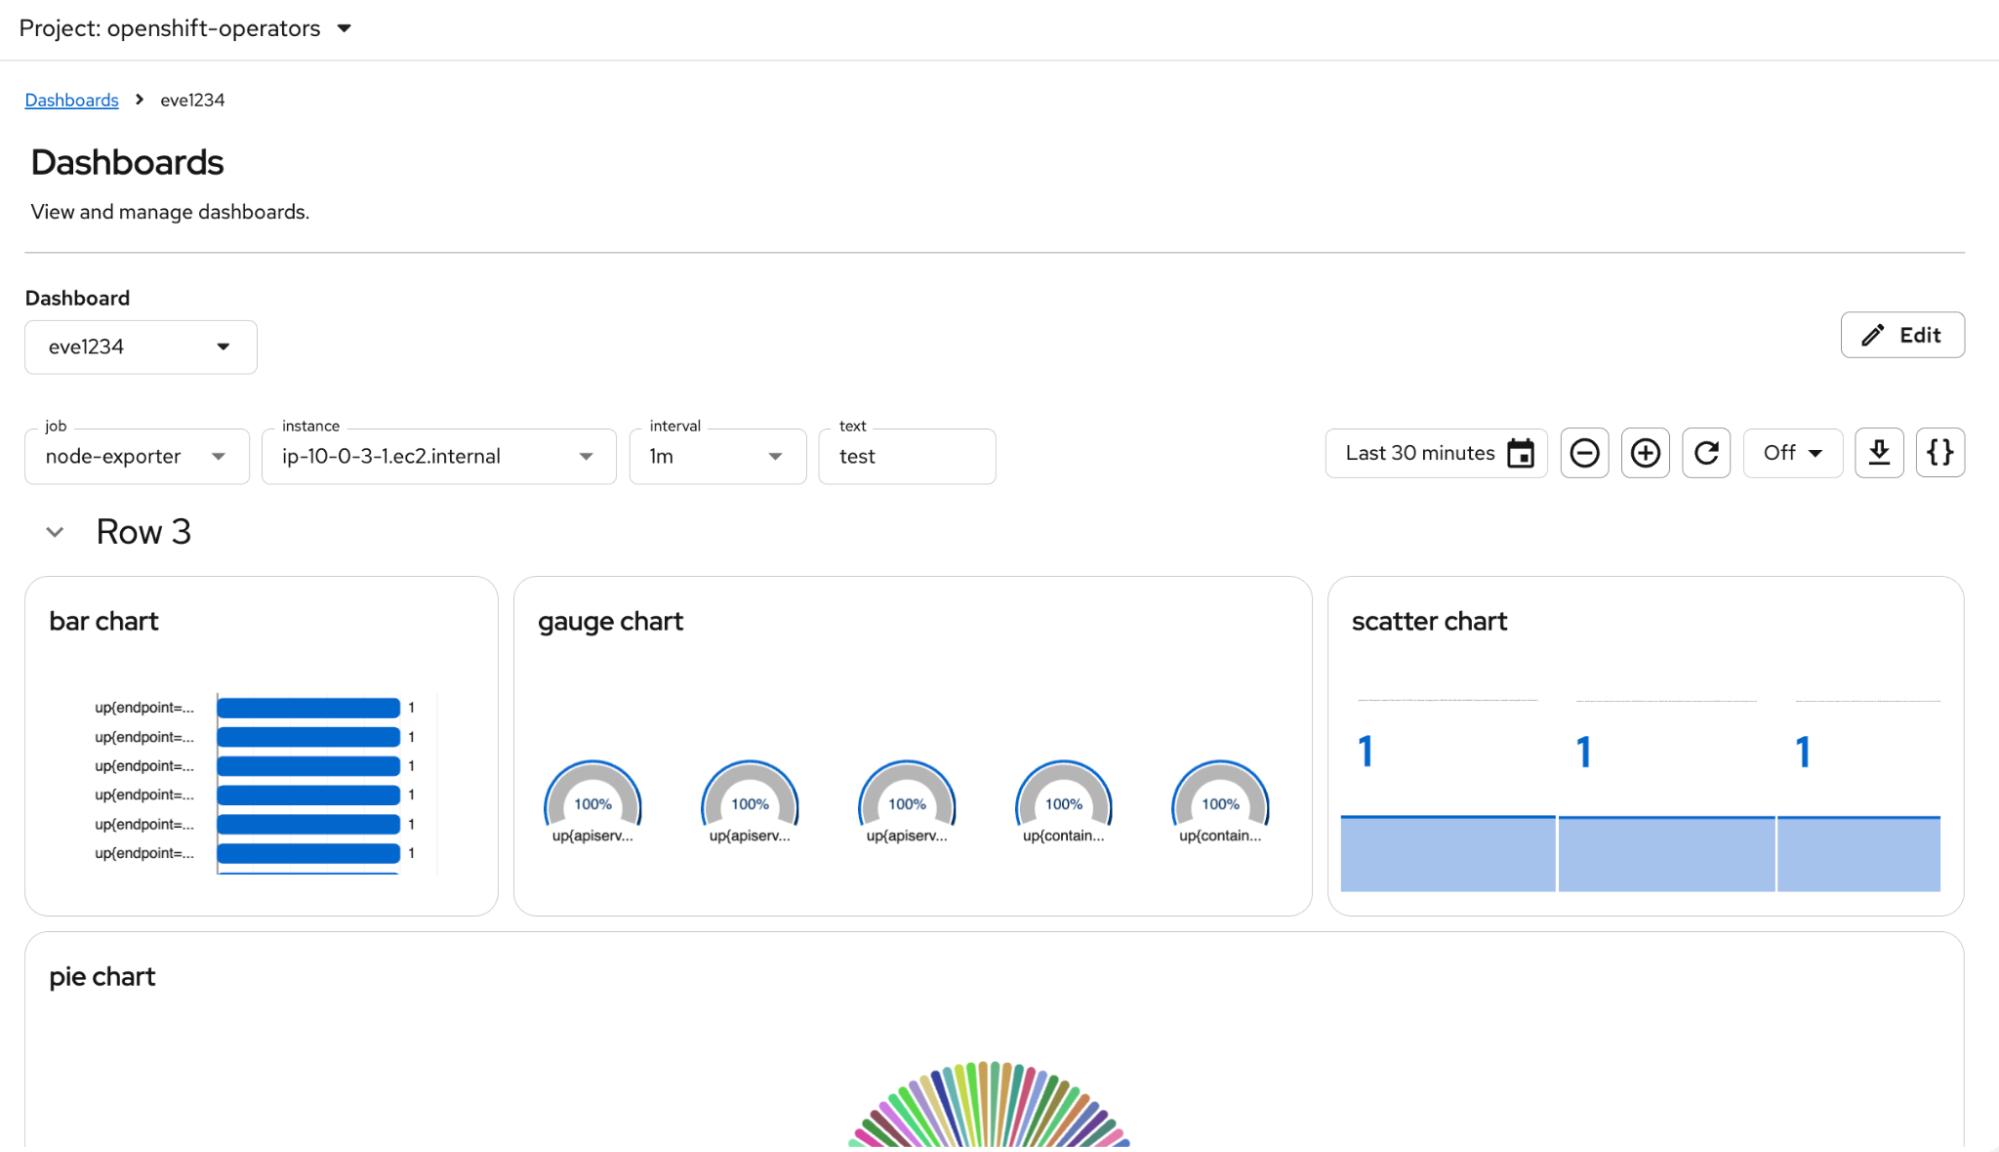
Clicking on a dashboard from the list takes you to the dashboard page. You can edit the contents of dashboards directly through the user interface. On the top right of each dashboard page, you’ll find an Edit button (Figure 3).
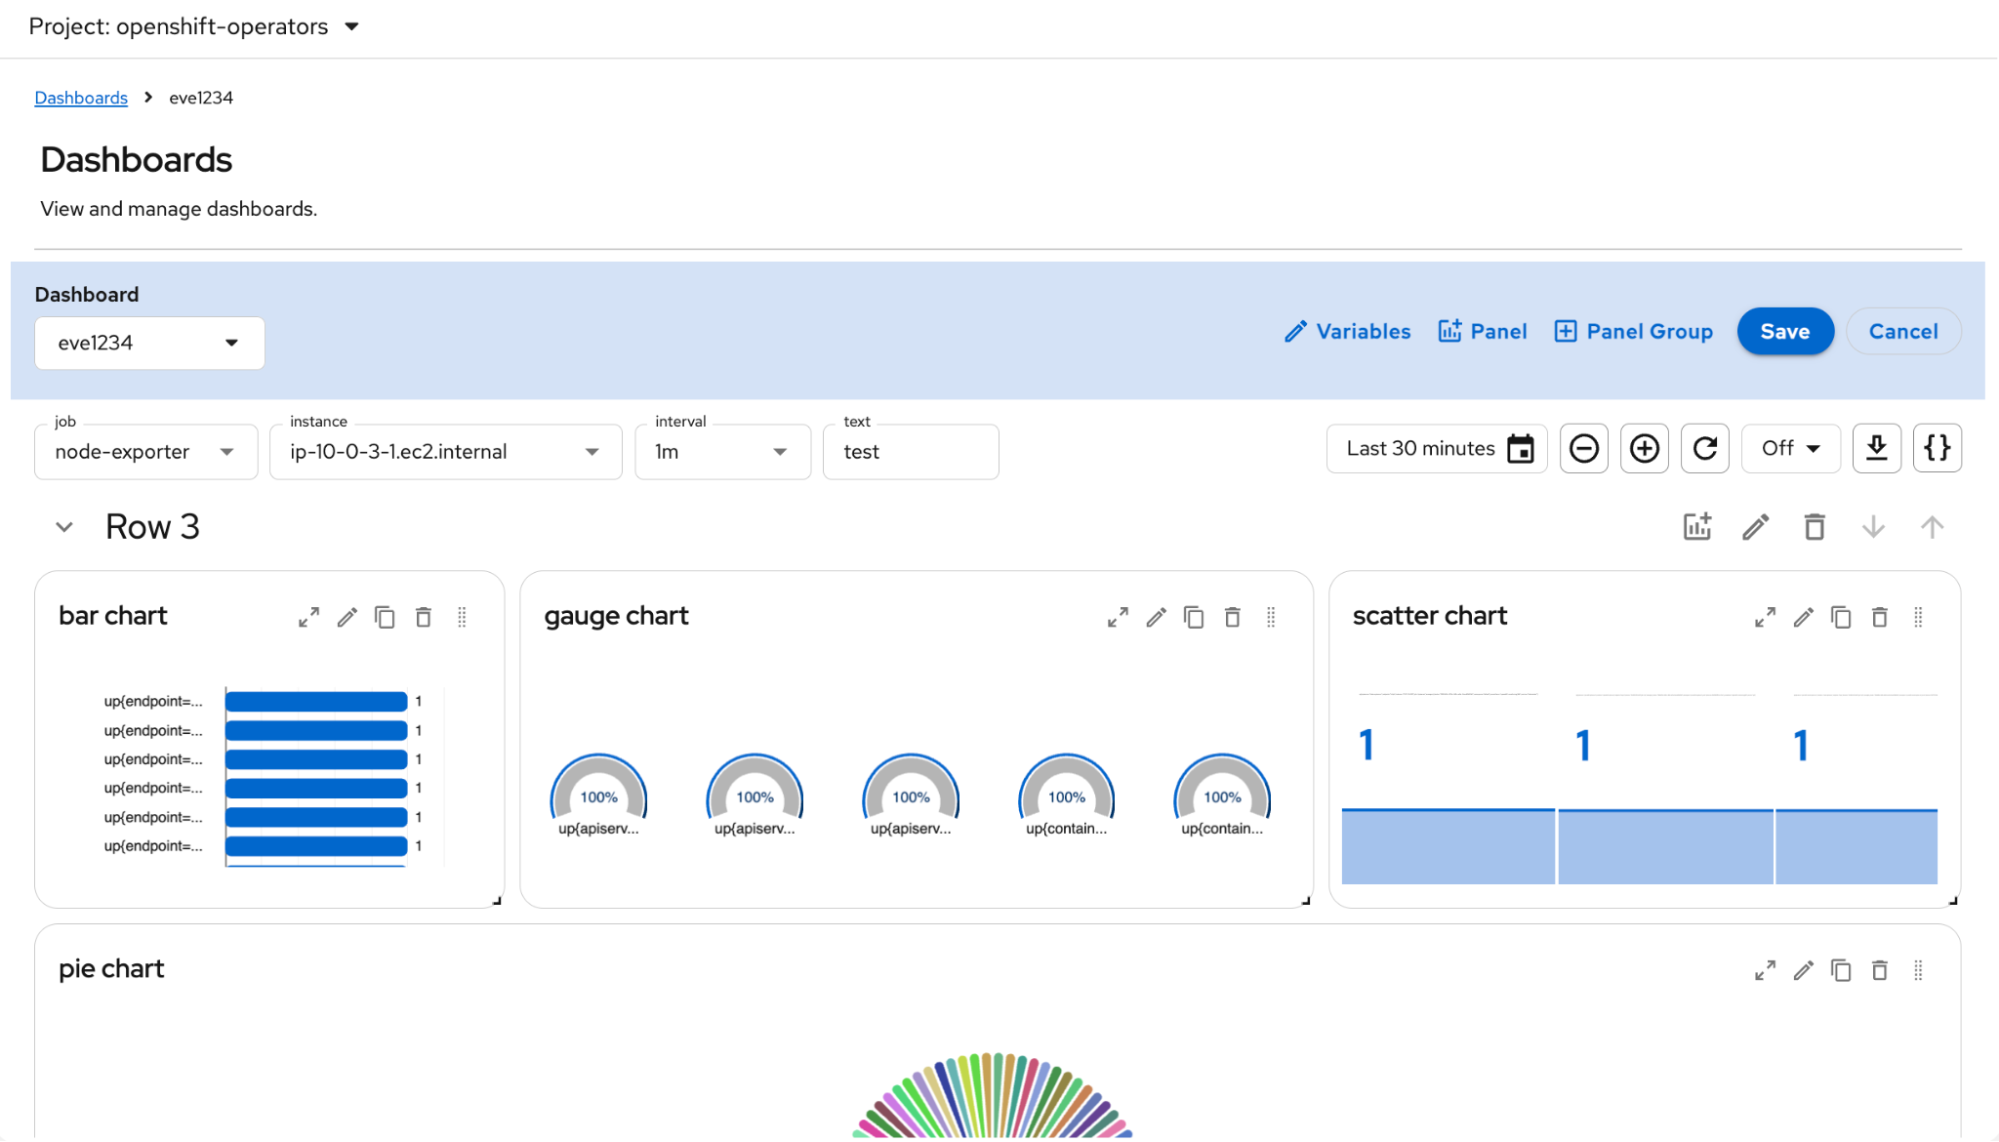
Click Edit to reveal options for managing panels, PanelGroups, and variables. In the top right-hand corner of each panel, you’ll see more options to expand, edit, duplicate, delete, and move the panel (Figure 4).
Install a single cluster
You can install Red Hat build of Perses for a single cluster through the UI following these steps:
- Install the cluster observability operator from the software catalog.
- Once it’s installed, scroll the horizontal tab menu and click on the UIPlugin tab.
- Click Create UIPlugin.
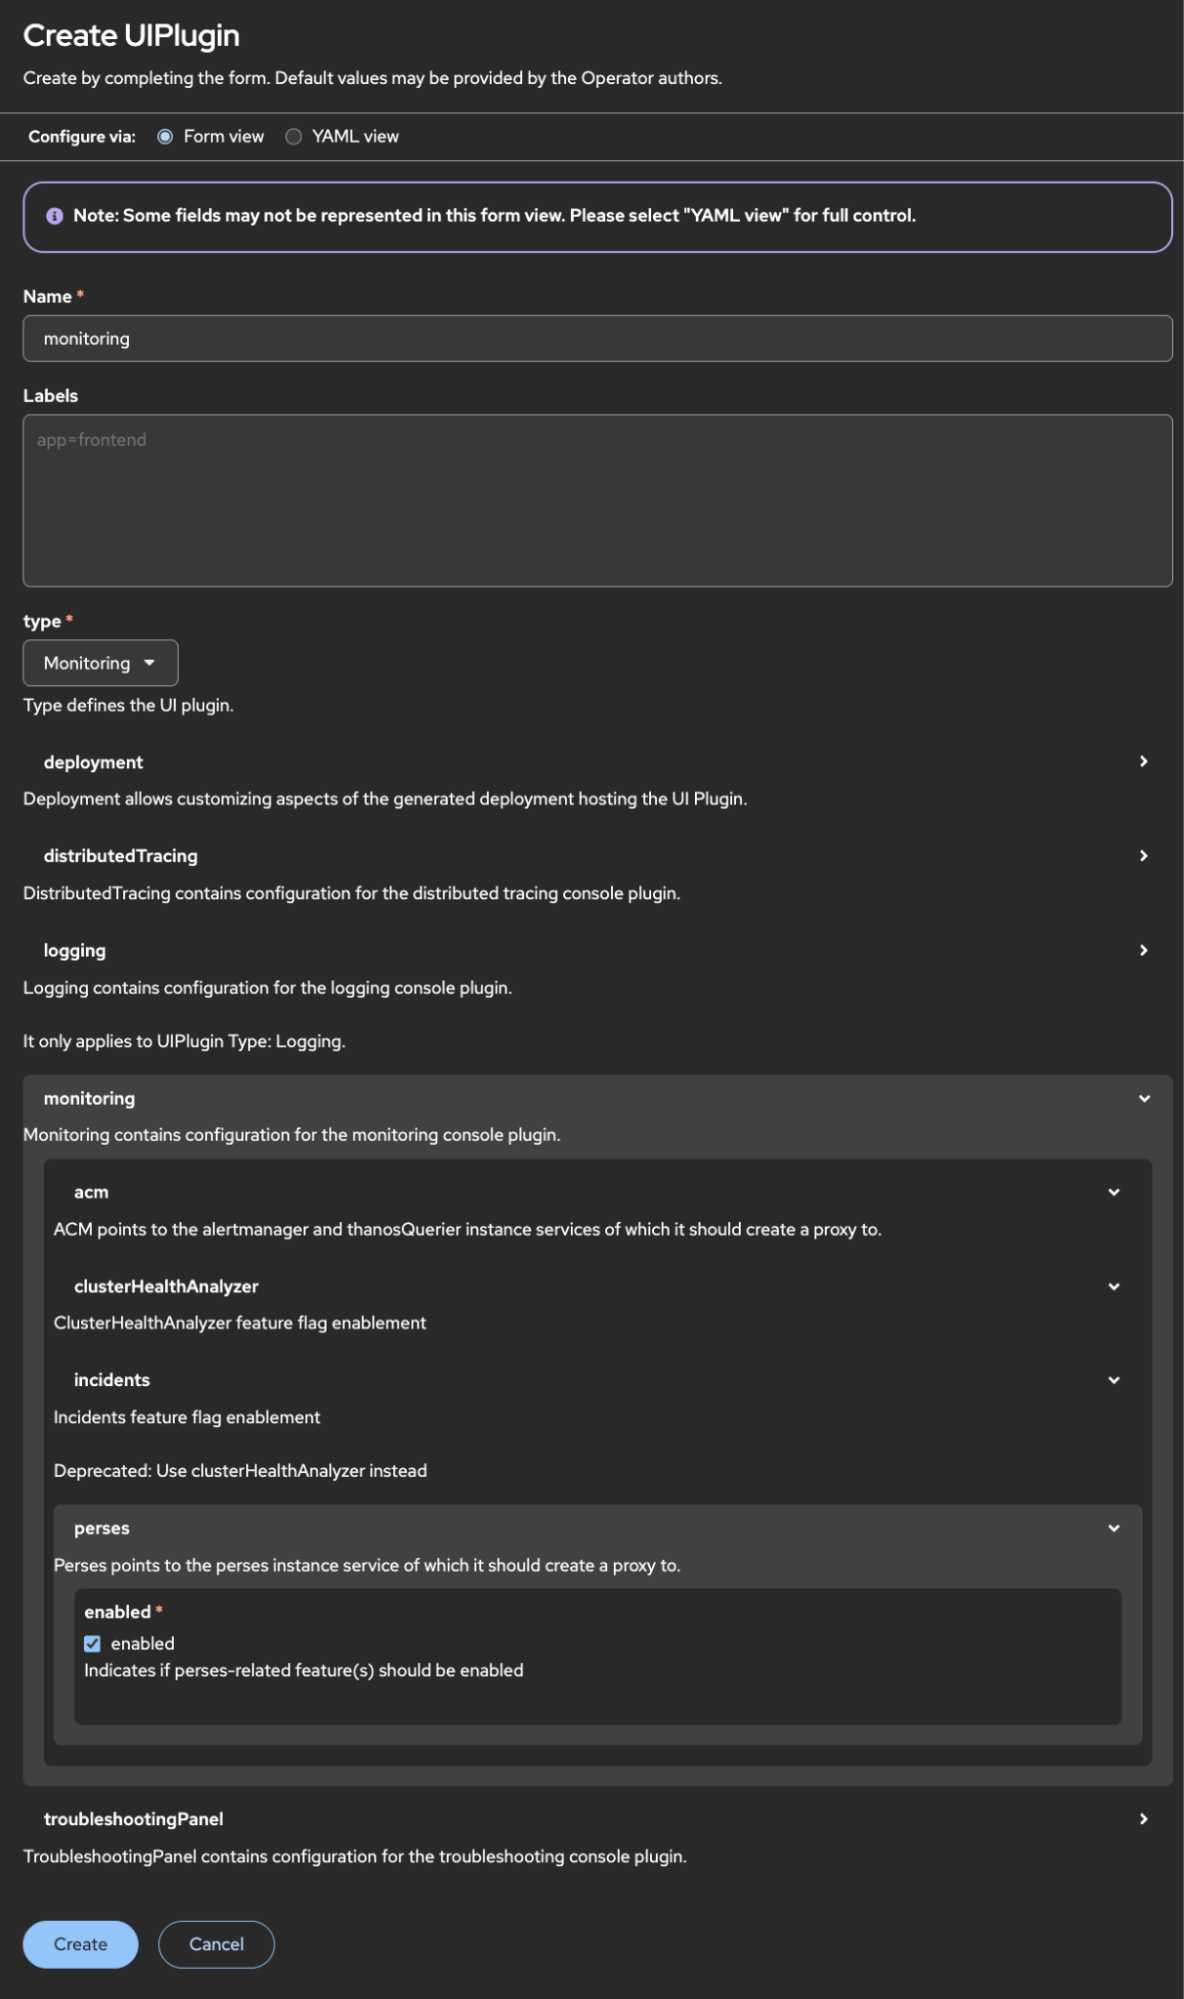
- Fill out the form (Figure 5).
- Name: monitoring
- Type: monitoring
- Click on the expandable section labeled monitoring.
- Click on the expandable section labeled perses.
- Check enabled.
- Click Create.
In the openshift-cluster-observability-operator project, the following Perses resources will be created:
- Perses instance
- PersesDashboards
- Accelerators common metrics
- Applications performance monitoring (APM)
- PersesDatasource
- Accelerators-thanos-querier-datasource
After the monitoring UIPlugin’s condition is Reconciled, Available, click Observe, then click Dashboards (Perses).
Import feature
To support the Grafana to Perses migration, the import feature allows users to directly copy and paste or upload a YAML or JSON dashboard into the pop-up dialog to create a PersesDashboard. Next to the create button, you’ll see a dropdown with additional options. Click this to reveal the ability to import (Figure 2).
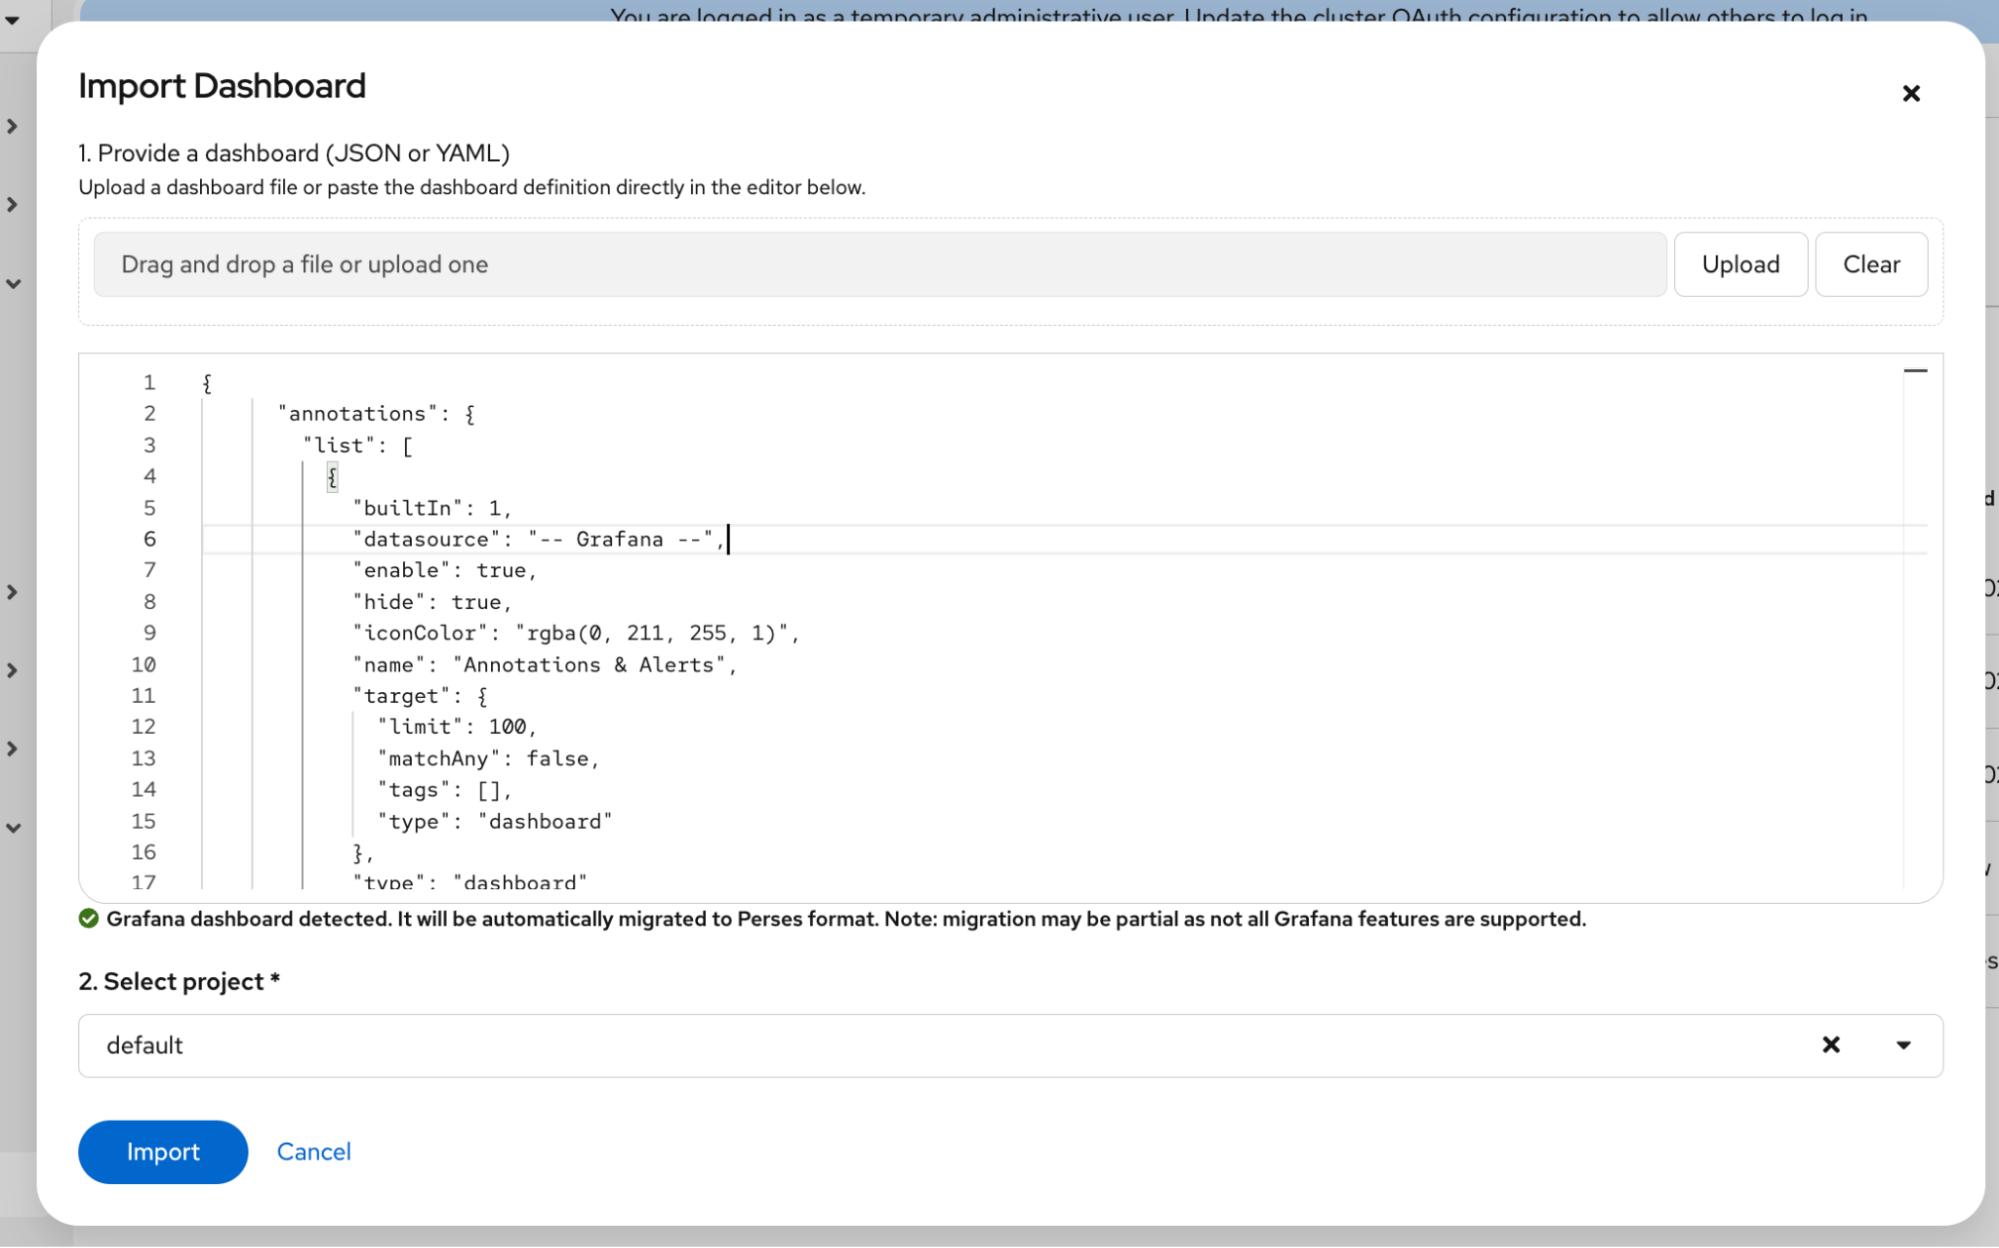
Clicking this opens a dialog box where you can either upload or paste a YAML or JSON dashboard (Figure 6). The feature automatically detects the given format and converts it to a PersesDashboard. Upon clicking import, your browser will navigate to the dashboard page. Only those with access to the project can view the dashboard.
Create
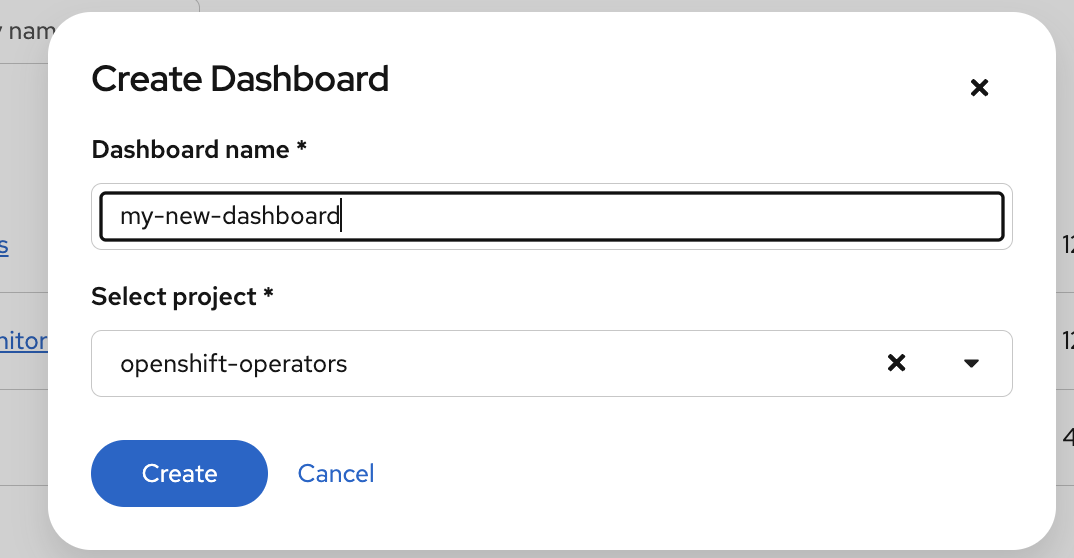
Now you will select a project to place the PersesDashboard resource. Clicking the Create button opens a dialog box (Figure 7) that lets users name the dashboard and select the project to place the PersesDashboard.
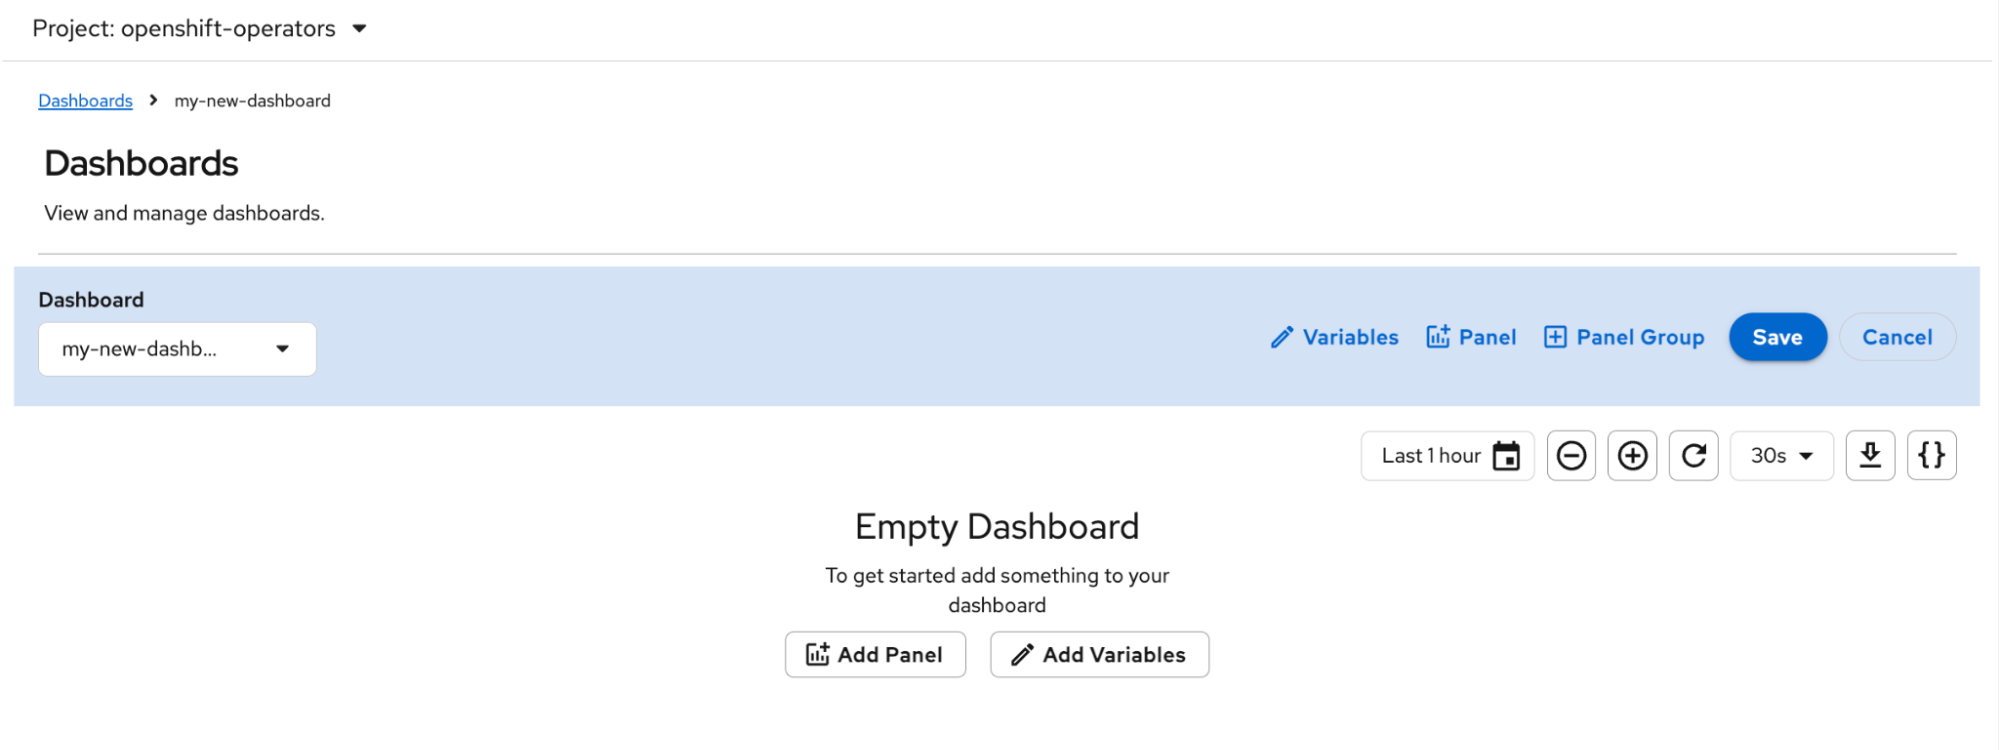
The browser will automatically navigate to the dashboard page, displaying an empty dashboard, which users can further modify and save (Figure 8).
Dashboard page: Add panel
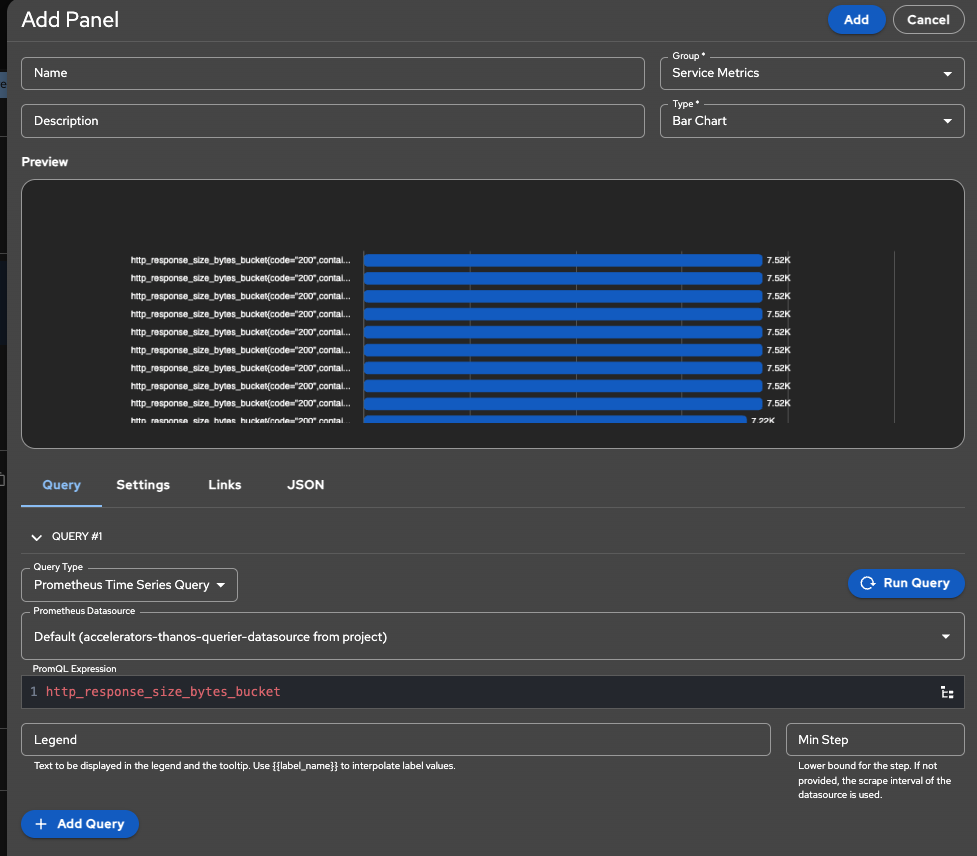
Upon clicking Edit and then Panel (Figure 4), a side drawer titled Add Panel (Figure 9) will open. Selecting the type will determine what query type and datasources will be available. Select the panel Type, Query Type, Datasource, and enter a query expression.
To add another query expression, click Add Query. You can preview the panel by clicking Run Query. Once you’re satisfied with the configurations, click Add at the top right-hand corner to add the panel to the dashboard.
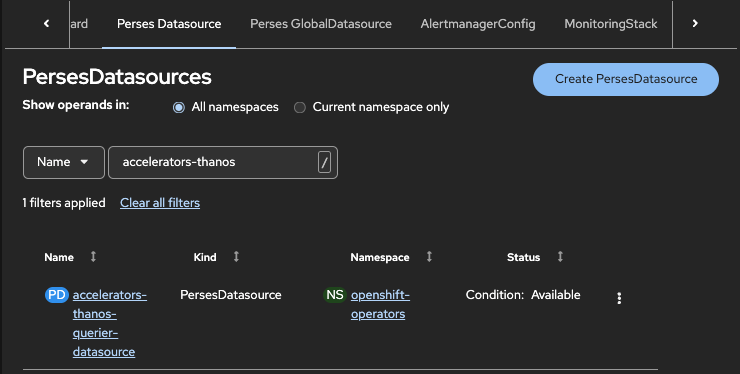
Adding a new panel requires selecting a PersesDatasource or a PersesGlobalDatasource. The difference between these resources is that PersesDatasources are namespaced and accessible only within their respective projects. For example, take a look at Figure 10. The PersesDatasource accelerators-thanos-querier-datasource is deployed in the openshift-operators project. Only PersesDashboards created in openshift-operators will have access to the accelerators-thanos-querier-datasource.
Otherwise, if you would like the datasource to be accessible across all projects, use the PersesGlobalDatasource. Administrators can configure observability datasources through CRs in the web console (Figure 10).
Metrics configuration
The following are examples of how to configure metrics, logging, and tracing data sources.
Deploy the PersesDatasource accelerators-thanos-querier-datasource with the cluster observability operator (Figure 10).
The next example features logging with Loki. To create a Loki instance, refer to the OpenShift Container Platform documentation. Create the PersesDatasource or PersesGlobalDatasource to point to the Loki instance. The following is an example configuration for Loki application logs:
apiVersion: perses.dev/v1alpha2
kind: PersesDatasource
metadata:
 name: loki-datasource
 namespace: openshift-logging
spec:
 config:
   display:
     name: "Loki Datasource (Application Logs)"
   default: true
   plugin:
     kind: "LokiDatasource"
     spec:
       proxy:
         kind: HTTPProxy
         spec:
           # URL structure for LokiStack with openshift-logging tenancy:
           # https://{gateway-svc}.{ns}.svc:8080/api/logs/v1/{tenant}
           # Perses will append /loki/api/v1/... for queries
           url: https://logging-loki-gateway-http.openshift-logging.svc.cluster.local:8080/api/logs/v1/application
           headers:
             X-Scope-OrgID: application
           # IMPORTANT: Must reference secret for TLS config
           secret: loki-datasource-secret
 client:
   tls:
     enable: true
     caCert:
       type: file
       certPath: /ca/service-ca.crt
The panel that supports Loki is Logs table.
In the next example, we will trace with Tempo. To create a Tempo datasource, refer to the OpenShift Container Platform documentation. Create the PersesDatasource or PersesGlobalDatasource that points to the Tempo instance. The following is an example PersesGlobalDatasource configuration:
apiVersion: perses.dev/v1alpha2
kind: PersesGlobalDatasource
metadata:
  name: tempo-platform
spec:
  config:
    display:
      name: "Tempo Datasource"
    default: true
    plugin:
      kind: "TempoDatasource"
      spec:
        proxy:
          kind: HTTPProxy
          spec:
            url: https://tempo-platform-gateway.openshift-tracing.svc.cluster.local:8080/api/traces/v1/platform/tempo
            headers:
              X-Scope-OrgID: platform
            secret: tempo-platform-secret
  client:
    tls:
      enable: true
      caCert:
        type: file
        certPath: /ca/service-ca.crt
The panels that support Tempo Trace Query are Trace Table and Trace Gantt Chart.
Role-based access control permissions
The following ClusterRoles are deployed with the cluster observability operator by the Perses operator:
persesdashboard-editor-role
persesdashboard-viewer-role
persesdatasource-editor-role
persesdatasource-viewer-role
persesglobaldatasource-editor-role
persesglobaldatasource-viewer-role
viewer-roles: apply read-only permissions to the given resource
editor-role: apply create, read, update, and delete permissions to the given resource
When assigned via ClusterRoleBinding, a user has access to all Perses dashboards and datasources in all namespaces/projects. When assigned via RoleBinding, the user has access to all Perses dashboards and datasources in the given namespace/project.
The following RoleBinding illustrates how to allow user1 to view all dashboards in the my-namespace namespace:
kind: RoleBinding
apiVersion: rbac.authorization.k8s.io/v1
metadata:
  name: user1-viewer-dashboard
  namespace: my-namespace
subjects:
  - kind: User
    apiGroup: rbac.authorization.k8s.io
    name: user1
roleRef:
  apiGroup: rbac.authorization.k8s.io
  kind: ClusterRole
  name: persesdashboard-viewer-role
---
kind: RoleBinding
apiVersion: rbac.authorization.k8s.io/v1
metadata:
  name: user1-viewer-datasource
  namespace: my-namespace
subjects:
  - kind: User
    apiGroup: rbac.authorization.k8s.io
    name: user1
roleRef:
  apiGroup: rbac.authorization.k8s.io
  kind: ClusterRole
  name: persesdatasource-viewer-role
Migration guide: From Grafana to Perses
In this section, we'll discuss how to leverage the Perses UI and the Go SDK and CLI. Users can migrate their Grafana dashboards to Perses dashboards using the official tools provided by Perses, which support both a graphical interface, a Go SDK, and a command line interface (CLI). The migration process focuses solely on dashboards, not on other Grafana resources like alerts or users.
Migration using the UI:
- Navigate to Observe > Dashboard (Perses).
- In the top right hand corner, there will be a Create button. Click the dropdown next to it and select the Import option.
- A dialog box will appear.
- Paste your Grafana dashboard YAML/JSON or upload the dashboard YAML/JSON file.
- Select a project to place the new Perses dashboard.
- Click Import. If successful, the new Perses dashboard will be displayed.
Migration using the Perses Go SDK allows you to define your old dashboard as Go code, either from scratch or by utilizing a community mixing.
Migration using the CLI:
- Install the
percliCLI and log in to your Perses instance. - Use the migration command as follows:
percli migrate -f grafana-dashboard.json --online -o json > perses-dashboard.json- The
--onlineflag contacts the Perses server for the latest plug-in translation logic. - Then you can inspect the migrated JSON dashboard, and edit (e.g., to adjust datasources), and apply it to your chosen project using:
percli apply -f perses-dashboard.json --project my-project
- The
- Offline migration requires special folders for charts, queries, and variables, but it is less commonly used.
Supported features and limitations
Only Grafana dashboards are officially supported for migration. The translation strives to match panels, queries, variables, and layout as closely as possible, but some features, especially those relying on unsupported plug-ins or advanced variables, may not migrate fully. Prometheus queries are most likely to be fully supported, while dashboards using other data sources or custom panel plug-ins may require manual adjustment post-migration.
Migration API
Perses also provides an API endpoint for migrating Grafana dashboards, which returns the translated result, further supporting automated and programmatic migration.
In summary, migrating dashboards from Grafana to Perses involves exporting your Grafana dashboard as JSON, then using Perses' UI or CLI tools to import and convert the dashboard to the Perses format. Due to feature differences, users may need to manually review and adjust the migrated dashboards for completeness.
Leveraging community mixins for easier migration
Users can leverage community mixins and community-maintained dashboards to ease the migration from Grafana to Perses by making use of prebuilt, modular, and reusable observability dashboards tailored for Perses. These Community Mixins, especially those in the Perses Community Dashboards project, provide both ready-to-use and extensible dashboards for Prometheus-based setups.
Community Mixins are packages of metrics, dashboard panels, and alerts, most often maintained for observability tools like Prometheus, Kubernetes, and Thanos. Perses community dashboards use "dashboards as code" practices with Go-based SDKs, providing type-safety and composability.
How to use community mixins for migration
Instead of recreating common dashboards from scratch or porting each Grafana visualization individually, users can adopt pre-made panels and dashboard modules from the Perses community-dashboards repository. These dashboards are usable as YAML templates "as-is" or can be imported into your configuration as Go modules, allowing tailored composition, overrides, or extension for your specific needs.
The modular design lets users select standard panels, such as CPU or memory utilization, and assemble them into customized dashboards for their own services. This ensures best practices and shared standards while minimizing repetitive dashboard rewriting.
Workflow example
Find the community dashboard suited for your workloads (e.g., Kubernetes, Node, Thanos) in the Perses community-dashboards repository.Use the YAML (or the Go module) directly or adapt it for your environment.
Combine these panels with other dashboards migrated from Grafana (using the Perses migration tool or UI) to achieve broad coverage and quick adoption of key observability metrics.
Benefits over traditional mixins
The Red Hat build of Perses significantly lowers the barrier to entry for teams by offering improved consistency and composability across projects. This is achieved through the community library, which utilizes Go and YAML instead of complex Jsonnet tooling or template maintenance. This choice of technology makes validation and versioning easier and more reliable. Furthermore, the community actively maintains and curates these dashboard templates to support new Perses releases and plug-in additions.
By leveraging community mixins and dashboards, organizations reduce migration time and complexity, reuse shared observability standards, and avoid duplicating dashboard configuration efforts during their transition from Grafana to Perses.
Wrap up
The cluster observability operator 1.4 introduces a technology preview of the Red Hat build of Perses, an open source dashboarding tool now integrated into the OpenShift and ACM consoles. This release simplifies the user experience by offering a new dashboard management UI for creating, editing, and managing dashboards directly within the console, including native support for Kubernetes RBAC for enhanced security. A key feature is the Grafana import tool, which allows OpenShift users to easily migrate existing Grafana dashboards into Perses, with the option to leverage community mixins for rapid adoption of prebuilt observability dashboards. Administrators can also configure various data sources, including Prometheus, Thanos, Loki, and Tempo, through new custom resources.