Within the Red Hat OpenShift ecosystem, Red Hat build of Perses represents a shift in how you manage and use observability data. Integrated as the visualization engine for Red Hat OpenShift observability—shipped by the cluster observability operator—Perses transforms observability from a fragmented collection of isolated tools into a unified, Kubernetes-native experience. By acting as a central architectural hub, the cluster observability operator uses Perses to consolidate the installation, lifecycle management, and visualization of the entire observability stack.
Perses is an open source, cloud-native dashboarding tool integrated directly into Red Hat OpenShift and Red Hat Advanced Cluster Management. Unlike legacy visualization engines, Perses is built from the ground up to treat dashboards as standard Kubernetes resources, aligning perfectly with modern operational workflows. In this guide, we will help architects and site reliability engineers (SREs) navigate the general availability features, implement simplified user flows, and transition from legacy Grafana assets to a more resilient, integrated standard.
Why Perses matters
The shift toward Red Hat build of Perses is driven by the operational necessity of Dashboards as Code. In modern, high-scale environments, you must manage observability assets with the same rigor, versioning, and security focus as the application code they monitor. The Perses open source project helps by natively connecting your signals into the platform, making it easier for engineers to use.
Perses differentiators
Perses stands out from traditional visualization engines through a few distinct features:
- Native Kubernetes integration: Dashboards and data sources are managed as standard Kubernetes custom resources (CRDs). This allows platform teams to manage observability through
ocorkubectl, integrate dashboards into CI/CD pipelines, and apply standard Kubernetes security policies. - Unified signal correlation: Perses provides a single interface to correlate data from multiple backends, including metrics (Prometheus and Thanos), logs (Loki), and traces (Tempo).
- Developer-centric workflow: With the Perses Go SDK, teams can move away from complex, brittle Jsonnet tooling toward type-safe, modular dashboard creation so observability remains maintainable and scalable.
Core capabilities
Red Hat build of Perses provides several core capabilities to help you manage your observability data:
- Multidata source support: View Prometheus, Loki, and Tempo data at the same time.
- RBAC alignment: Direct integration with Kubernetes role-based access control ensures data visibility is tied to your existing cluster identities.
- GitOps-ready: Dashboards exist as YAML resources, allowing for version control, change tracking, and automated rollbacks.
These features provide the architectural foundation you need to build a scalable observability practice.
Streamlining the user flow: Enabling the interface
For cluster administrators, reducing time to value is critical. Red Hat build of Perses integrates directly into the OpenShift web console, so you can activate it with minimal manual configuration.
Prerequisites
Before enabling the interface, make sure your environment meets these version requirements:
- Cluster version: Red Hat OpenShift 4.15 or later.
- Operator version: Cluster observability operator 1.5 or later.
To enable Red Hat build of Perses using the cluster observability operator:
- Install the cluster observability operator: Ensure the cluster observability operator is installed from the OpenShift OperatorHub.
- Configure the plug-in: Create or edit the
UIPlugincustom resource to enable monitoring and Perses components. - Verification: Navigate to Observe → Dashboards (Perses) in the console.
UIPlugin configuration example
The following YAML enables the Perses interface within the cluster:
apiVersion: monitoring.rhobs/v1alpha2
kind: UIPlugin
metadata:
  name: monitoring
spec:
  type: monitoring
  monitoring:
    perses:
      enabled: true
Getting the data layer right
Data source management is essential for balancing multitenant security with broad cluster visibility. Perses uses a hierarchical resolution logic that allows platform teams to provide "sane defaults" through global data sources while allowing application teams to override them with specialized sources, such as a specific Loki instance for PCI-compliant logs. Because this logic eliminates the need to hard code URLs into the dashboard YAML itself, dashboard CRs are intrinsically portable and can be safely deployed across multiple clusters and environments completely unmodified.
Scoping: PersesDatasource vs. PersesGlobalDatasource
You can scope your Perses data sources in two ways depending on your project infrastructure needs.
| Feature | PersesDatasource | PersesGlobalDatasource |
|---|---|---|
| Scope | Namespace-scoped | Cluster-scoped |
| Use case | Project-specific application signals | Shared platform-wide health metrics |
| Access | Restricted to the local namespace | Accessible across the entire cluster |
Data source resolution logic
Perses resolves data sources in a specific order:
- Local scope: It first attempts to find a
PersesDatasourcewithin the dashboard's namespace. - Global scope: If no local source is found, it falls back to the default
PersesGlobalDatasource.
Connecting to platform metrics: The Thanos Querier
To make platform-wide metrics available across all projects, you must create a global Thanos Querier data source. Note: A Perses secret will be created automatically from the service certificate to allow encrypted communication.
apiVersion: perses.dev/v1alpha2
kind: PersesGlobalDatasource
metadata:
  name: thanos-querier-global-datasource
spec:
  config:
    display:
      name: "Thanos Querier Global Datasource"
    default: true
    plugin:
      kind: "PrometheusDatasource"
      spec:
        proxy:
          kind: HTTPProxy
          spec:
            url: https://thanos-querier.openshift-monitoring.svc.cluster.local:9091
            secret: thanos-querier-global-datasource-secret
  client:
    tls:
      enable: true
      caCert:
        type: file
        certPath: /ca/service-ca.crt
Crafting customizable dashboards
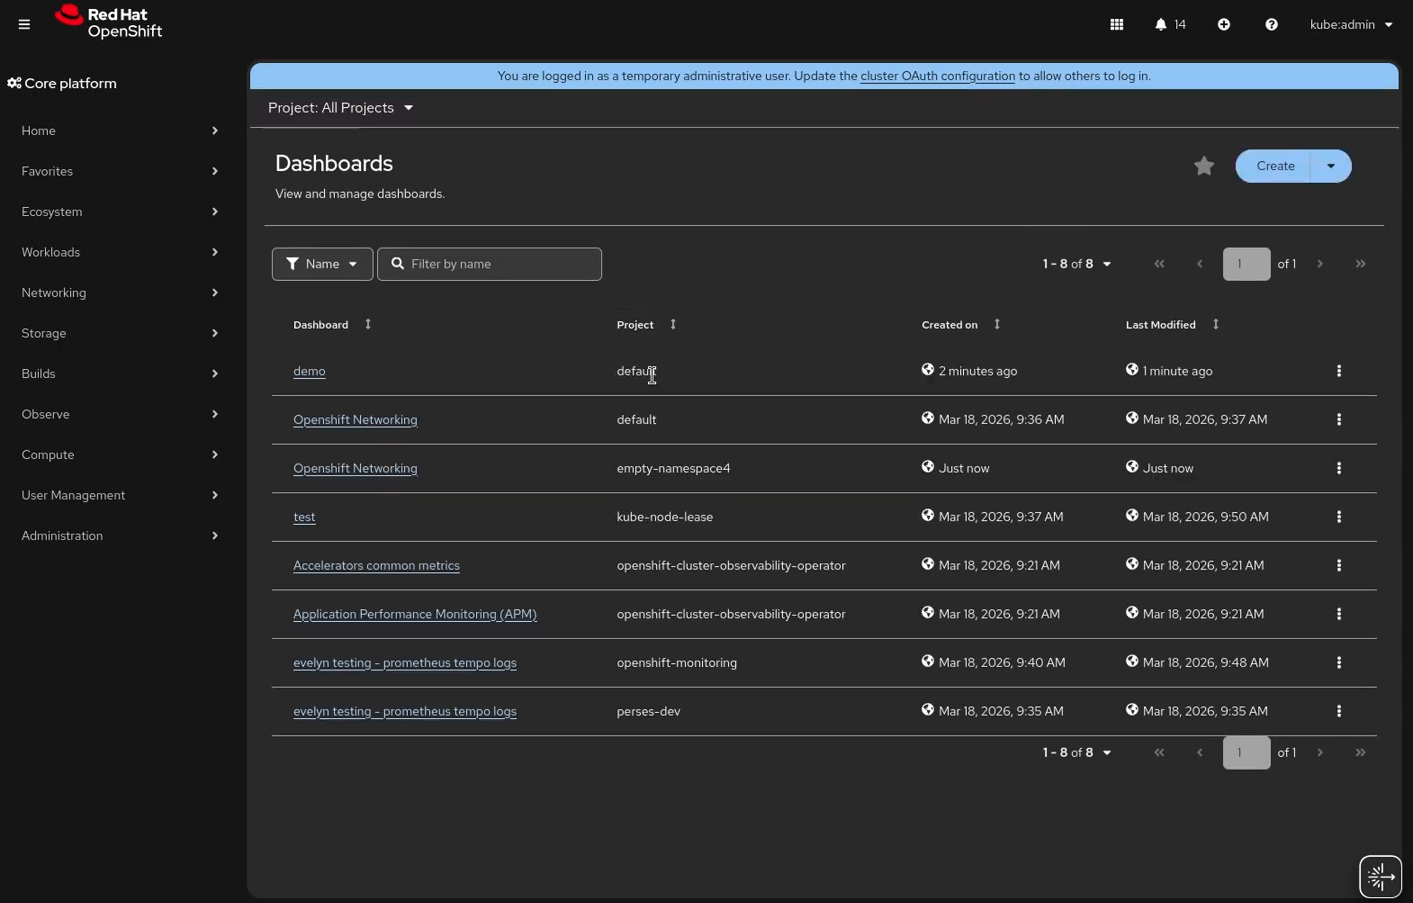
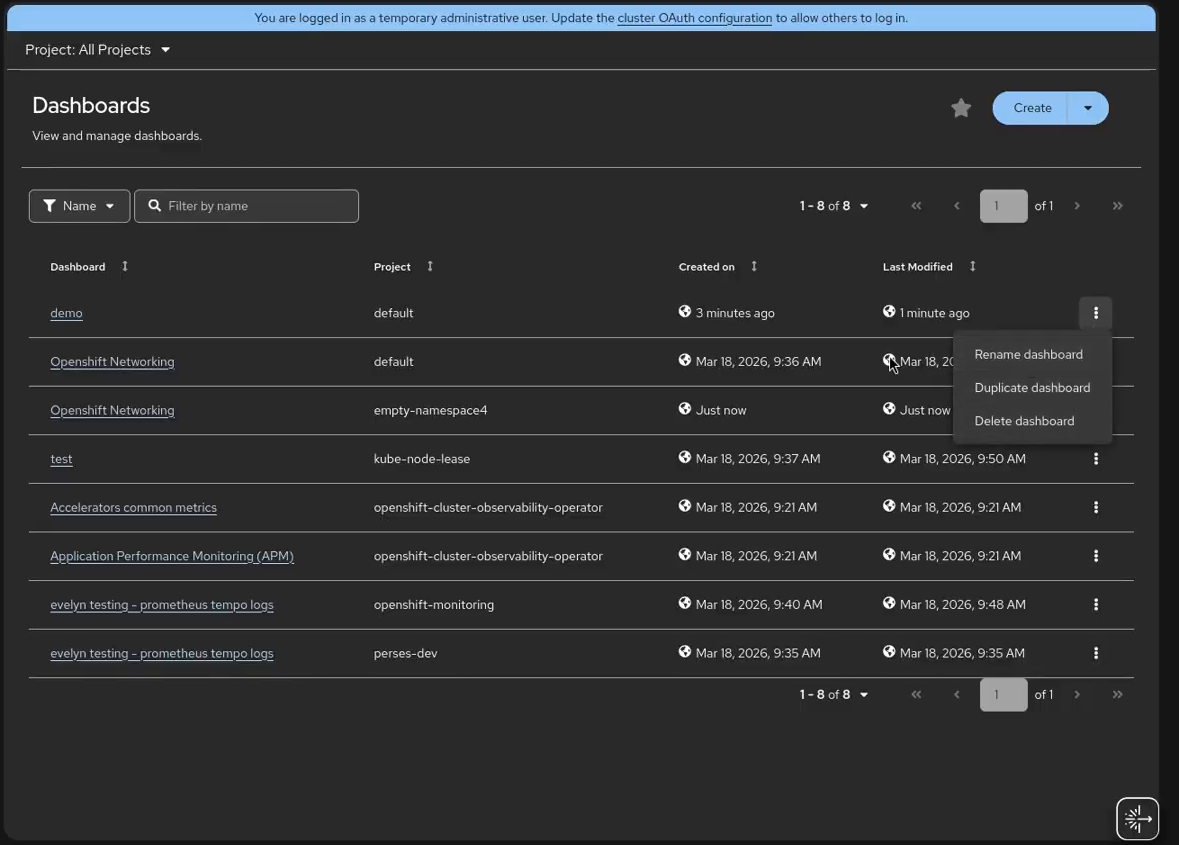
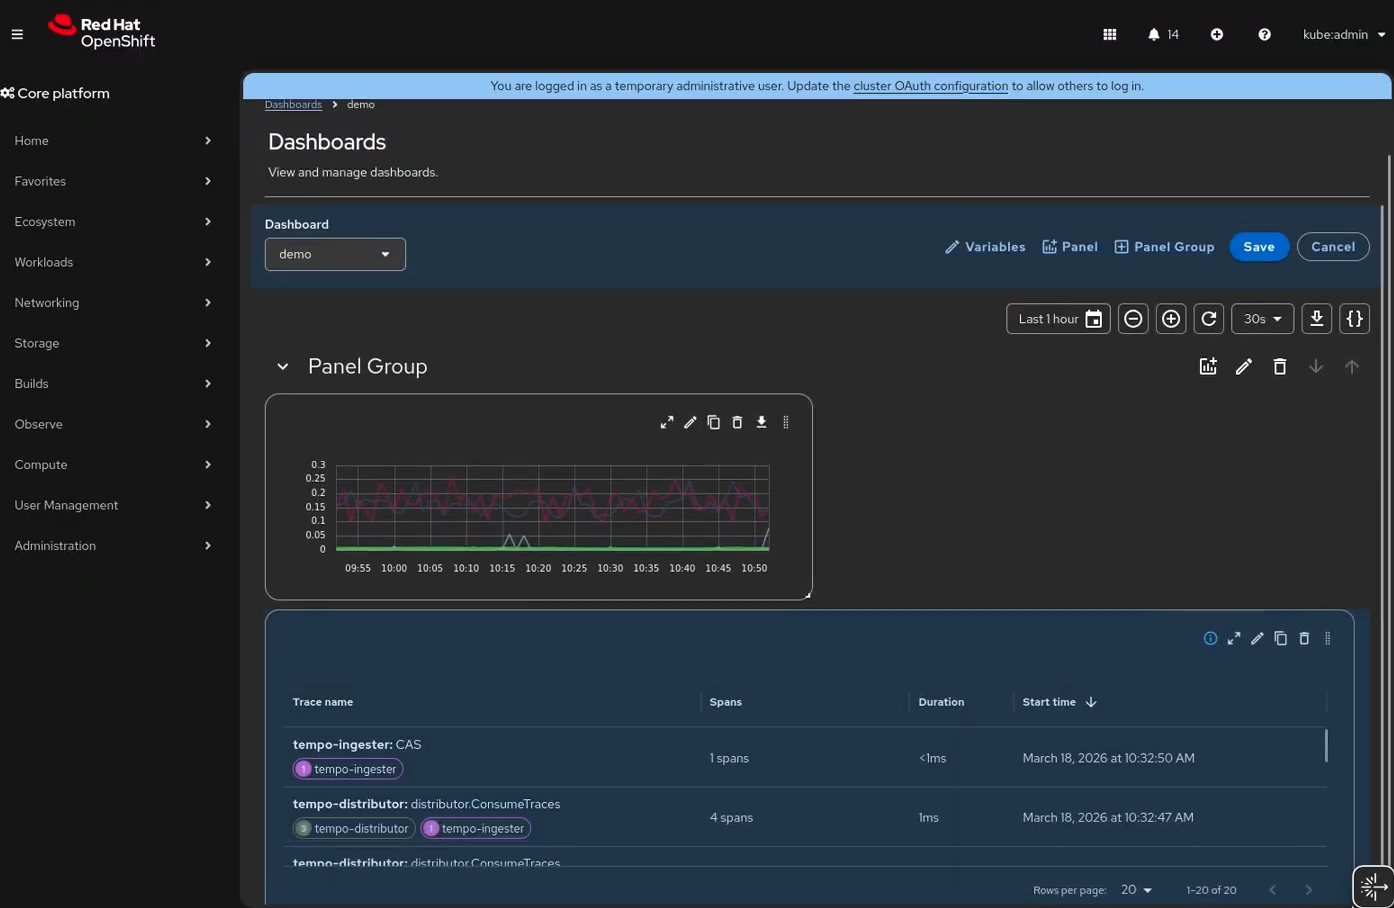
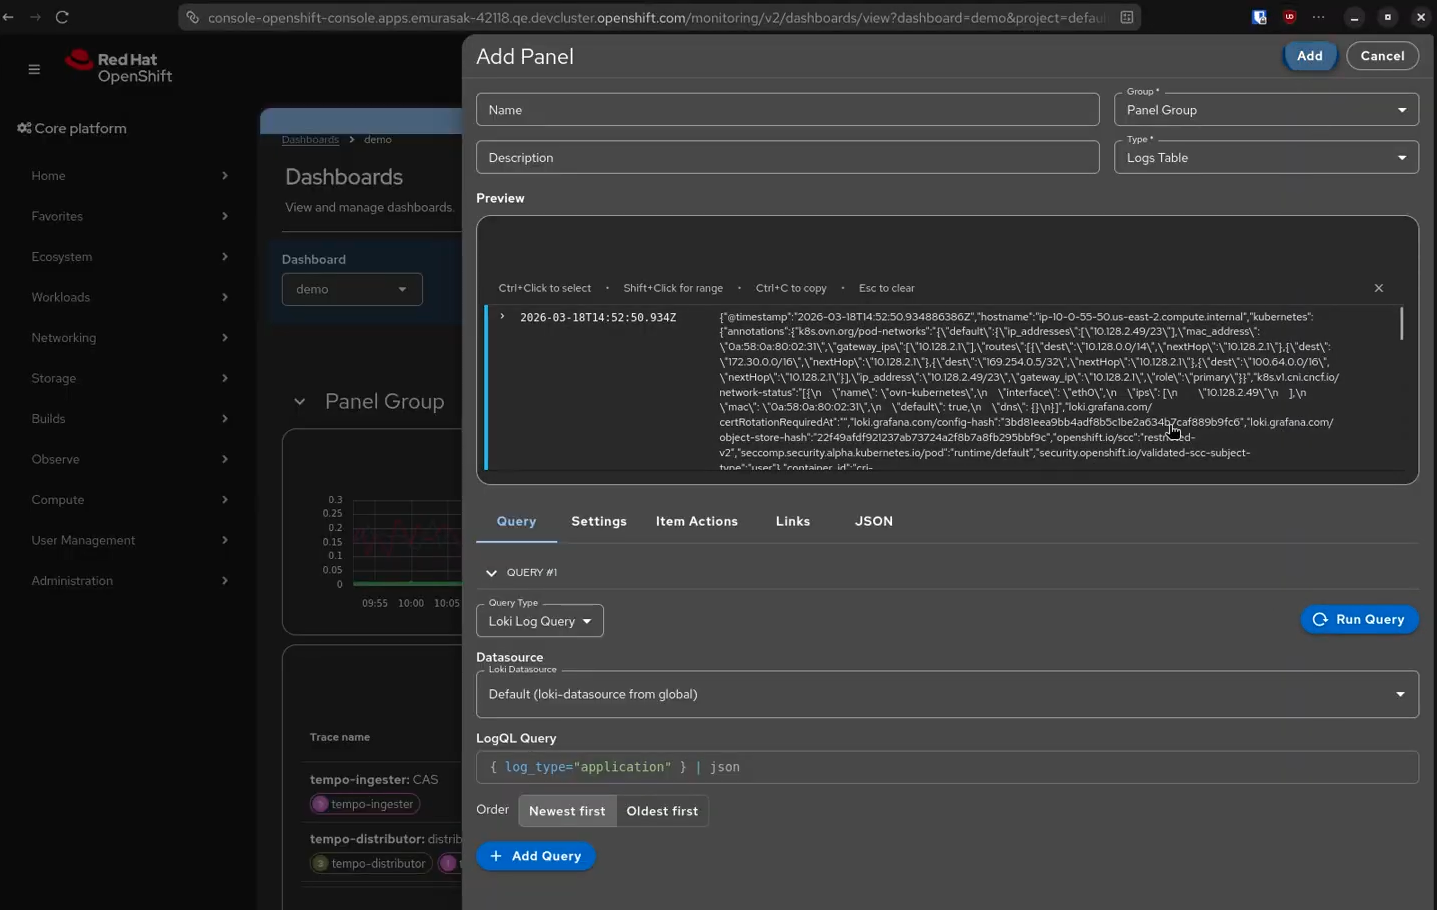
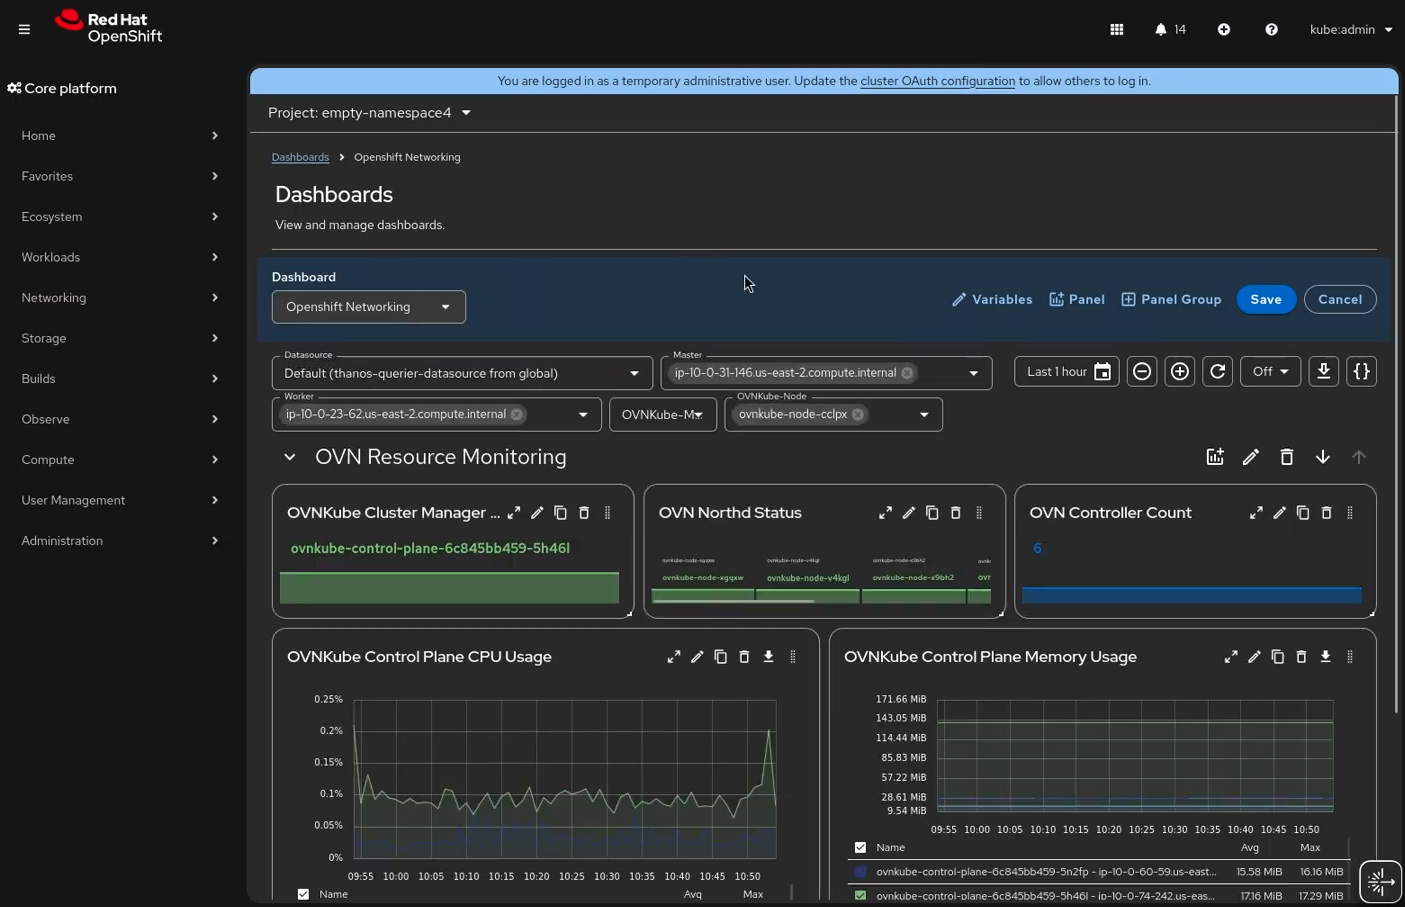
Red Hat build of Perses provides an environment for building visualizations that cater to both deep-dive technical analysis and high-level stakeholder reporting (see Figure 1 through Figure 5).
Methods of dashboard creation
You can build dashboards in two ways depending on your workflow:
- Web console graphical editor: A drag-and-drop interface within the web console allows for the creation, renaming, and duplication of dashboards without manual YAML manipulation.
- Custom resources/YAML: You can define
PersesDashboardresources to enforce Dashboards as Code via GitOps controllers.
Perses supports an expansive list of panel plug-ins to address complex data signals:
- Metrics: Time series, stat, gauge, and bar charts.
- Logging: Logs table for Loki data.
- Distributed tracing: Beyond basic tables, Perses includes Tracing Gantt, ScatterPlot, and Trace Table charts, providing the depth required for analyzing distributed request paths in Tempo.
Migrating your monitoring dashboards from Grafana to Perses
As organizations mature their Kubernetes security posture, migrating from "classic" Grafana models to Perses becomes a priority. This move ensures that the same Kubernetes RBAC governs both your observability assets and your underlying workloads.
Migration workflows:
- UI-based import: You can paste Grafana JSON directly into the Perses import interface. The tool automatically detects the format and converts it into a
PersesDashboardresource. CLI-based migration: Using the
perclicommand-line tool, you can run the following command:percli migrate -f grafana-dashboard.json --online -o yamlThe
--onlineflag is critical because it contacts the Perses server to use the latest plug-in translation logic.
Migration considerations and limitations
As with any migration between tools, there are differences in features as well as how you use the tools themselves.
| Feature | Limitation / action required |
|---|---|
| Custom plug-ins | Unsupported; must be replaced with built-in Perses panels. |
| Alerting | Grafana alerts are not migrated; must be configured through OpenShift Alerting. |
| Variables | Syntax differences might require manual adjustment post-migration. |
| Panel types | Advanced or niche Grafana panels require conversion to supported plug-ins. |
Community mixins
To accelerate adoption, teams should take advantage of community mixins. Think of mixins as handy, pre-made dashboard templates; they let you quickly roll out standard monitoring using Go-based SDKs while keeping the flexibility to tweak specific panels whenever you need a custom touch.
By moving from complex Jsonnet templates to Go-based SDKs, these mixins provide type-safety and composability. This helps SREs deploy prebuilt, modular dashboards for standard workloads like Kubernetes or Node.js while maintaining the ability to override specific panels for custom requirements.
Governance, security, and understanding Perses RBAC
Protecting the data layer is essential, especially in multitenant environments. Perses uses the standard Kubernetes RBAC model to determine whether a user is an auditor, a developer, or an SRE. Red Hat build of Perses ties directly into OpenShift’s authentication and authorization frameworks.
Red Hat OpenShift supports three common access patterns to manage permissions across your cluster.
| Access pattern | Roles and permissions | Mechanism and impact |
|---|---|---|
| Developer | persesdashboard-editor-role and persesdatasource-viewer-role | Assigned through a RoleBinding within a specific project namespace. This configuration allows for self-service dashboarding without altering underlying data sources. |
| SRE | Namespace-level dashboard and data source editor roles | Enforced at the namespace level to allow full management of the observability stack for a specific application suite. |
| Cluster administrator | All Perses roles, including global data sources | Grants total environment oversight across the cluster through a ClusterRoleBinding. |
The future of integrated observability
Red Hat build of Perses represents a major milestone in consolidating the installation, management, and visualization of the OpenShift observability stack. By treating dashboards as first-class Kubernetes citizens, Perses eliminates the friction between infrastructure management and operational insight.
Next steps
Cluster administrators and architects are encouraged to:
- Validate that your environment meets the OpenShift 4.15 or later and cluster observability operator 1.5 or later prerequisites.
- Enable the Perses UI and establish a Global Thanos Querier data source.
- Use
percliwith the--onlineflag to begin porting high-value dashboards to the new Kubernetes-native standard.
By adopting Red Hat build of Perses, organizations establish a security-focused, scalable, and GitOps-aligned observability practice designed for the future of cloud-native operations.
Start exploring
Ready to explore this new feature? Visit the Red Hat observability and Red Hat OpenShift documentation pages to learn more and get started with the latest observability tools in OpenShift. The Red Hat Developer observability page also contains information to help you learn about and implement observability features.
We value your feedback! Share your thoughts and suggestions using the Red Hat OpenShift feedback form.

