As Kubernetes adoption scales, platform teams often hit a painful wall: The exploding cost and complexity of telemetry. When trying to provide isolated service mesh observability for multiple development teams, the default reflex is often "hard tenancy". This provides strict, robust isolation to ensure that a malicious, compromised, or resource-heavy tenant cannot impact others. This means spinning up duplicated, entirely separate instances of Prometheus, Jaeger, and Grafana for every single tenant.
While this brute-force approach achieves strict isolation, the compute overhead, storage costs, and operational nightmare of maintaining dozens of identical telemetry stacks quickly become unsustainable. Platform engineers spend their days managing infrastructure sprawl instead of delivering value, while cloud budgets skyrocket. There is a better way. By leveraging Kiali's (the console for Istio Service Mesh) advanced multi-tenancy capabilities, you can provide developers with the visual, intuitive observability they need to manage their CI/CD pipelines—without bankrupting your cloud budget or burning out your operations team.
The shift: Decoupling and routing with OpenTelemetry
Instead of deploying full, siloed observability stacks (a separate Prometheus and Tempo/Jaeger instance for every team), you can leverage the OpenTelemetry (OTel) Collector as a highly flexible, centralized routing engine. The OpenTelemetry Collector offers a vendor-agnostic implementation of how to receive, process and export telemetry data. The Collector sits between your OpenShift Service Mesh and your backend storage, serving as the single point of ingestion for all metrics, logs, and traces.
How OpenTelemetry enables smart multi-tenancy
To the developer using Kiali, the experience remains seamless. They still get the visual, bullet-proof validation they need to manage their CI/CD pipelines. To the platform engineer, the operational burden is dramatically reduced: You maintain one mesh and one flexible collection layer, giving you total control to route tenant data securely and cost-effectively.
- Centralized collection, decentralized storage: The mesh only needs to export telemetry to one place (the OTel Collector pipeline). From there, the Collector acts as a sophisticated router.
- Context-aware processing: Using OTel Processors, the collector can dynamically inspect the metadata of incoming traces and metrics. If a trace originates from Team A's namespace, the Collector identifies it, tags it, and applies Team A's specific processing rules.
- Flexible exporters: Because collection is decoupled from storage, the Collector can route data based on tenant context. Team A's telemetry can be sent to a lightweight, on-cluster Tempo stack, while Team B's critical production data is exported directly to a premium managed SaaS provider—all from the same shared mesh.
Prerequisites
Before we dive into the configuration, let's establish the baseline environment required to enable this streamlined, multi-tenant observability model. You need an active Red Hat OpenShift cluster with administrative access, alongside the following Operators and namespaces:
- Red Hat OpenShift Service Mesh 3 (namespace:
istio-system) - Kiali provided by Red Hat (namespace:
kiali) - Red Hat build of OpenTelemetry (Collectors in tenant namespaces:
tenanta,tenantb) - Cluster Observability Operator (COO) provided by Red Hat (PrometheusStack in
istio-system) - Loki Operator provided by Red Hat (LokiStack in
openshift-logging, requiring S3 bucket and PVC) - Tempo Operator provided by Red Hat (TempoStack in
tempo, requiring S3 bucket and PVC) - OpenShift Logging / ClusterLogForwarder
Note: Ensure to update all references if you prefer different namespaces for the components. We are not considering Grafana in this setup as it is not supported by Red Hat.
The explicit tenancy approach for Kiali users
Tenant-based Kiali configuration requires a few adaptations to the default configuration:
discovery_selectors: Ensures users are only shown the namespaces they have Kubernetes RBAC permissions to access.instance_name: Makes each Kiali instance act individually.external_services: Configures URI access for Grafana, Prometheus, and Tracing.
Furthermore, we can ensure that each Kiali tenant instance is accessible under a certain FQDN or URI path with the corresponding configuration parameters.
Soft tenancy for development teams
Soft tenancy utilizes the same signal instances but adds authentication or parameter separation for tenancy (illustrated in figure 1). OpenShift Service Mesh provides the Telemetry CR to create fine-grained separation for trace and log tenancy. Service and PodMonitor scrapes can configure additional parameters for tenancy if the namespace is not sufficient.
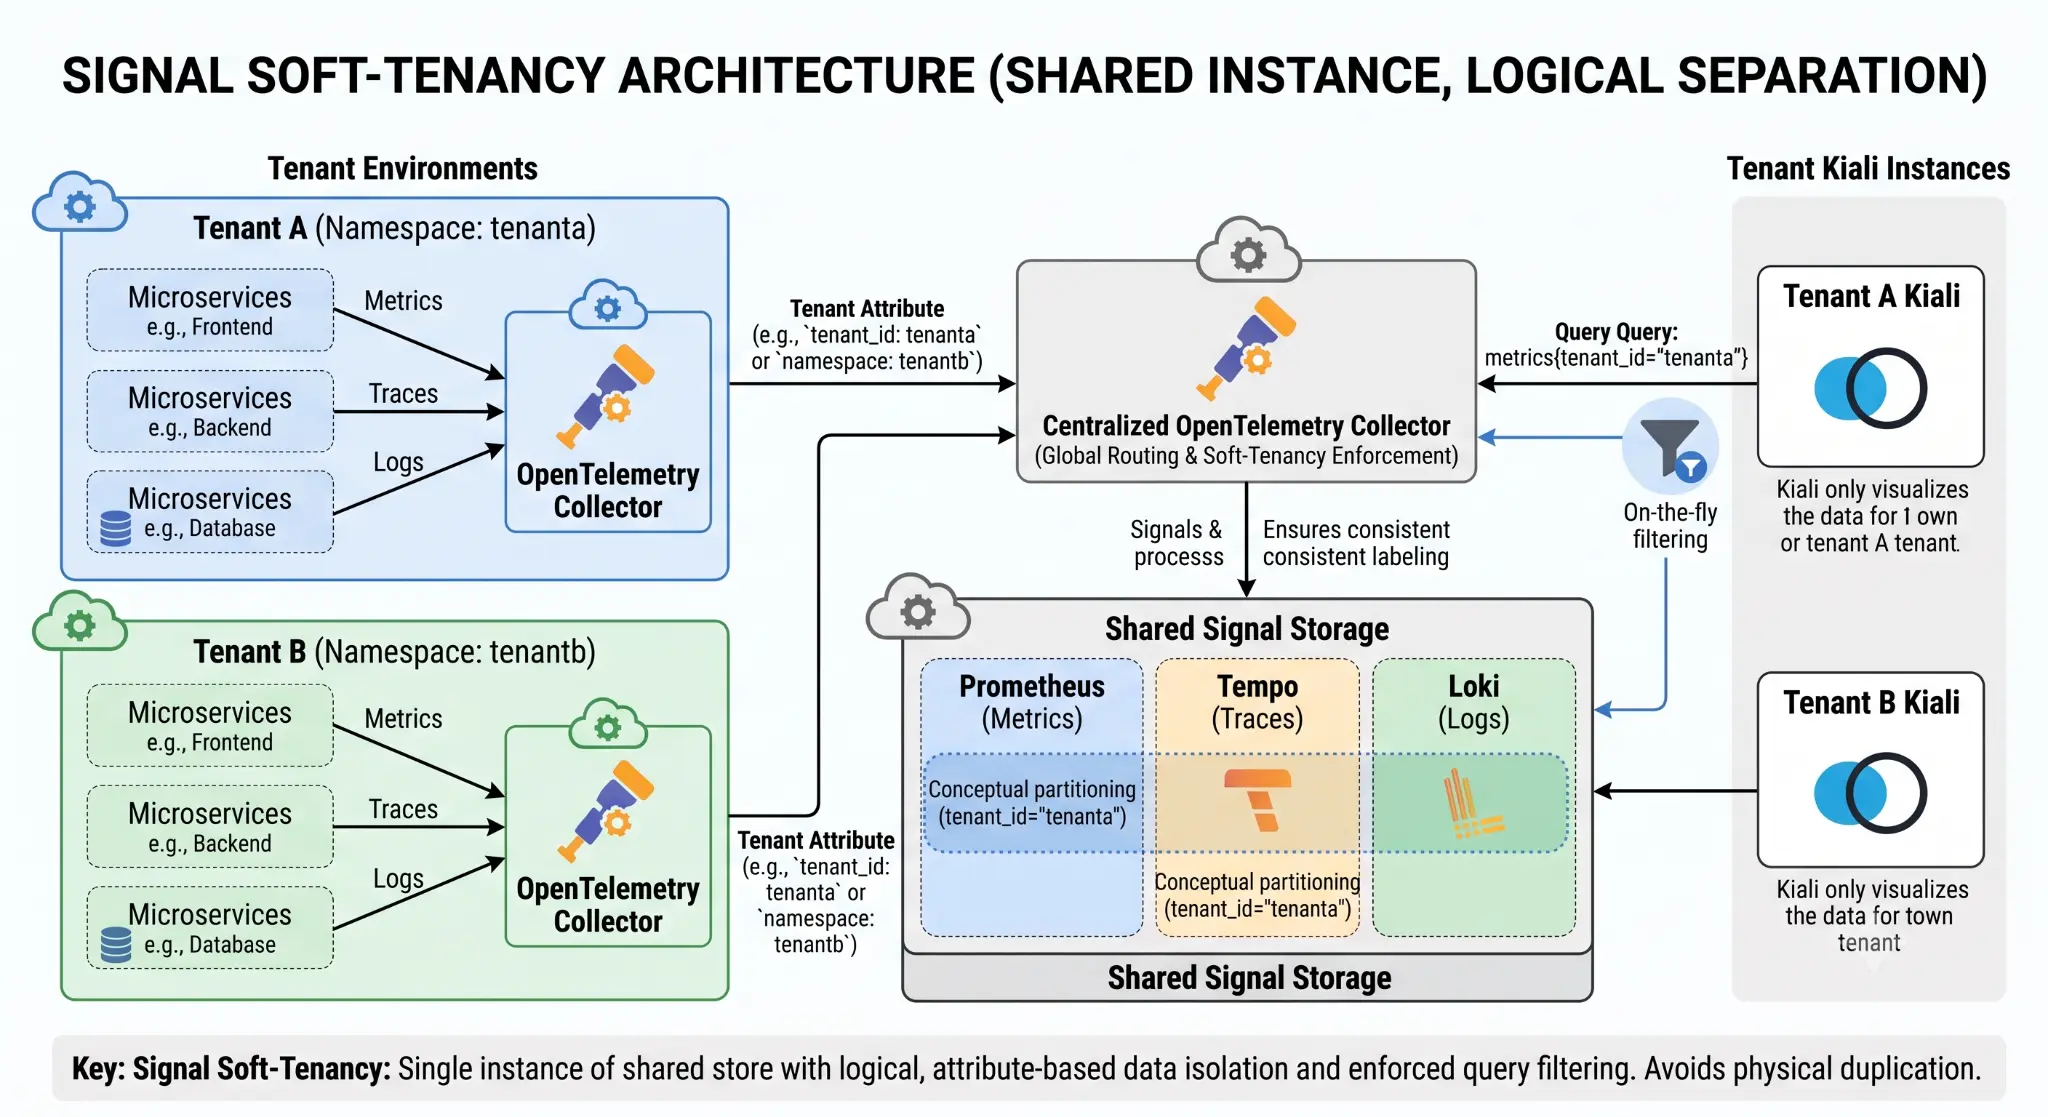
In this example, we're going to configure tenancy based on namespaces, separating tenants for frontend and backend systems.
1. Kiali configuration
Create the first tenant instance of Kiali with the following values:
apiVersion: kiali.io/v1alpha1
kind: Kiali
metadata:
  name: tenanta
  namespace: kiali
spec:
  auth:
    strategy: openshift
  deployment:
    cluster_wide_access: false
    discovery_selectors:
      default:
        - matchExpressions:
            - key: kubernetes.io/metadata.name
              operator: In
              values:
                - tenanta
                - istio-system
  ingress:
    class_name: nginx
    enabled: true
    override_yaml:
      spec:
        host: tenanta-kiali.apps.example.com
        port:
          targetPort: 20001
        tls:
          insecureEdgeTerminationPolicy: Redirect
          termination: reencrypt
        to:
          kind: Service
          name: tenanta
          weight: 100
        wildcardPolicy: None
  instance_name: tenanta
  remote_cluster_resources_only: false
  replicas: 1
  secret_name: tenanta
  view_only_mode: false
  external_services:
    grafana:
      enabled: true
      external_url: https://grafana.apps.example.com
      internal_url: http://grafana.grafana.svc:3000
      is_core: false
    prometheus:
      auth:
        insecure_skip_verify: true
        type: none
        use_kiali_token: false
      cache_duration: 7
      cache_enabled: true
      cache_expiration: 300
      health_check_url: ''
      is_core: true
      thanos_proxy:
        enabled: true
        retention_period: 1d
        scrape_interval: 30s
        url: https://thanos-istio-system.apps.example.com
    tracing:
      auth:
        ca_file: /var/run/secrets/kubernetes.io/serviceaccount/service-ca.crt
        insecure_skip_verify: true
        type: bearer
        use_kiali_token: true
      disable_version_check: false
      enabled: true
      external_url: https://tempo-tempo-gateway-tempo.apps.example/api/traces/v1/tenanta/search
      grpc_port: 9095
      health_check_url: https://tempo-tempo-gateway-tempo.apps.example.com/api/traces/v1/tenanta/tempo/api/echo
      internal_url: https://tempo-tempo-gateway.tempo.svc.cluster.local:8080/api/traces/v1/tenanta/tempo
      is_core: false
      namespace_selector: true
      provider: tempo
      query_timeout: 5
      tempo_config:
        cache_capacity: 200
        cache_enabled: true
        url_format: jaeger
      use_grpc: false
      use_waypoint_name: false
  istio_namespace: istio-system
  server:
    audit_log: true
    cors_allow_all: false
    gzip_enabled: true
    port: 20001
    require_auth: false
    web_fqdn: tenanta-kiali.apps.example.com
    web_history_mode: browser
    web_port: '443'
    web_root: /
    web_schema: https
    write_timeout: 60s
  version: default
2. Istio CR
Add and update the Istio CR to include tenant-specific extensionProviders:
spec:
  values:
    meshConfig:
      extensionProviders:
        - name: tenanta
          opentelemetry:
            port: 4317
            service: tenanta-collector.tenanta.svc.cluster.local
        - name: tenantb
          opentelemetry:
            port: 4317
            service: tenantb-collector.tenantb.svc.cluster.local
Using one OpenTelemetry Collector (OTC) for multiple tenants is a practical use-case to save resources, but decoupling ensures the tenants will not conflict in usage and resource consumption (noisy neighbors).
3. Namespace
Create a namespace-scoped Telemetry CR in the tenant's namespace:
apiVersion: telemetry.istio.io/v1
kind: Telemetry
metadata:
  name: default
spec:
  tracing:
    - providers:
        - name: tenanta
      randomSamplingPercentage: 100
Deploy some workloads and open the Kiali console with your browser.
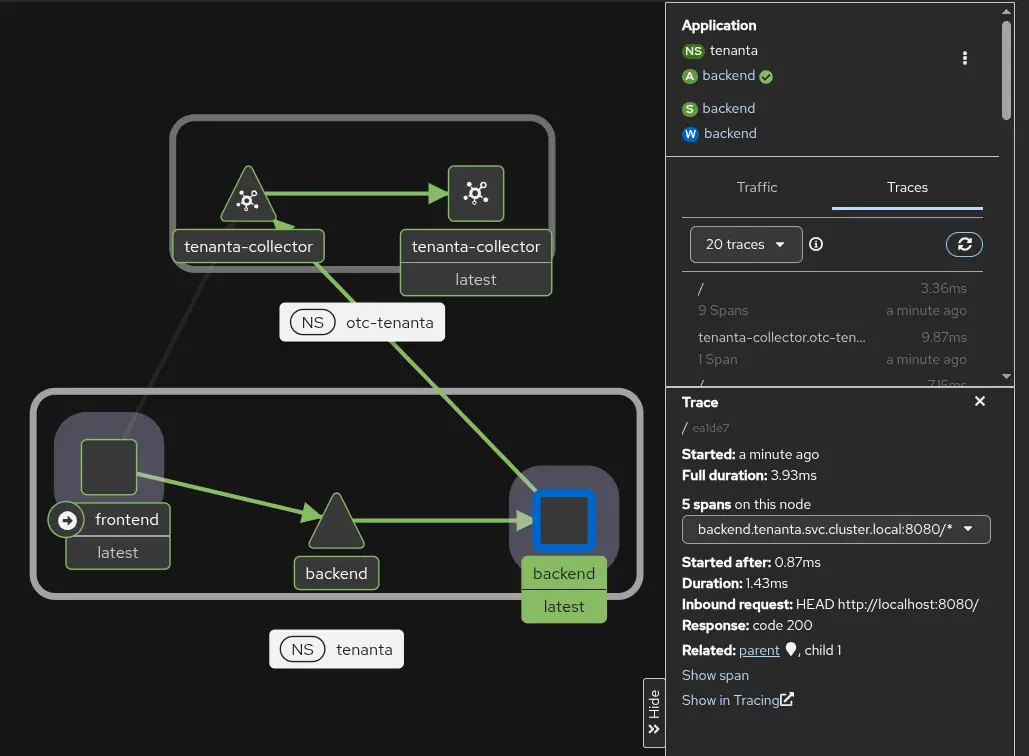
Figure 2 shows the Kiali Traffic Graph relation between services and corresponding traces collected.
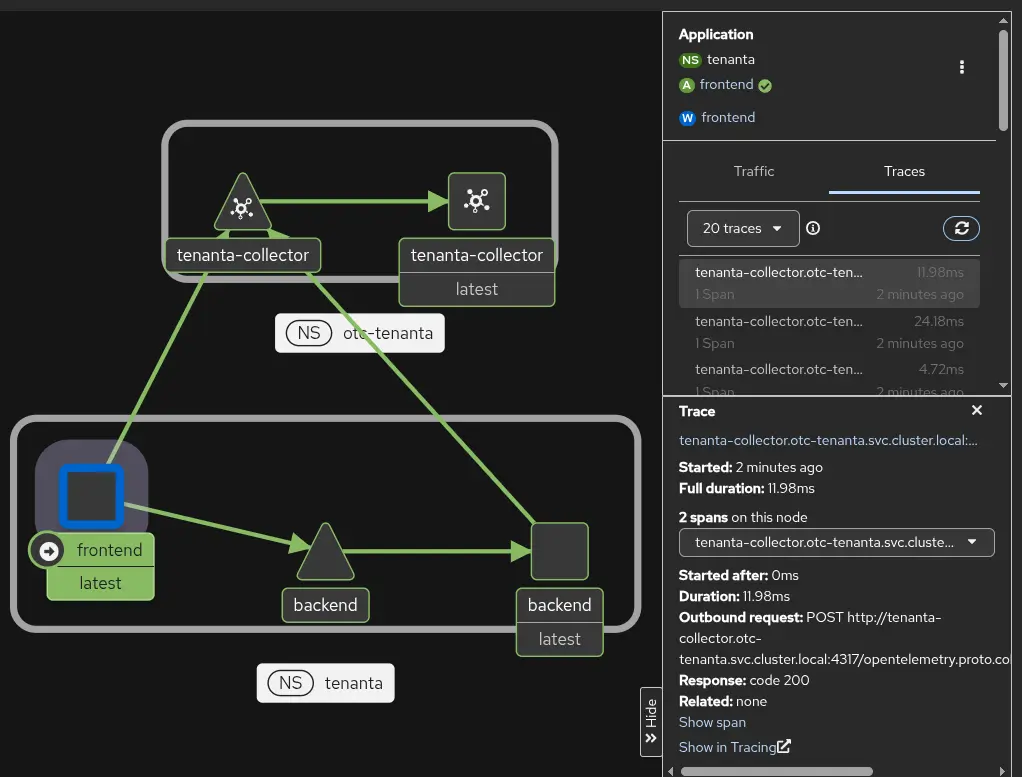
The discovery_selectors in the Kiali CR for the tenant ensures that users only see those namespaces, metrics, logs, and traces that are configured and that Kubernetes RBAC grants them namespace access to.
Figure 3 demonstrates the isolation based on Kubernetes RBAC definitions in Kiali.
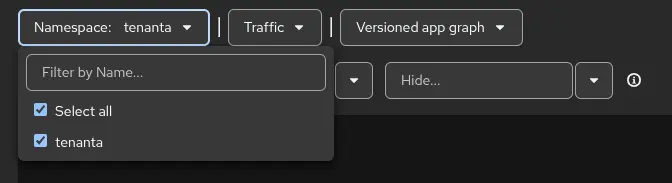
Even though the Kiali instance discovery_selectors show istio-system as included as well, if the user has no Kubernetes RBAC permission to access the namespace, it is not be listed.
Hard tenancy: Dedicated back-end stores
Assuming resource consumption on a per-team basis is the preferred way for your use-case, the configurations differ slightly to exchange storage/collector endpoints instead of adding attributes for separation. Figure 4 illustrates the architecture.
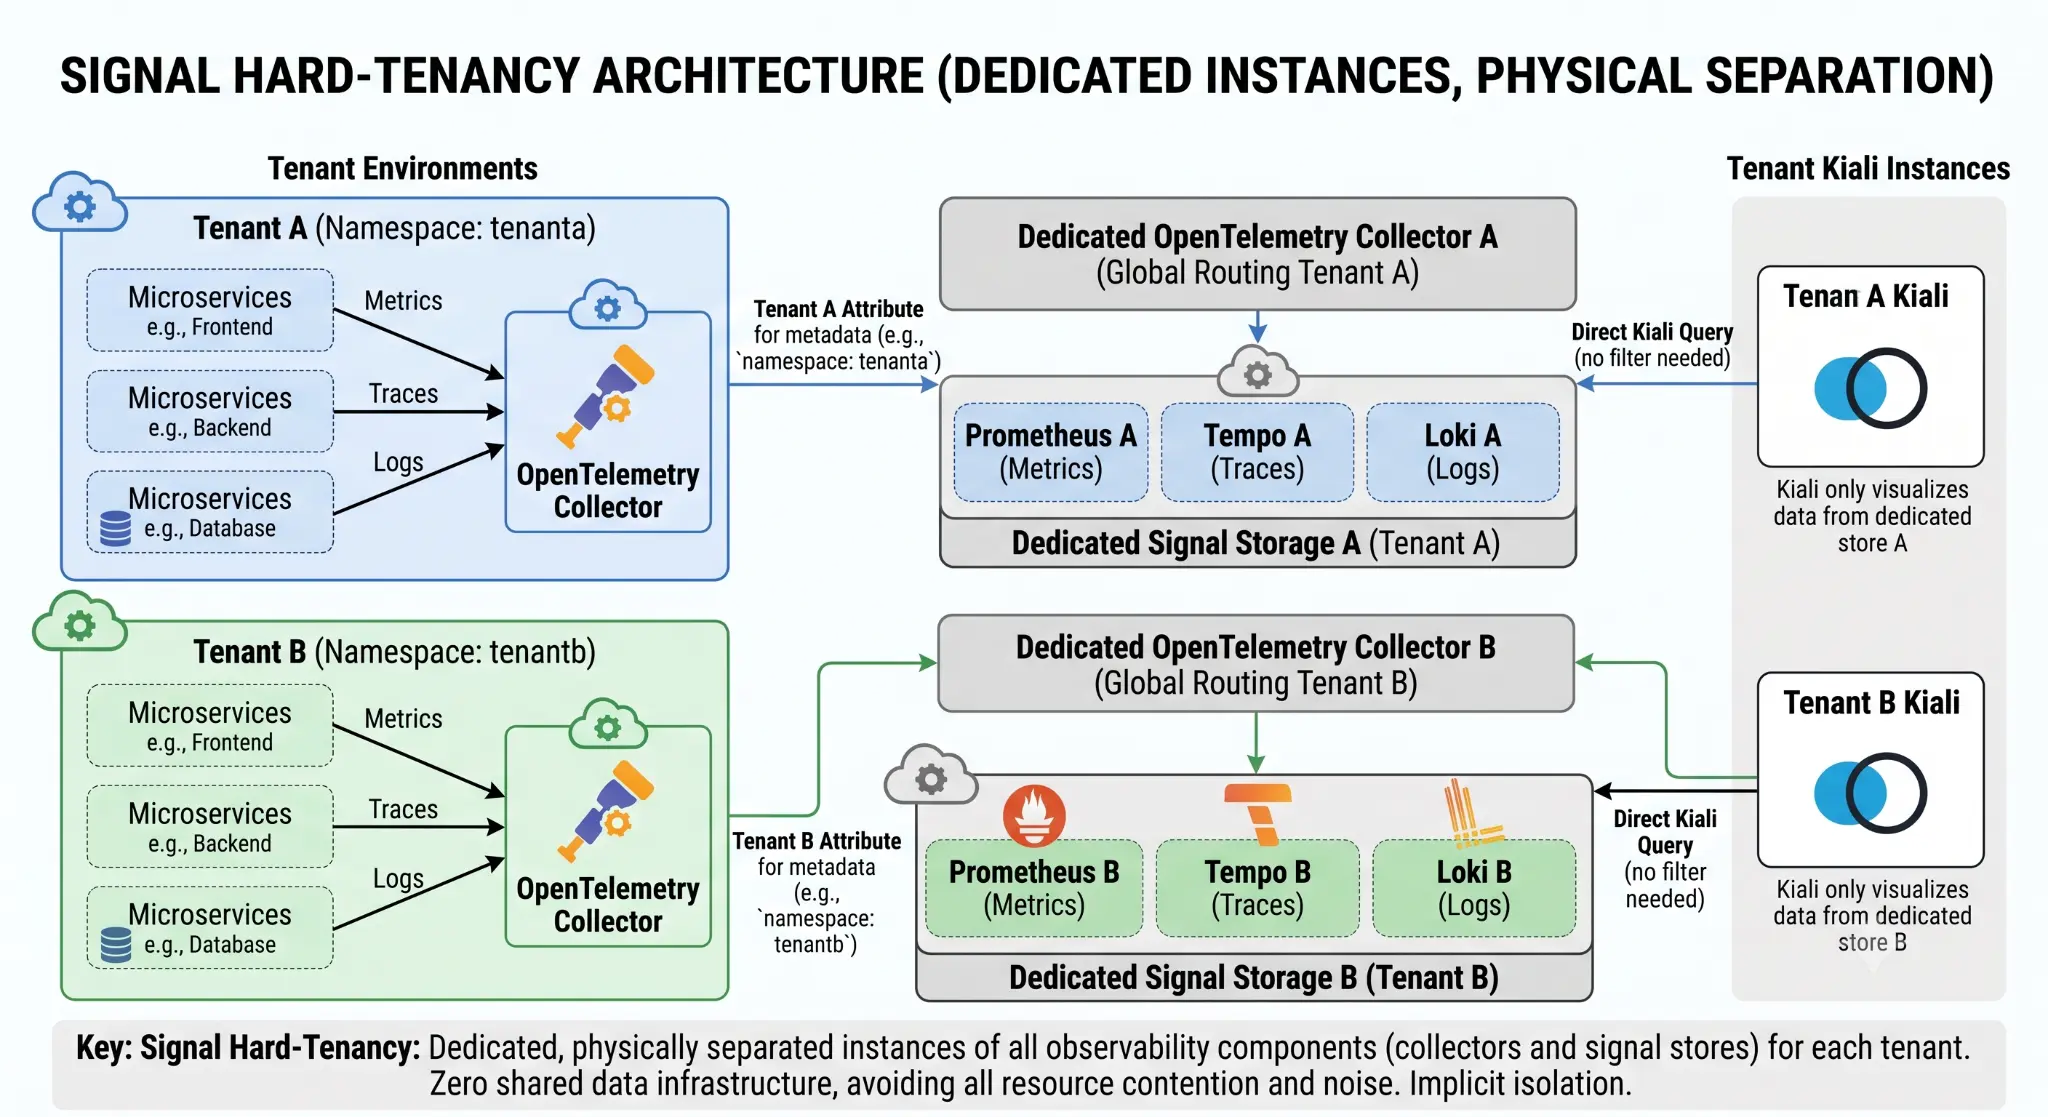
OpenShift Service Mesh extensionProviders handles the endpoint changes with ease, and we can configure up to 1024 extension providers for tenancy. Here, we configure tenancy based on namespaces but with entirely different backend signal stores (Grafana, PrometheusStack, and TempoStack all in namespace tenant-a).
1. Kiali configuration
Create the Kiali instance with dedicated back-end URIs:
apiVersion: kiali.io/v1alpha1
kind: Kiali
metadata:
  name: tenanta
  namespace: kiali
spec:
  auth:
    strategy: openshift
  deployment:
    cluster_wide_access: false
    discovery_selectors:
      default:
        - matchExpressions:
            - key: kubernetes.io/metadata.name
              operator: In
              values:
                - tenanta
                - istio-system-a
  ingress:
    class_name: nginx
    enabled: true
    override_yaml:
      spec:
        host: tenanta-kiali.apps.example.com
        port:
          targetPort: 20001
        tls:
          insecureEdgeTerminationPolicy: Redirect
          termination: reencrypt
        to:
          kind: Service
          name: tenanta
          weight: 100
        wildcardPolicy: None
  instance_name: tenanta
  remote_cluster_resources_only: false
  replicas: 1
  secret_name: tenanta
  view_only_mode: false
  external_services:
    grafana:
      enabled: true
      external_url: https://grafana-tenanta.apps.example.com
      internal_url: http://grafana-tenanta.grafana-a.svc:3000
      is_core: false
    prometheus:
      auth:
        insecure_skip_verify: true
        type: none
        use_kiali_token: false
      cache_duration: 7
      cache_enabled: true
      cache_expiration: 300
      health_check_url: ''
      is_core: true
      thanos_proxy:
        enabled: true
        retention_period: 1d
        scrape_interval: 30s
        url: https://thanos-tenanta.apps.example.com
    tracing:
      auth:
        ca_file: /var/run/secrets/kubernetes.io/serviceaccount/service-ca.crt
        insecure_skip_verify: true
        type: bearer
        use_kiali_token: true
      disable_version_check: false
      enabled: true
      external_url: https://tempo-tempo-a-gateway-tenanta.apps.example/api/traces/v1/tenanta/search
      grpc_port: 9095
      health_check_url: https://tempo-tempo-a-gateway-tenanta.apps.example.com/api/traces/v1/tenanta/tempo/api/echo
      internal_url: https://tempo-tempo-a-gateway.tempo-a.svc.cluster.local:8080/api/traces/v1/tenanta/tempo
      is_core: false
      namespace_selector: true
      provider: tempo
      query_timeout: 5
      tempo_config:
        cache_capacity: 200
        cache_enabled: true
        url_format: jaeger
      use_grpc: false
      use_waypoint_name: false
  istio_namespace: istio-system-a
  server:
    audit_log: true
    cors_allow_all: false
    gzip_enabled: true
    port: 20001
    require_auth: false
    web_fqdn: tenanta-kiali.apps.example.com
    web_history_mode: browser
    web_port: '443'
    web_root: /
    web_schema: https
    write_timeout: 60s
  version: default
Figures 5 shows the effectiveness of Discovery Selectors limiting the view of tenants in Kiali.
2. Enforce access with Kubernetes RBAC
Ensure you have the corresponding Kubernetes RBAC in place. First, a ClusterRole for reading the tenant traces:
apiVersion: rbac.authorization.k8s.io/v1
kind: ClusterRole
metadata:
  name: traces-reader-tenanta
rules:
  - apiGroups:
      - tempo.grafana.com
    resourceNames:
      - traces
    resources:
      - tenantA
    verbs:
      - get
Next, the corresponding ClusterRoleBinding for the Kiali instance, which grants access to the User/Group as well as the Kiali ServiceAccount:
apiVersion: rbac.authorization.k8s.io/v1
kind: ClusterRoleBinding
metadata:
  name: tenanta-traces-reader
roleRef:
  apiGroup: rbac.authorization.k8s.io
  kind: ClusterRole
  name: traces-reader-tenanta
subjects:
  - apiGroup: rbac.authorization.k8s.io
    kind: User
    name: user1
  - apiGroup: rbac.authorization.k8s.io
    kind: Group
    name: tenanta
  - kind: ServiceAccount
    name: tenanta-service-account
    namespace: kiali
There is no difference visible in the Kiali UI between soft and hard tenancy, meaning users do not need to change their workflows when backend stores change. You can continue adding more tenants by simply adjusting the tenancy classification in new Kiali instances accordingly.
Conclusion
The shift to a smart, decoupled telemetry architecture using OpenTelemetry and Kiali is a game-changer for platform engineering. By consolidating your collection layer and utilizing Kiali's robust RBAC and namespace filtering, you give your development teams the visual clarity they crave without the crushing overhead of duplicated infrastructure. Ultimately, Kiali multi-tenancy isn't just a cleaner architecture, it empowers developers to confidently own and adapt their configurations while keeping your cloud costs and operational burden strictly in check.

