This article covers benchmarking with the Red Hat Data Grid operator and Helm charts. The container-awareness concept is the foundation here, as the Data Grid heap size is 50% of the container size. This article complements JVM tuning for Red Hat Data Grid on Red Hat OpenShift 4.
Hyperfoil is an open source community project that provides a microservice-oriented, distributed benchmarking framework. It is a benchmarking tool based on loading and focus, as explained in Beginner's Guide to Hyperfoil part 1:
- Simplicity: Offering a "do it right away" approach.
- Distributed performance: Emulating complex load.
- Complex logic: Allowing you to achieve complex configurations through YAML files and agent settings.
- Open source: Providing a fully open source framework.
You can learn more about the tool in the Hyperfoil beginner guides: 1, 2, and 3.
In Red Hat OpenShift 4, you can install Hyperfoil using the Hyperfoil operator to create a Hyperfoil custom resource (CR). This operator-only CR contains all the benchmarking details, including the number of agents (executors) and phases (the benchmark processes).
Benchmarking
Although I have discussed benchmarking several times on the Red Hat Developer blog, I have never detailed the benchmarking process itself. This article explains how the process works. A benchmark test typically addresses three distinct performance aspects:
- Footprint: The amount of memory an application uses.
- Latency: The time it takes for a system to respond to a request.
- Throughput: The volume of data processed within a specific period.
Benchmarking is a continuous process rather than a final goal. Different workloads, environments, and parameters alter your results. You can adjust these variables using Java Virtual Machine (JVM) arguments, as described in JVM tuning for Red Hat Data Grid on Red Hat OpenShift 4.
Consequently, when your benchmark tests show that your Red Hat Data Grid deployment has reached a desired level of performance, you cannot expect those results to be static. This article builds upon the strategies in the Benchmarking Data Grid on OpenShift guide.
Red Hat Data Grid
Red Hat recommends using Hyperfoil to measure performance for Red Hat Data Grid clusters running on Red Hat OpenShift.
After you create and deploy Red Hat Data Grid, the next step is to benchmark your deployment. Benchmarking does more than just measure performance; it also helps you manage your cluster and tune your system after resolving an issue
Demo
To begin, install and deploy the Red Hat Data Grid Infinispan CR and a cache:
 spec:
  security:
    endpointAuthentication: true
    endpointEncryption:
      type: None
    endpointSecretName: example-infinispan-generated-secret
  container:
    memory: 1Gi
  expose:
    type: Route
  configListener:
    enabled: true
    logging:
      level: info
  upgrades:
    type: Shutdown
  version: 8.5.0-2
  replicas: 1
Next, install the Hyperfoil operator and create the Hyperfoil Controller CR. The following example shows the default Hyperfoil Controller CR without annotations:
###
### Hyperfoil Subscription
###
$ oc get sub hyperfoil-bundle -n openshift-operators -o yaml
apiVersion: operators.coreos.com/v1alpha1
kind: Subscription
metadata:
  labels:
    operators.coreos.com/hyperfoil-bundle.openshift-operators: ""
  name: hyperfoil-bundle
  namespace: openshift-operators
spec:
  channel: alpha
  installPlanApproval: Manual
  name: hyperfoil-bundle
  source: community-operators
  sourceNamespace: openshift-marketplace
  startingCSV: hyperfoil-operator.v0.26.0
###
### Hyperfoil Custom Resource
###
apiVersion: hyperfoil.io/v1alpha2
kind: Hyperfoil
metadata:
  name: hyperfoil
spec:
  version: latest
When you install the operator, the system deploys a controller manager pod named hyperfoil-operator-controller-manager. Creating the Hyperfoil CR initiates the following resources:
- A controller pod: The operator creates a pod named
hyperfoil-sample-controller. - Two services: The operator provisions the
hyperfoilandhyperfoil-clusterservices. - A route: The operator configures a Red Hat OpenShift route that binds the
hyperfoilservice. - Agents: When the benchmark runs, Hyperfoil launches each agent in its own pod. The Hyperfoil custom resource communicates with Red Hat Data Grid using the route URI rather than Kubernetes components, meaning the resources do not need to share a namespace or reside on the same OpenShift 4 cluster.
Run the following command to retrieve the Red Hat OpenShift route and access the controller in a web browser:
$ oc get route
NAME        HOST/PORT                                                               PATH   SERVICES    PORT    TERMINATION     WILDCARD
hyperfoil   hyperfoil-default.apps.rosa.example.com          hyperfoil   <all>   edge/Redirect   None
Now, let's create a Hyperfoil benchmark configuration file:
name: hotrod-benchmark-demo
hotrod:
 # Replace <USERNAME>:<PASSWORD> with your Data Grid credentials.
 # Replace <SERVICE_HOSTNAME>:<PORT> with the host name and port for Data Grid.
 - uri: hotrod://developer:passcode@infinispan-cr.namespace-operators.svc.cluster.local
   caches:
    # Replace <CACHE-NAME> with the name of your Data Grid cache.
    - mycache
agents:
  agent-1:
  agent-2:
  agent-3:
  agent-4:
  agent-5:
phases:
- rampupPut:
    increasingRate:
      duration: 10s
      initialUsersPerSec: 100
      targetUsersPerSec: 200
      maxSessions: 300
      scenario: &put
      - putData:
        - randomInt: cacheKey <- 1 .. 40000
        - randomUUID: cacheValue
        - hotrodRequest:
            # Replace <CACHE-NAME> with the name of your Data Grid cache.
            put: mycache
            key: key-${cacheKey}
            value: value-${cacheValue}
- rampupGet:
    increasingRate:
      duration: 10s
      initialUsersPerSec: 100
      targetUsersPerSec: 200
      maxSessions: 300
      scenario: &get
      - getData:
        - randomInt: cacheKey <- 1 .. 40000
        - randomUUID: cacheValue
        - hotrodRequest:
            # Replace <CACHE-NAME> with the name of your Data Grid cache.
            put: mycache
            key: key-${cacheKey}
            value: value-${cacheValue}
- doPut:
    constantRate:
      startAfter: rampupPut
      duration: 5m
      usersPerSec: 10000
      maxSessions: 11000
      scenario: *put
- doGet:
    constantRate:
      startAfter: rampupGet
      duration: 5m
      usersPerSec: 40000
      maxSessions: 41000
      scenario: *get
Let's break down the benchmark configuration:
- Scenarios: The benchmark custom resource defines scenarios like
scenario: &put,scenario: *put,scenario: &get, andscenario: *get. - Target URI: The benchmark executes requests against the endpoint
hotrod://developer:something@example-infinispan.openshift-operators.svc.cluster.local. - Agents: The configuration creates five single-threaded agents. Because each agent runs in its own pod, the benchmark deploys five pods in total.
- Phases: The benchmark runs in four distinct phases. By default, Hyperfoil phases act as independent workloads.
- Forks: This configuration does not include forks.
Credentials: You can retrieve the user credentials from the generated secret,
example-infinispan-generated-secret:$ oc get secret example-infinispan-generated-secret -o jsonpath="{.data.identities\.yaml}" | base64 --decode credentials: - username: developer password: something roles: - admin - controlRole
Accessing the route in a web browser displays the main page shown in Figure 1.

After you start Hyperfoil, upload the benchmark file and run the following command:
$ run hotrod-benchmark-demo
...
Agents: agent-1[READY], agent-2[READY], agent-3[READY], agent-4[READY], agent-5[READY]
The agent status changes from STARTING to REGISTERED, READY, and finally STOPPED.
Useful tips and common mistakes
When configuring and running your benchmark tests, keep these troubleshooting strategies and command tips in mind to resolve common errors quickly.
Encryption timeouts
If you do not disable encryption, the console displays a connection closed error:
ISPN004071: Connection to example-infinispan.openshift-operators.svc.cluster.local/172.30.201.68:11222 was closed while waiting for response.Missing cache configurations
If you do not create the cache custom resource, the console displays a cache error:
agent-id: Cache 'notthere-cache' is not a defined cache.CPU resource saturation
If you do not allocate sufficient CPU resources to your pods, the agent logs warn you of saturation:
agent-4: 23:08:36.591 | CPU 3 was used for 97% which is more than the threshold of 80%.Agent JVM diagnostics
Because the agent is a Java Virtual Machine (JVM) process named io.hyperfoil.Hyperfoil$Agent, you can diagnose its state using VM.info.
CLI command help
The built-in help utility provides immediate guidance on available command-line interface (CLI) options:
hyperfoil]$
help
Hyperfoil CLI, version 0.26
Available commands:
COMMAND      DESCRIPTION
compare      Compare results from two runs
connections  Shows number and type of connections.
cpu          Show agent CPU usage
edit         Edit benchmark definition.
export       Export run statistics.
forget       Removes benchmark from controller.
help         Provides help for other CLI commands.
info         Provides information about the benchmark.
inspect      Show detailed structure of the benchmark.
kill         Terminate run.
load         Registers a benchmark definition from a local path on the Hyperfoil Controller server
log          Browse remote logs.
new          Creates a new benchmark
plot         Display chart for metric/connections/sessions
report       Generate HTML report
run          Starts benchmark on Hyperfoil Controller server
runs         Print info about past runs.
sessions     Show sessions statistics
shutdown     Terminate the controller
stats        Show run statistics
status       Prints information about executing or completed run.
upload       Uploads benchmark definition to Hyperfoil Controller server
version      Provides server/client information.
wrk          Runs a workload simulation against one endpoint using the same vm
wrk2         Runs a workload simulation against one endpoint using the same vm
Results and interpretation
Evaluating your benchmark results helps you identify performance limits. The following output displays typical statistics from a test run:
[hyperfoil]$
stats
Total stats from run 0006
PHASE      METRIC   THROUGHPUT    REQUESTS  MEAN      p50        p90        p99       p99.9
                    p99.99        TIMEOUTS  ERRORS    BLOCKED
-------------------------------------------------------------------------------------------------
rampupGet  getData  140.44 req/s      1435   1.93 ms  577.54 μs  966.66 μs   5.67 ms  371.20 ms
                       373.29 ms         0         0       0 ns
-------------------------------------------------------------------------------------------------
rampupPut  putData  142.72 req/s      1458   1.97 ms  577.54 μs    1.03 ms   5.57 ms  379.58 ms
                       394.26 ms         0         0       0 ns
-------------------------------------------------------------------------------------------------
doPut      putData   10.35 req/s     12891  54.11 s    60.13 s    60.13 s   60.13 s    60.13 s
                        60.13 s          0         0       0 ns
-------------------------------------------------------------------------------------------------
doGet      getData   50.60 req/s     63052  46.64 s    60.13 s    60.13 s   60.13 s    60.13 s
                        60.13 s          0         0       0 ns
-------------------------------------------------------------------------------------------------
doPut/putData: Exceeded session limit
doPut/putData: Exceeded session limit
doPut/putData: Exceeded session limit
doPut/putData: Exceeded session limit
You can compare these metrics against a scaled deployment. The following statistics show performance with two Red Hat Data Grid pods:
Total stats from run 0008
PHASE      METRIC   THROUGHPUT    REQUESTS  MEAN      p50       p90       p99       p99.9
                    p99.99        TIMEOUTS  ERRORS    BLOCKED
-------------------------------------------------------------------------------------------------
rampupGet  getData  142.83 req/s      1475  52.63 ms   1.10 ms  10.16 ms   2.11 s    2.30 s
                         2.84 s          0         0      0 ns
-------------------------------------------------------------------------------------------------
rampupPut  putData  152.08 req/s      1569  72.72 ms   1.07 ms   8.72 ms   2.14 s    2.23 s
                         2.25 s          0         0      0 ns
-------------------------------------------------------------------------------------------------
doPut      putData   16.03 req/s     18470  40.06 s   60.13 s   60.13 s   60.13 s   60.13 s
                        60.13 s          0         0      0 ns
-------------------------------------------------------------------------------------------------
doGet      getData   59.54 req/s     71091  38.05 s   60.13 s   60.13 s   60.13 s   60.13 s
                        60.13 s          0         0      0 ns
-------------------------------------------------------------------------------------------------
doPut/putData: Exceeded session limit
doPut/putData: Exceeded session limit
doPut/putData: Exceeded session limit
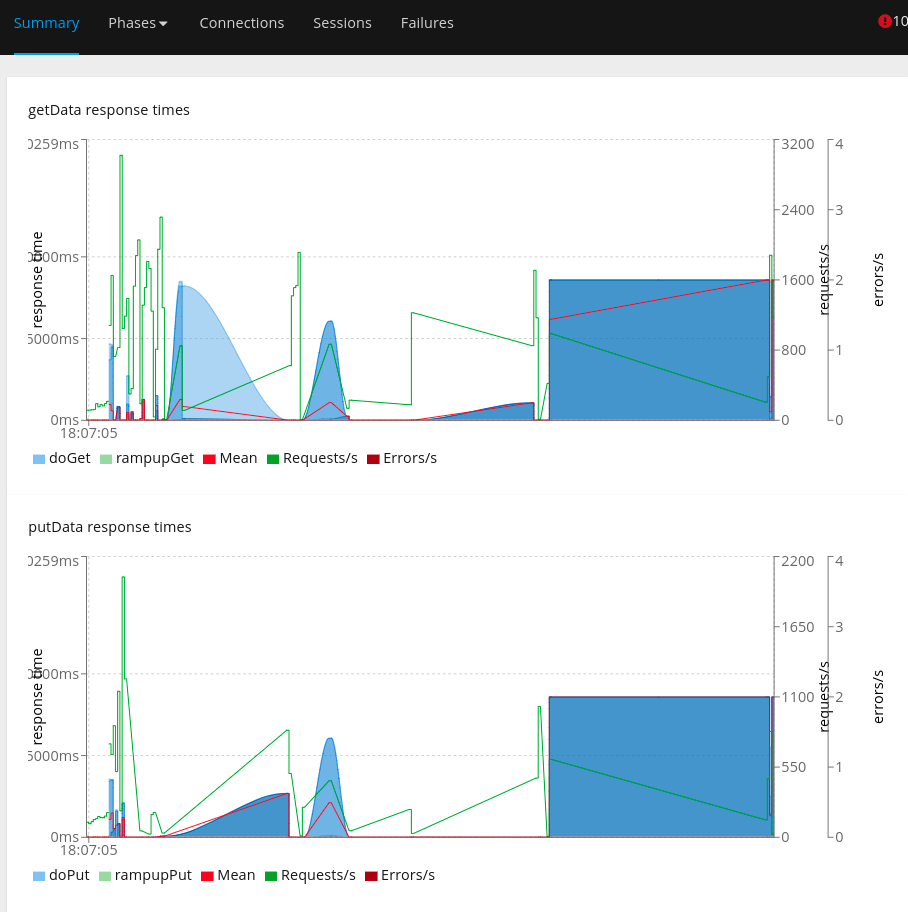
To evaluate a visual representation of your performance metrics, export a report, as shown in Figure 2.
Garbage collection and performance tuning
Although this article focuses on Hyperfoil and benchmarking, garbage collection (GC) plays a critical role in Red Hat Data Grid performance tuning.
Based on your heap configuration, garbage collection performance is measured across three aspects: latency, throughput, and footprint. You cannot optimize for all three simultaneously; usually, you must trade memory footprint for improved latency or throughput.
- Latency: The response time required to complete a process.
- Throughput: The number of transactions or operations completed per second or minute.
- Footprint: The physical or virtual memory resources consumed by the process.
Data types significantly influence performance, but configuring the correct garbage collection settings is equally important when deciding between heap and off-heap memory caches.
- Heap memory caches: The Java Virtual Machine (JVM) manages memory reclamation when you configure the cache inside the heap. The virtual machine can provide diagnostic files and utilities such as
gc.logsand thejcmdtool. While heap configuration is highly transparent, it requires you to manually select and tune your garbage collector. - Off-heap memory caches: When you set the cache to off-heap, the Data Grid server manages reclamation directly. Data Grid might delay memory reclamation of evicted or expired caches to prioritize throughput over footprint. This behavior preserves low application latency but limits your collector configuration options.
When trading memory footprint for throughput or latency, a large heap size does not necessarily degrade performance. A larger heap results in fewer, but longer, garbage collection pauses. Conversely, a smaller heap leads to more frequent but shorter pauses. Performance tuning is the process of finding the optimal balance for your workload.
Evaluating a collector solely on footprint is inadequate. For example, comparing a concurrent collector to a non-concurrent collector based only on footprint might make concurrent collectors seem universally superior. However, this is not always true for Data Grid, which uses a random allocation pattern from the virtual machine's perspective.
For example, the Garbage-First Garbage Collector (G1 GC) prioritizes low latency. It allocates and utilizes more memory to avoid full garbage collection operations, which trigger disruptive stop-the-world (STW) pauses. Conversely, the Parallel GC collector focuses on throughput. Both collectors trade memory footprint for performance.
Additionally, you must evaluate how worst-case scenarios impact your application. While G1 GC uses a larger footprint, it typically handles worst-case scenarios more gracefully by avoiding long STW pauses. Avoid evaluating performance based solely on best-case scenarios, such as constant, low-volume allocations.
When comparing collectors, non-generational options—such as non-generational Z Garbage Collector (ZGC) and non-generational Shenandoah—can introduce severe latency spikes in worst-case scenarios. G1 GC performs well because it uses a generational layout to isolate young objects, staggering memory reclamation to avoid full garbage collections (or a sequence of full GC cycles).
Because non-generational collectors do not distinguish between young and old objects, the virtual machine might attempt to reclaim all memory regions simultaneously. This synchronization can saturate threads and impact performance. Although modern versions of ZGC and Shenandoah support generational collection, understanding these mechanics helps you diagnose potential performance anomalies during tuning.
Conclusion
Hyperfoil is a valuable tool for benchmarking and performance tuning.
Because benchmark values depend on your specific use cases, node counts, and test sizes, this article does not include a compilation of results. Instead, this article demonstrates how to use the benchmarking tool in Red Hat OpenShift 4 with Red Hat Data Grid as a practical example.
Initial results indicate that scaling from one to two nodes decreases put performance. However, adding nodes to a larger cluster increases performance. Writing data across two nodes is slower than writing to a single node. These results confirm that remote clients using the Hot Rod protocol can operate up to twice as slow, while embedded clients experience minor latency increases.
For embedded clients, adding more nodes to handle a load can increase average latency because less data is stored locally. This metric might fluctuate, but overall throughput typically increases as you add nodes.
Additional resources:
- To learn more, read Java 17: What’s new in OpenJDK's container awareness.
- For specific inquiries, open a support case through the Red Hat Customer Portal. Our global team of experts can help you with any issues.
Special thanks to Ryan Emerson and Vittorio Rigamonti (my mentor) for their contributions to Data Grid at Red Hat.

