Evaluating overall cluster health is complex. To help, the cluster observability operator for Red Hat OpenShift now includes a component health overview, which is currently available as a Developer Preview feature.
This overview helps you assess the status of the OpenShift control plane and other integrated components. This feature displays health information in a custom Perses dashboard and categorizes levels as OK, warning, and error. This categorization helps administrators quickly identify cluster components that require immediate attention. Component health was introduced in cluster-health-analyzer version 1.1 and is available in cluster-observability-operator 1.4 or later.
Install the cluster observability operator
The component health feature is part of the cluster observability operator 1.4 or later. You can install this operator using OperatorHub in the Red Hat OpenShift Container Platform web console.
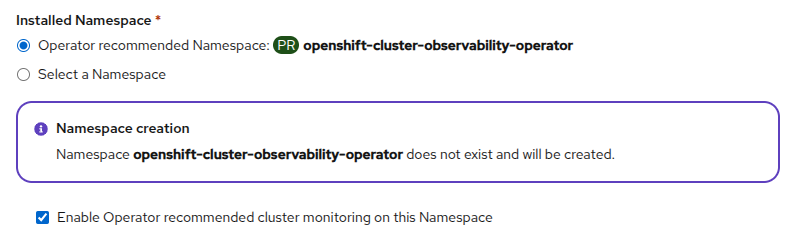
Select the Enable Operator recommended cluster monitoring on this Namespace check box, as shown in Figure 1. Otherwise, the component health overview will not be available.
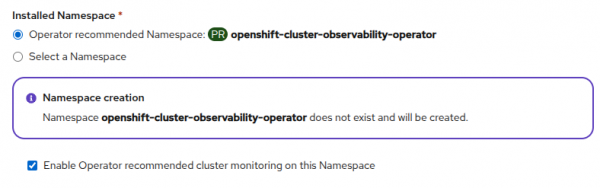
Figure 1: Enabling Operator recommended cluster monitoring during namespace creation. Create the monitoring UI plug-in using the following YAML definition:
oc apply -f - <<EOF apiVersion: observability.openshift.io/v1alpha1 kind: UIPlugin metadata: name: monitoring spec: monitoring: clusterHealthAnalyzer: enabled: true perses: enabled: true type: Monitoring EOF- Wait for the OpenShift web console to refresh.
The health-analyzer pod is now running in the openshift-cluster-observability-operator namespace. You can check the status with the following command:
oc get pod -l app.kubernetes.io/instance=health-analyzer -n openshift-cluster-observability-operatorAfter the installation, the following Prometheus metrics are available in the cluster:
component_healthcomponent_health_objectcomponent_health_alert
Components tree
When you explore the Prometheus metrics, you might see component_health_object{component="control-plane.nodes"} and component_health{component="control-plane"}. These metrics define a parent-child relationship where control-plane has a child component called nodes. This hierarchy forms a tree defined in a configmap in the cluster.
components:
  - name: control-plane
    children:
    - name: nodes
      objects:
      - resource: nodes
        selectors:
        - matchLabels:
            node-role.kubernetes.io/control-plane: []
      - resource: machineconfigpools
        group: machineconfiguration.openshift.io
        selectors:
        - matchLabels:
            pools.operator.machineconfiguration.openshift.io/master: []
    - name: capacity
      children:
      - name: cpu
        alerts:
          selectors:
          - matchLabels:
              alertname: ["KubeCPUOvercommit","HighOverallControlPlaneCPU", "ExtremelyHighIndividualControlPlaneCPU"]
      - name: memory
        alerts:
          selectors:
          - matchLabels:
              alertname: ["HighOverallControlPlaneMemory", "ExtremelyHighIndividualControlPlaneMemory", "SystemMemoryExceedsReservation"]
    - name: operators
      children:
      - name: etcd
        alerts:
          selectors:
          - matchLabels:
              namespace: ["openshift-etcd","openshift-etcd-operator"]
  - name: addons
    children:
    - name: kubevirt
      alerts:
        selectors:
        - matchLabels:
            kubernetes_operator_part_of: ["kubevirt"]
        - matchLabels:
            namespace: ["openshift-cnv"]
      objects:
      - group: kubevirt.io
        resource: kubevirts
        namespace: openshift-cnv
The health status for a component is provided through the status label and the metric value. The values map to 0 for OK, 1 for warning, and 2 for error. A parent component health status is determined by its child components; the most severe status propagates upward. For example, if a node is in an error state, the control-plane component also reflects an error status.
Perses dashboard
Components and their health statuses form a tree. We plan to visualize this hierarchy in the OpenShift web console observability overview. At this time, you can interact with this data through a Perses dashboard, which is a Developer Preview feature.
Create the Perses dashboard with the following command:
oc apply -f - <<'EOF'
apiVersion: perses.dev/v1alpha2
kind: PersesDashboard
metadata:
name: component-health-dashboard
namespace: openshift-cluster-observability-operator
spec:
config:
display:
name: Component Health Dashboard
duration: 1h
layouts:
- kind: Grid
spec:
display:
title: Component Health Overview
items:
- content:
$ref: '#/spec/panels/0_0'
height: 8
width: 24
x: 0
'y': 0
- kind: Grid
spec:
display:
title: Component Details
items:
- content:
$ref: '#/spec/panels/1_0'
height: 8
width: 24
x: 0
'y': 0
panels:
'0_0':
kind: Panel
spec:
display:
name: Top level components
plugin:
kind: Table
spec:
cellSettings:
- condition:
kind: Value
spec:
value: warning
text: WARNING
textColor: '#ffb700'
- condition:
kind: Value
spec:
value: error
text: ERROR
textColor: '#ff0000'
- condition:
kind: Value
spec:
value: OK
text: OK
textColor: '#23c200'
columnSettings:
- hide: true
name: timestamp
- hide: true
name: value
density: comfortable
queries:
- kind: TimeSeriesQuery
spec:
plugin:
kind: PrometheusTimeSeriesQuery
spec:
query: 'sum without(job,instance,container,endpoint,namespace,pod,prometheus,service) (component_health)'
seriesNameFormat: '{{component}}'
'1_0':
kind: Panel
spec:
display:
name: 'Component Details: ${component}'
plugin:
kind: Table
spec:
cellSettings:
- condition:
kind: Value
spec:
value: warning
text: WARNING
textColor: '#ffb700'
- condition:
kind: Value
spec:
value: error
text: ERROR
textColor: '#ff0000'
- condition:
kind: Value
spec:
value: OK
text: OK
textColor: '#23c200'
columnSettings:
- hide: true
name: timestamp
- hide: true
name: value
- name: component
- name: name
- name: resource
- name: progressing
- name: status
enableFiltering: true
transforms:
- kind: MergeColumns
spec:
columns:
- name
- src_alertname
name: name
queries:
- kind: TimeSeriesQuery
spec:
plugin:
kind: PrometheusTimeSeriesQuery
spec:
query: 'sum by(component,name,progressing,resource,status,src_alertname) (component_health_object{component=~"${component}.*"} or component_health_alert{component=~"${component}.*"})'
refreshInterval: 30s
variables:
- kind: ListVariable
spec:
allowAllValue: true
allowMultiple: false
defaultValue: $__all
display:
description: Select a component to view detailed health information. Use 'All Components' to see everything.
hidden: false
name: Component Filter
name: component
plugin:
kind: PrometheusLabelValuesVariable
spec:
labelName: component
matchers:
- 'component_health{}'
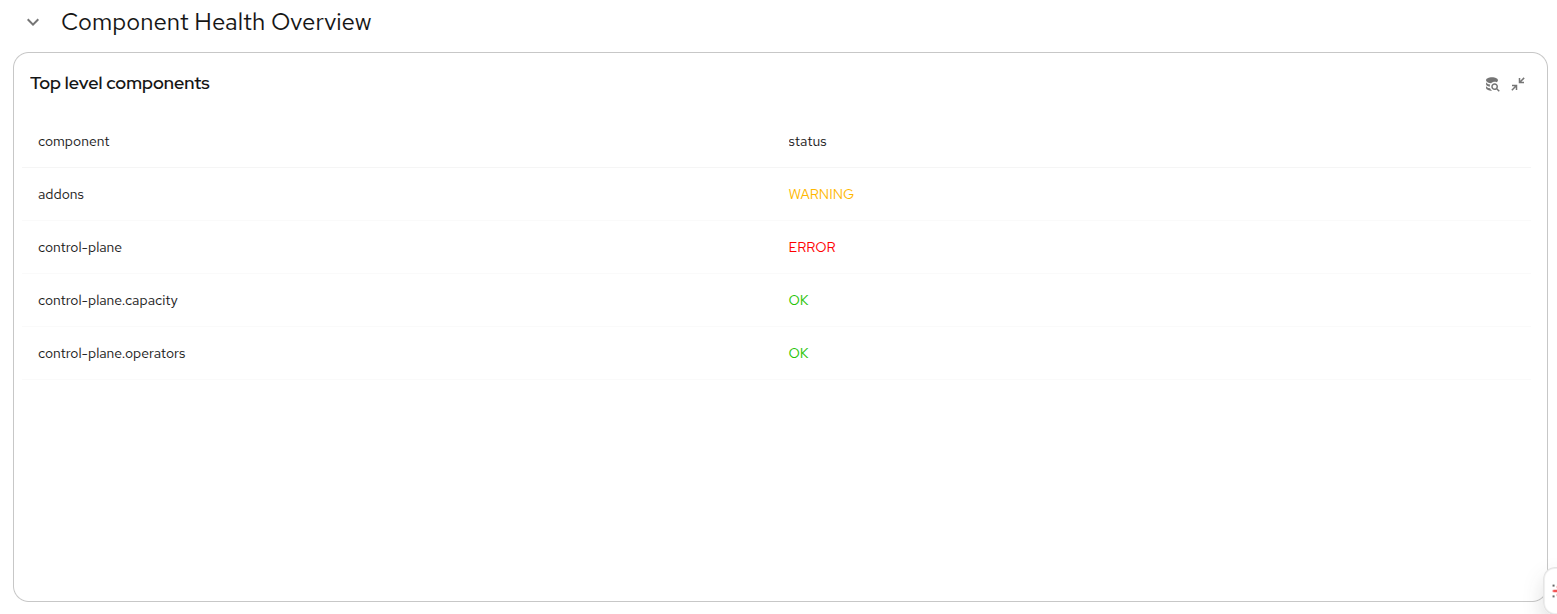
EOFThis dashboard defines two tables. The Component Health Overview table, shown in Figure 2, provides a health overview of the top-level components (those with child components).
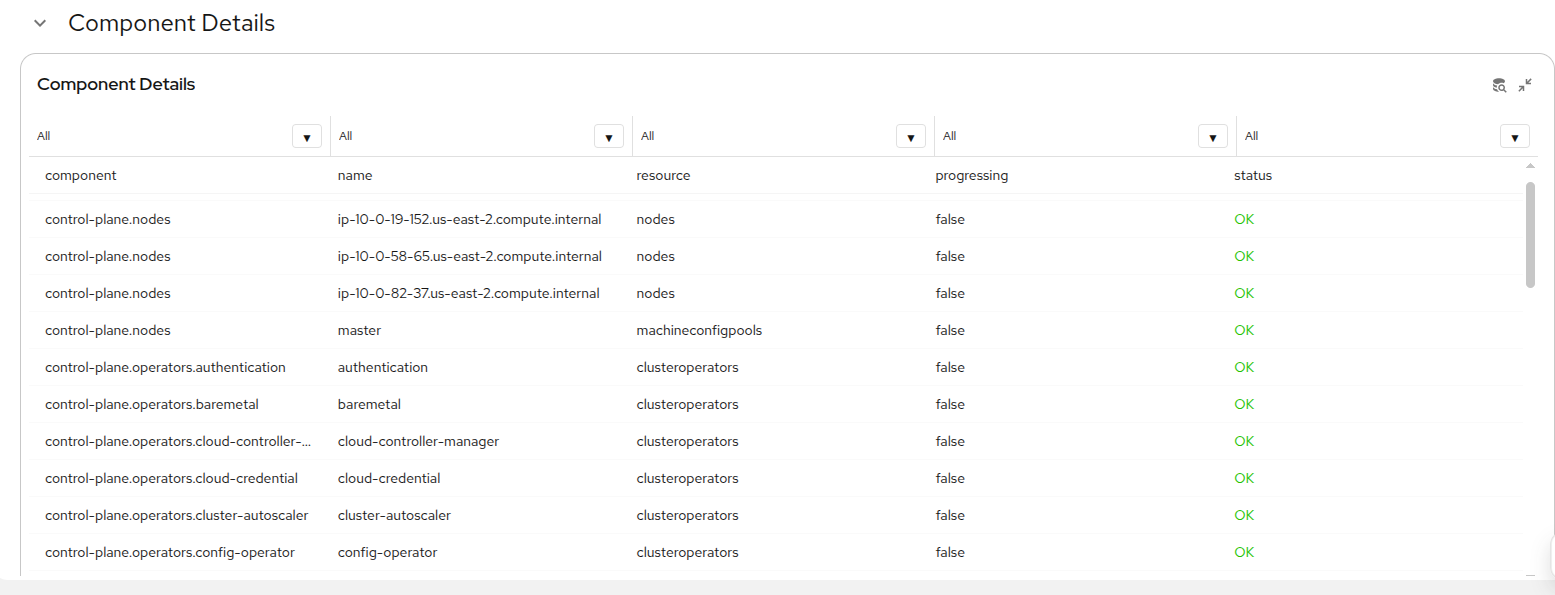
The second table, Component Details, lists all child components (Figure 3).
Limitations and next steps
The Perses dashboard is a Developer Preview feature and might have limitations and bugs, particularly with its tables. For instance, while table column filtering appears functional, the corresponding values in other columns might display incorrectly.
We plan to add a drill-down component to the Observability view in the OpenShift web console.
Future plans include allowing cluster administrators to extend the component tree definition by adding custom components.
Share your questions and recommendations with us using the Red Hat OpenShift feedback form.