Redhat Developers  Logo
  • Products

    Platforms

    • Red Hat Enterprise Linux
      Red Hat Enterprise Linux Icon
    • Red Hat AI
      Red Hat AI
    • Red Hat OpenShift
      Openshift icon
    • Red Hat Ansible Automation Platform
      Ansible icon
    • See all Red Hat products

    Featured

    • Red Hat build of OpenJDK
    • Red Hat Developer Hub
    • Red Hat JBoss Enterprise Application Platform
    • Red Hat OpenShift Dev Spaces
    • Red Hat OpenShift Local
    • Red Hat Developer Sandbox

      Try Red Hat products and technologies without setup or configuration fees for 30 days with this shared Red Hat OpenShift and Kubernetes cluster.
    • Try at no cost
  • Technologies

    Featured

    • AI/ML
      AI/ML Icon
    • Linux
      Linux Icon
    • Kubernetes
      Cloud icon
    • Automation
      Automation Icon showing arrows moving in a circle around a gear
    • See all technologies
    • Programming languages & frameworks

      • Java
      • Python
      • JavaScript
    • System design & architecture

      • Red Hat architecture and design patterns
      • Microservices
      • Event-Driven Architecture
      • Databases
    • Developer experience

      • Productivity
      • Tools
      • GitOps
    • Automated data processing

      • AI/ML
      • Data science
      • Apache Kafka on Kubernetes
    • Platform engineering

      • DevOps
      • DevSecOps
      • Red Hat Ansible Automation Platform for applications and services
    • Secure development & architectures

      • Security
      • Secure coding
  • Learn

    Featured

    • Kubernetes & cloud native
      Openshift icon
    • Linux
      Rhel icon
    • Automation
      Ansible cloud icon
    • AI/ML
      AI/ML Icon
    • See all learning resources

    E-books

    • GitOps cookbook
    • Podman in action
    • Kubernetes operators
    • The path to GitOps
    • See all e-books

    Cheat sheets

    • Linux commands
    • Bash commands
    • Git
    • systemd commands
    • See all cheat sheets

    Documentation

    • Product documentation
    • API catalog
    • Legacy documentation
  • Developer Sandbox

    Developer Sandbox

    • Access Red Hat’s products and technologies without setup or configuration, and start developing quicker than ever before with our new, no-cost sandbox environments.
    • Explore the Developer Sandbox

    Featured Developer Sandbox activities

    • Get started with your Developer Sandbox
    • OpenShift virtualization and application modernization using the Developer Sandbox
    • Explore all Developer Sandbox activities

    Ready to start developing apps?

    • Try at no cost
  • Blog
  • Events
  • Videos

How DNS name tracking enhances network observability

April 9, 2026
Mehul Modi Julien Pinsonneau
Related topics:
KubernetesObservabilityOperatorsSecurity
Related products:
Red Hat OpenShift Container PlatformRed Hat OpenShift Service on AWS

    Network observability has long had a feature that reports the DNS latencies and response codes for the DNS resolutions in your Kubernetes cluster. In the most recent network observability operator 1.11 release, a major enhancement was added to the existing DNSTracking feature to report DNS query names without any additional configuration to the FlowCollector. This article will outline the details of this new feature and the benefits.

    Enable the DNSTracking feature

    You can enable the DNSTracking feature in FlowCollector config as follows.

    spec:
      agent:
        ebpf:
          features:
          - DNSTracking

    The current implementation captures DNS latencies, response codes, and query names from DNS response packets. To understand this better, let's examine the structure of a standard DNS response packet in Figure 1.

    This graphic illustrates structure of a standard DNS response packet.
    Figure 1: The structure of a standard DNS response packet.

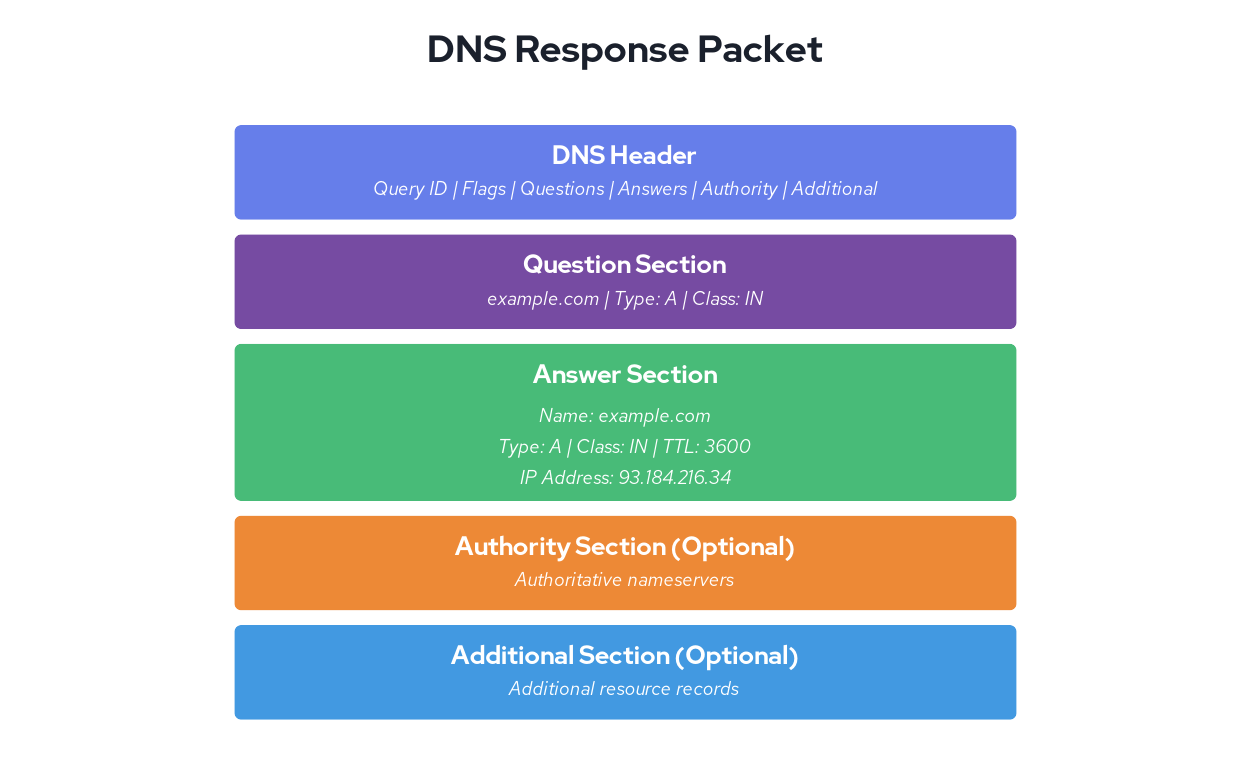
    As you may have guessed, the DNS query name is captured from the question section of a response packet. DNS resolution is the first step for most application network requests in Kubernetes. In this blog, let us demonstrate how having this information could help you troubleshoot configuration issues or could help you identify DNS configuration issues and detect suspicious network activity.

    We're running a cluster on Red Hat OpenShift Service on AWS with a simple test setup: a client pod making requests to an nginx service in a different namespace. The nginx service runs in the server namespace. While the client pod runs in the client namespace, the client pod just fetches a fixed object in a loop as follows:

     while : ; do
        curl nginx.server.svc:80/data/100K  2>&1 >  /dev/null
        sleep 5
     done

    While the requests to fetch 100K objects does succeed, can you spot the configuration issue in the previous curl command for the nginx requests that it's making? Let's look at the flowlogs in Figure 2.

    This table shows the NXDOMAIN response codes for partial DNS queries.
    Figure 2: The table shows the NXDOMAIN response codes for partial DNS queries.

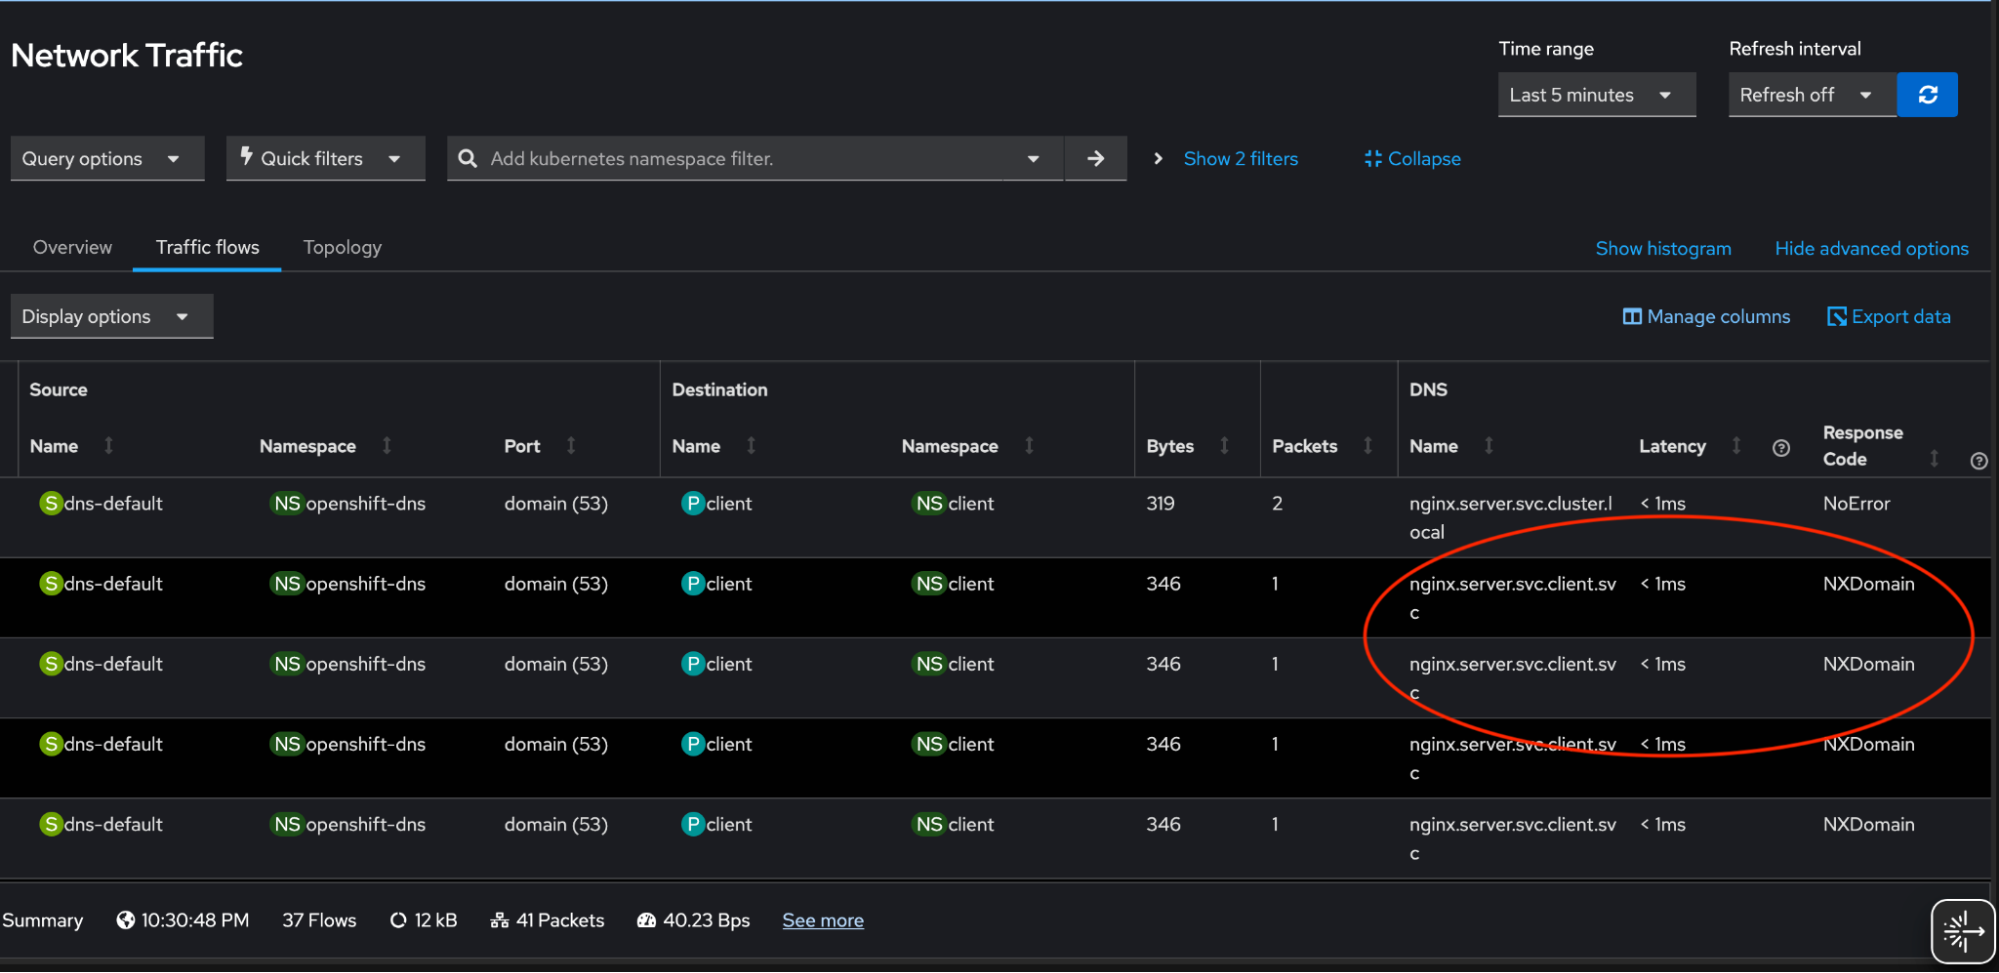
    We see several requests failing due to NXDOMAIN response code and the ones that succeed have query names nginx.server.svc.cluster.local. Since we configured short DNS name nginx.server.svc in the curl command, the cluster DNS service tries multiple search paths to find answer based on /etc/resolv.conf search directive:

    cat /etc/resolv.conf
    search server.svc.cluster.local svc.cluster.local cluster.local us-east-2.compute.internal
    nameserver 172.30.0.10
    options ndots:5

    Troubleshooting and visualization

    Short DNS names for cluster services cause high load on the cluster DNS service, resulting in higher latencies, negative caching (where DNS servers cache negative responses like NXDOMAIN until the TTL expires), and increased DNS traffic. This negative impact can be prevented by using Fully Qualified Domain Name (FQDN) in the requests. 

    After updating the hostname to nginx.server.svc.cluster.local. (note the trailing dot) in the curl requests, we are not seeing any NXDOMAINS and reduced unnecessary DNS traffic in our cluster (Figure 3). You can imagine the performance impact if such configuration issues propagated to hundreds of services in your cluster.

    This table shows FQDN DNS queries.
    Figure 3: This table view shows FQDN DNS queries.

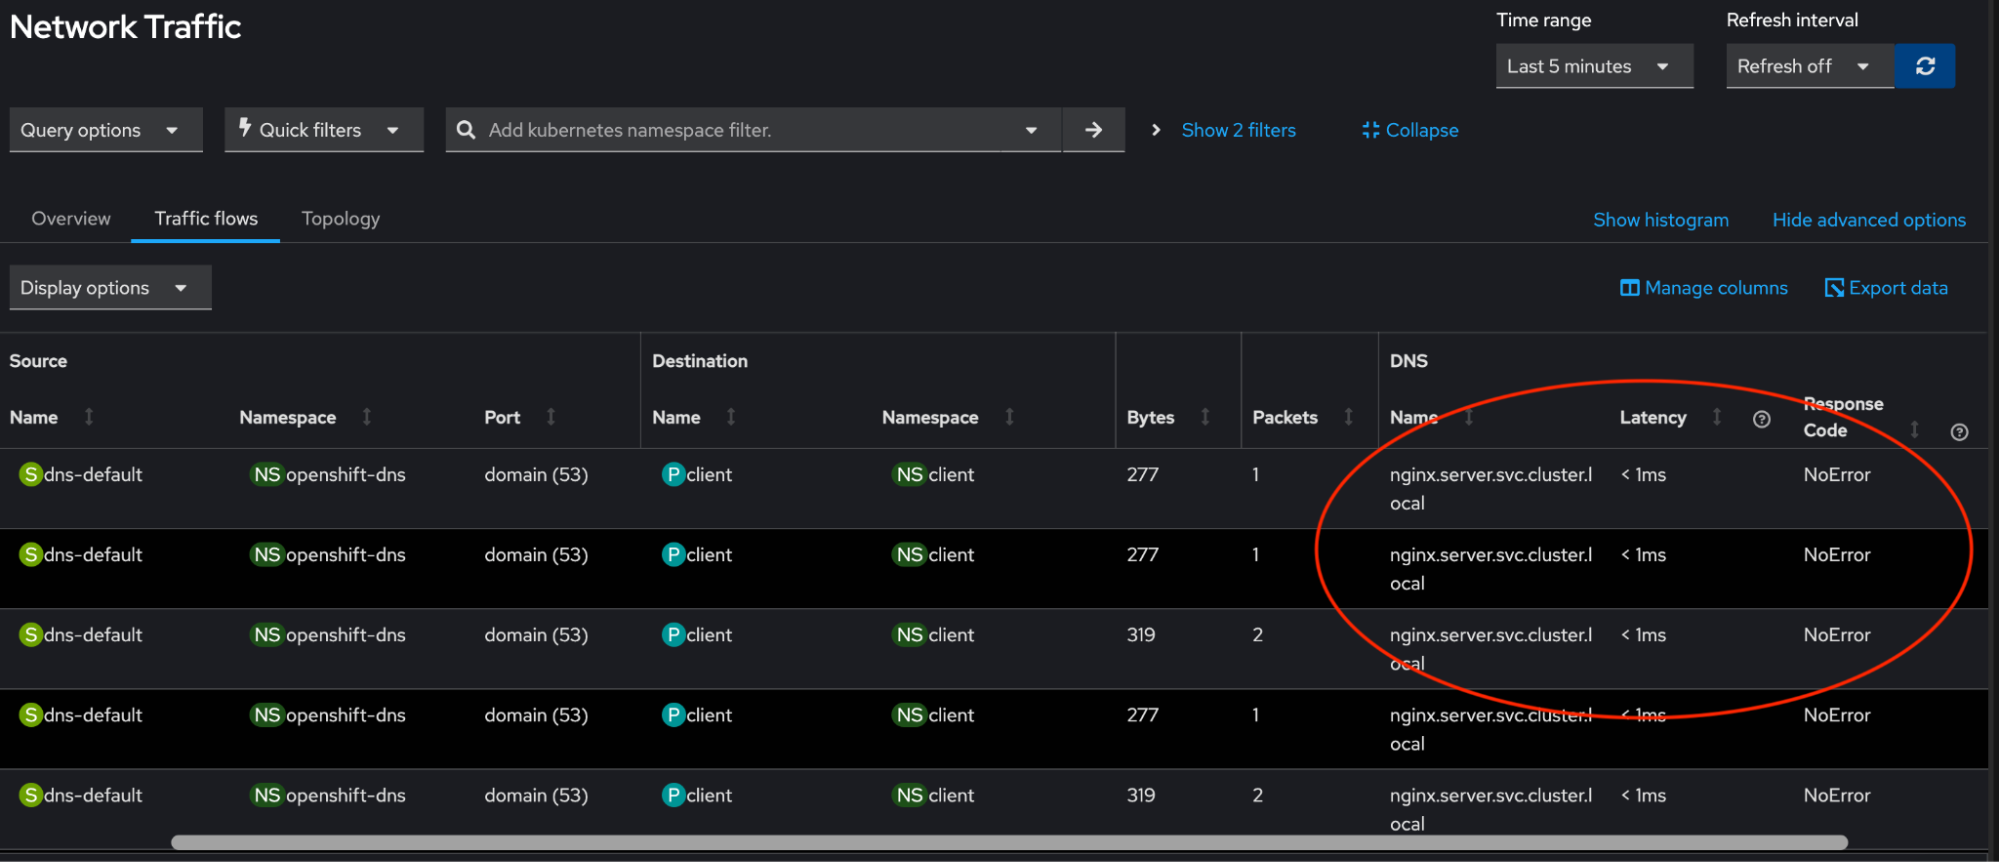
    Figure 4 shows the web console with new overview panels to fetch the top five DNS names which are queried most.

    This graphic shows the top five DNS names queried most.
    Figure 4: The overview panel shows the top 5 most queried DNS names.

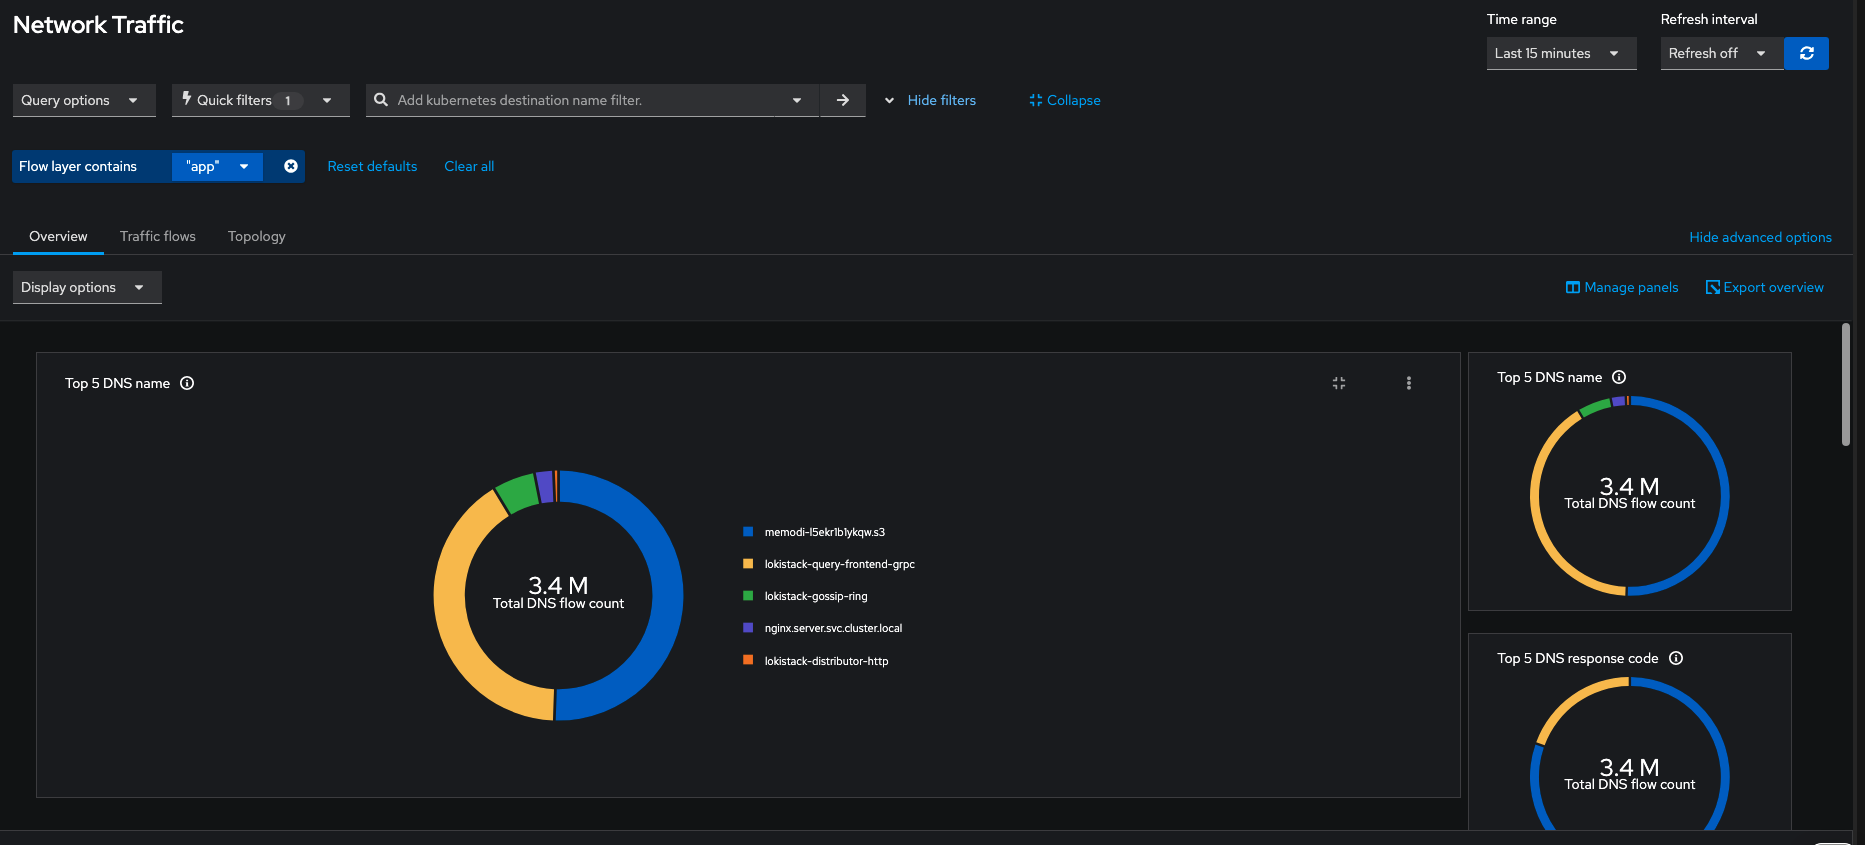
    Note that pod filters are removed in Figure 4 since the DNS service reported the DNS traffic in the cluster. This visualization can identify suspicious domain name activities in your cluster and with table view you can narrow down to the resource where such activities could be coming from.

    Technical limitations

    While DNS name decoding has great use cases in identifying and troubleshooting issues, it comes with some caveats to favor performance. This feature isn't supported by Prometheus as a datastore since storing DNS names as metric values could cause high cardinality. That means, if you want to use this feature, you must use Loki as your datasource. We're actively working to measure the performance impact and expose DNS names as Prometheus metrics.

    Captured DNS names will be truncated at 32 bytes to balance the netobserv-ebpf-agent's memory utilization, however this length should cover most practical scenarios.

    Currently, DNS name tracking does not support DNS compression pointers—a space-saving technique defined in RFC 1035 section 4.1.4. While this is a known limitation, it has minimal practical impact since compression is rarely used in the Question section where queries are tracked. Compression pointers are predominantly used in Answer sections to reference the queried domain name.

    Final thoughts

    In combination with other network observability features, such as built in alerts for overall network health, DNS name tracking will help identify real world issues faster. We'd like to acknowledge Amogh Rameshappa Devapura, Mike Fiedler, Joel Takvorian for reviewing this blog. If you'd like to share feedback, feel free to engage with us on Slack or drop in a discussion.

    Related Posts

    • What's new in network observability 1.11

    • 7 new features in the Network Observability CLI 1.8

    • Red Hat OpenShift Service on AWS with hosted control planes enables configuration of cluster monitoring operator for additional observability

    • Introducing incident detection in Red Hat Advanced Cluster Management for Kubernetes 2.14

    Recent Posts

    • Build resilient guardrails for OpenClaw AI agents on Kubernetes

    • Enable Firewall-as-a-Service in OpenStack Services on OpenShift

    • How DNS name tracking enhances network observability

    • Manage AI context with the Lola package manager

    • Agent-driven attestation: How Keylime's push model rethinks remote integrity verification

    What’s up next?

    Learning Path ROSA share image

    How to deploy an application using Red Hat OpenShift Service on AWS

    Learn how to deploy an application on a cluster using Red Hat OpenShift...
    Red Hat Developers logo LinkedIn YouTube Twitter Facebook

    Platforms

    • Red Hat AI
    • Red Hat Enterprise Linux
    • Red Hat OpenShift
    • Red Hat Ansible Automation Platform
    • See all products

    Build

    • Developer Sandbox
    • Developer tools
    • Interactive tutorials
    • API catalog

    Quicklinks

    • Learning resources
    • E-books
    • Cheat sheets
    • Blog
    • Events
    • Newsletter

    Communicate

    • About us
    • Contact sales
    • Find a partner
    • Report a website issue
    • Site status dashboard
    • Report a security problem

    RED HAT DEVELOPER

    Build here. Go anywhere.

    We serve the builders. The problem solvers who create careers with code.

    Join us if you’re a developer, software engineer, web designer, front-end designer, UX designer, computer scientist, architect, tester, product manager, project manager or team lead.

    Sign me up

    Red Hat legal and privacy links

    • About Red Hat
    • Jobs
    • Events
    • Locations
    • Contact Red Hat
    • Red Hat Blog
    • Inclusion at Red Hat
    • Cool Stuff Store
    • Red Hat Summit
    © 2026 Red Hat

    Red Hat legal and privacy links

    • Privacy statement
    • Terms of use
    • All policies and guidelines
    • Digital accessibility

    Report a website issue