Redhat Developers  Logo
  • AI

    Get started with AI

    • Red Hat AI
      Accelerate the development and deployment of enterprise AI solutions.
    • AI learning hub
      Explore learning materials and tools, organized by task.
    • AI interactive demos
      Click through scenarios with Red Hat AI, including training LLMs and more.
    • AI/ML learning paths
      Expand your OpenShift AI knowledge using these learning resources.
    • AI quickstarts
      Focused AI use cases designed for fast deployment on Red Hat AI platforms.
    • No-cost AI training
      Foundational Red Hat AI training.

    Featured resources

    • OpenShift AI learning
    • Open source AI for developers
    • AI product application development
    • Open source-powered AI/ML for hybrid cloud
    • AI and Node.js cheat sheet

    Red Hat AI Factory with NVIDIA

    • Red Hat AI Factory with NVIDIA is a co-engineered, enterprise-grade AI solution for building, deploying, and managing AI at scale across hybrid cloud environments.
    • Explore the solution
  • Learn

    Self-guided

    • Documentation
      Find answers, get step-by-step guidance, and learn how to use Red Hat products.
    • Learning paths
      Explore curated walkthroughs for common development tasks.
    • Guided learning
      Receive custom learning paths powered by our AI assistant.
    • See all learning

    Hands-on

    • Developer Sandbox
      Spin up Red Hat's products and technologies without setup or configuration.
    • Interactive labs
      Learn by doing in these hands-on, browser-based experiences.
    • Interactive demos
      Click through product features in these guided tours.

    Browse by topic

    • AI/ML
    • Automation
    • Java
    • Kubernetes
    • Linux
    • See all topics

    Training & certifications

    • Courses and exams
    • Certifications
    • Skills assessments
    • Red Hat Academy
    • Learning subscription
    • Explore training
  • Build

    Get started

    • Red Hat build of Podman Desktop
      A downloadable, local development hub to experiment with our products and builds.
    • Developer Sandbox
      Spin up Red Hat's products and technologies without setup or configuration.

    Download products

    • Access product downloads to start building and testing right away.
    • Red Hat Enterprise Linux
    • Red Hat AI
    • Red Hat OpenShift
    • Red Hat Ansible Automation Platform
    • See all products

    Featured

    • Red Hat build of OpenJDK
    • Red Hat JBoss Enterprise Application Platform
    • Red Hat OpenShift Dev Spaces
    • Red Hat Developer Toolset

    References

    • E-books
    • Documentation
    • Cheat sheets
    • Architecture center
  • Community

    Get involved

    • Events
    • Live AI events
    • Red Hat Summit
    • Red Hat Accelerators
    • Community discussions

    Follow along

    • Articles & blogs
    • Developer newsletter
    • Videos
    • Github

    Get help

    • Customer service
    • Customer support
    • Regional contacts
    • Find a partner

    Join the Red Hat Developer program

    • Download Red Hat products and project builds, access support documentation, learning content, and more.
    • Explore the benefits

LogAn: Large-scale log analysis with small language models

May 28, 2026
Rahul Shetty Aman Vishwakarma
Related topics:
AI inferenceArtificial intelligence
Related products:
Red Hat AI

    Where Large Language Models (LLMs) meet logs, things can break down. Language models are remarkably good at understanding text. So the natural instinct when debugging a production outage is to dump the logs into an LLM and ask, "what went wrong?" It doesn't scale. This article explains why.

    The limits of LLMs in log analysis

    A single support case can easily produce over 500 MB of log data, or millions of lines. Even with the largest context windows available today, you can't fit a real-world log dump into an LLM prompt. Even if you could, you'd be paying to process mostly noise. In a typical log file, over 78% of lines are routine informational messages. The actual errors are often less than 1%.

    Consider this snippet:

    2026-02-04T14:18:03Z Starting batch file processor version 2.7.4
    2026-02-04T14:18:04Z Initializing local workspace at /var/lib/processor/tmp
    2026-02-04T14:18:07Z java.io.IOException: No space left on device
    2026-02-04T14:18:09Z Uploading results to http://archive-service:8080/api/v1/archive
    2026-02-04T14:18:12Z Request to archive-service exceeded configured timeout (3000ms)
    2026-02-04T14:18:13Z Processing completed for batchId=run-88421

    A regex search for error or exception catches the IOException on line 3. But it completely misses line 5, a timeout that could be the more important signal. That line has no error keyword. Understanding it requires semantic interpretation.

    The fundamental issue is that rule-based tools (e.g., grep and regex) are fast but miss implicit failures. The LLMs understand semantics but can't handle the volume. You need something in between.

    The key insight: Logs are massively redundant

    Here's a fact that changes the equation: production logs are highly repetitive. Thousands of lines often share the same structure with only variable parts changing (e.g., IPs, timestamps, request IDs, hostnames, etc).

    LogAn extracts unique templates to group structurally similar logs, applying analysis to a single representative of each group. These results are then broadcast back to all group members, eliminating the need to analyze every individual log line.

    Developed by IBM Research and now open-source with contributions from Red Hat, LogAn combines two techniques:

    • Log templatization: LogAn utilizes a template mining algorithm called Drain to compress raw logs by extracting their underlying structural patterns.
    • Semantic analysis:  By incorporating foundation models trained on NLP tasks, LogAn can interpret the meaning of log lines to extract deeper diagnostic insights.

    The compression is dramatic. The following table shows benchmarks across different log domains.

    Log Source (loghub)

    Lines

    Unique Templates

    Reduction

    Mac

    2,000

    197

    90.1%

    Hadoop

    2,000

    75

    96.3%

    Android

    2,000

    55

    97.3%

    HDFS

    2,000

    15

    99.3%

    In a production case study, 199,181 log lines (63 MB) compressed to just 97 unique templates. Of those, only 41 were non-informational. Instead of analyzing ~200K lines, an engineer reviews 41.

    LogAn's pipeline has five stages, as shown in Figure 1.
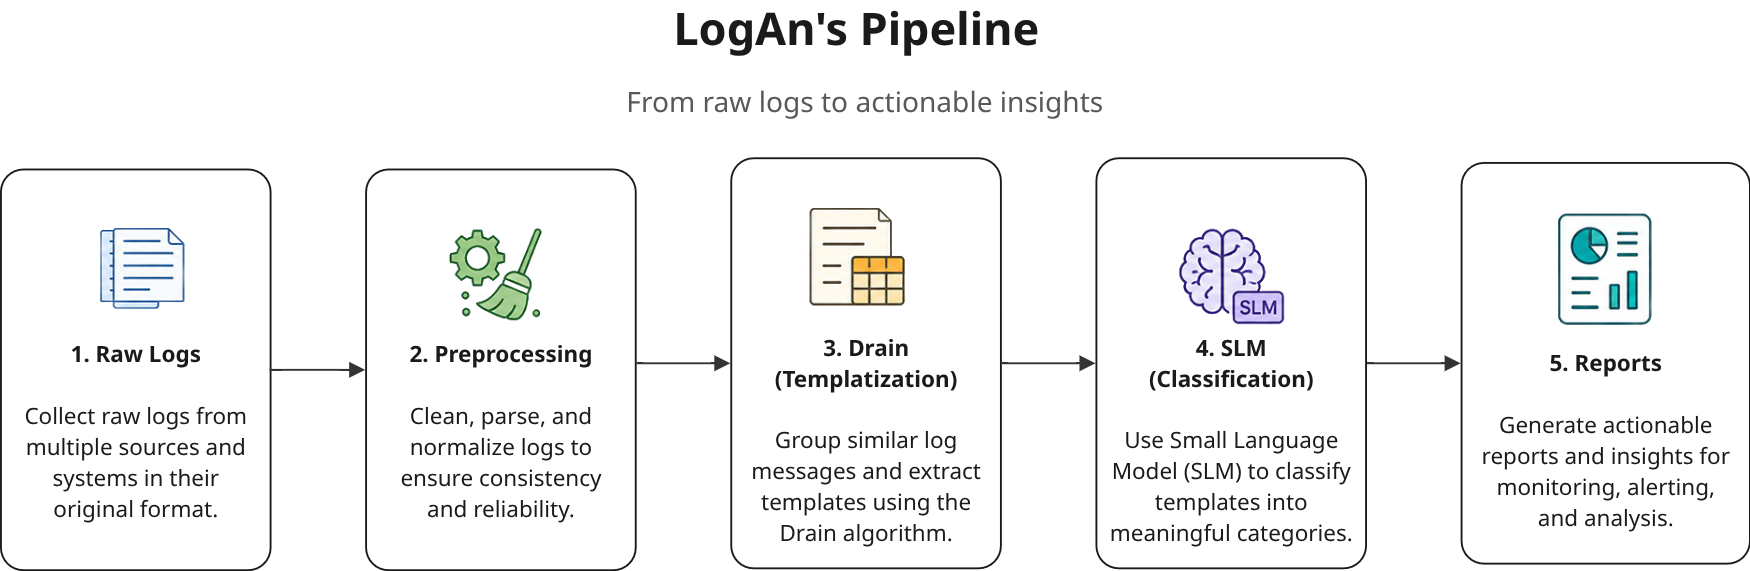
    This shows the five stages of the LogAn pipeline.
    Figure 1: A step-by-step workflow of how LogAn transforms raw logs into insights.

    Drain: Compressing logs into templates

    The Drain algorithm builds a fixed-depth parse tree to group structurally similar log messages:

    • Tokenizes each log line.
    • Routes lines through the tree, first by token count, then by leading tokens.
    • At leaf nodes, a similarity score determines whether the line matches an existing group or starts a new cluster.
    • Masks variable parts (e.g., IPs, numbers, and paths). Constant parts form the template (Figure 2).
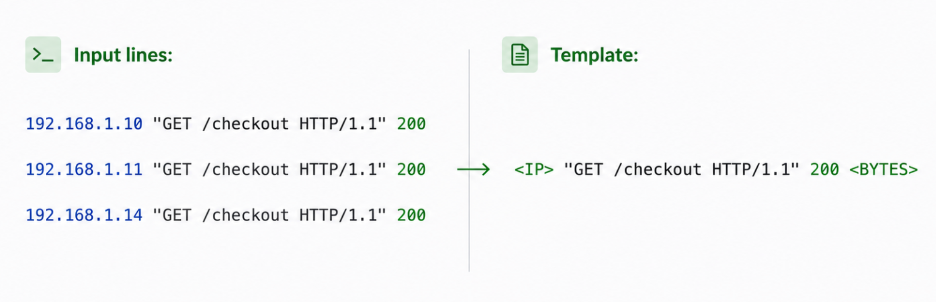
    This identifies the Drain constant and variable parts of log lines.
    Figure 2: Drain identifies the constant and variable parts of these log lines to create a unique template.

    SLM classification and label broadcasting

    Once Drain extracts the templates, LogAn picks a representative log line from each cluster and classifies it using a zero-shot text classifier. Since every log in a cluster shares the same structure, the classification broadcasts to all members.

    This is the trick that makes the approach scale. Without label broadcasting, inference time grows linearly: about 3,000 seconds for 150K logs. With it, inference stays flat around 10-12 seconds regardless of dataset size because the number of unique templates plateaus, even as log volume grows (Figure 3).
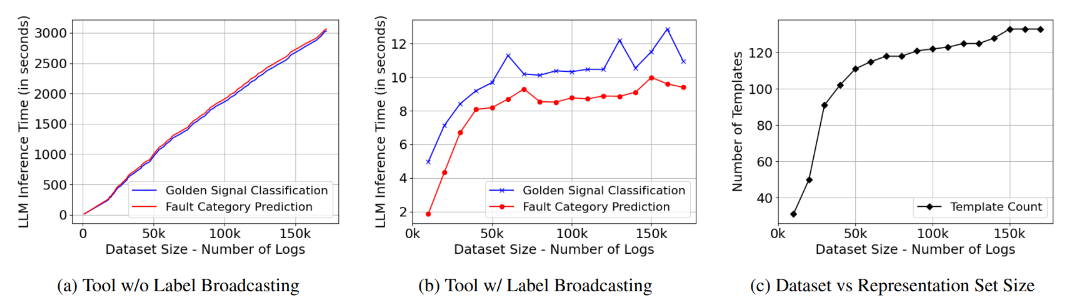
    These graphs compare LLM inference costs.
    Figure 3: Comparison of LLM inference cost (with vs. without label broadcasting) and template growth with dataset size. (Source: Scalable and Efficient Large-Scale Log Analysis with LLMs)

    LogAn classifies each template into golden signals (from Google's SRE Handbook).

    Signal

    Meaning

    Example Log

    Availability

    Service unreachable

    NoRouteToHostException: No route to host

    Error

    A fault occurred

    Got an XPC error: Connection invalid

    Latency

    Delays/timeouts

    Notification time out 60000

    Saturation

    Resource limits hit

    IOException: No space on disk

    Traffic

    Volume/demand related

    673 bytes sent, 384 bytes received

    Information

    Routine, non-critical

    application connected ok

    A second pass predicts fault categories for non-informational logs, giving engineers immediate diagnostic context. LogAn uses multi-label classification, so a single log can belong to multiple fault categories.

    Fault Category

    Description

    Example Log

    I/O

    Input/output operations, file system interactions, or data transfer

    java.io.IOException: No space left on device

    Authentication

    User authentication, authorization, or security protocols

    Failed to authenticate user: invalid credentials

    Network

    Network connectivity, routing, or protocol interactions

    Request to archive-service exceeded configured timeout (3000ms)

    Application

    Application-level events, process interactions, or service calls

    NullPointerException in com.example.service.OrderProcessor

    Device

    Hardware device status, driver activity, or peripheral operations

    USB device disconnected: kernel driver unloaded

    Internally, we use a fine-tuned encoder model specifically trained for log label classification, delivering higher accuracy on domain-specific log data. LogAn's bring your own model (BYOM) support lets you plug in your encoder, a fine-tuned model, or an LLM with custom labels, whatever best fits your environment and use case.

    Get started with LogAn

    LogAn is open source and ready to use today. Whether you want to try it on your logs, integrate it into your observability pipeline, or contribute upstream, here's how to get involved.

    Run LogAn locally as a standalone CLI or as a Podman container.

    # Container Usage
    podman run --rm \
        -v ./logs/:/data/input/:z \
        -v ./output/:/data/output/:z \
        -e LOGAN_INPUT_FILES="/data/input/app.log" \
        ghcr.io/log-analyzer/logan:latest
    
    # CLI Usage
    uv pip install git+https://github.com/Log-Analyzer/LogAn
    uv run logan analyze -f "examples/Linux_2k.log" -o "tmp/output"
    uv run logan view -d "tmp/output"  # Start localhost server for log report

    The analyze command produces two interactive HTML reports. The summary report gives an overview, including total log lines processed, a golden signal timeline chart showing how signal types are distributed over time, and a searchable table of unique log templates with their classifications. The anomaly report breaks logs into time windows, highlights anomalous sequences, and allows you to filter by golden signal or drill into individual log lines. 

    Explore the code and contribute

    The development of LogAn includes contributions from IBM Research and Red Hat. Browse the source code, open issues, or submit a pull request at LogAn on GitHub.

    Learn more:

    • Scalable and Efficient Large-Scale Log Analysis with LLMs (AAAI 2026)
    • LogAn: An LLM-Based Log Analytics Tool with Causal Inferencing (ICPE 2025)
    • Learning Representations on Logs for AIOps (IEEE CLOUD 2023)

    Related Posts

    • Scale LLM fine-tuning with Training Hub and OpenShift AI

    • Run Model-as-a-Service for multiple LLMs on OpenShift

    • 5 steps to triage vLLM performance

    • Practical strategies for vLLM performance tuning

    Recent Posts

    • LogAn: Large-scale log analysis with small language models

    • stalld’s BPF Backend: Breaking Free from debugfs

    • Running AI inference on Rebellions ATOM NPU with Red Hat AI

    • How we built integration testing for fast-moving AI backend

    • Testing infrastructure red teaming with abliterated models

    What’s up next?

    Learning Path RHEL_AI_LP_featured_Image

    Download, serve, and interact with LLMs on RHEL AI

    Configure your Red Hat Enterprise Linux AI machine, download, serve, and...
    Red Hat Developers logo LinkedIn YouTube Twitter Facebook

    Platforms

    • Red Hat AI
    • Red Hat Enterprise Linux
    • Red Hat OpenShift
    • Red Hat Ansible Automation Platform
    • See all products

    Build

    • Developer Sandbox
    • Developer tools
    • Interactive tutorials
    • API catalog

    Quicklinks

    • Learning resources
    • E-books
    • Cheat sheets
    • Blog
    • Events
    • Newsletter

    Communicate

    • About us
    • Contact sales
    • Find a partner
    • Report a website issue
    • Site status dashboard
    • Report a security problem

    RED HAT DEVELOPER

    Build here. Go anywhere.

    We serve the builders. The problem solvers who create careers with code.

    Join us if you’re a developer, software engineer, web designer, front-end designer, UX designer, computer scientist, architect, tester, product manager, project manager or team lead.

    Sign me up

    Red Hat legal and privacy links

    • About Red Hat
    • Jobs
    • Events
    • Locations
    • Contact Red Hat
    • Red Hat Blog
    • Inclusion at Red Hat
    • Cool Stuff Store
    • Red Hat Summit
    © 2026 Red Hat

    Red Hat legal and privacy links

    • Privacy statement
    • Terms of use
    • All policies and guidelines
    • Digital accessibility

    Chat Support

    Please log in with your Red Hat account to access chat support.