In this blog post, we examine the computational performance and power consumption of a 32-core x64 system equipped with a dual-port 100 Gigabit Ethernet (GbE) network card. Our analysis focuses on the following aspects:
- Throughput measurement
- CPU utilization
- Computational efficiency
- Power consumption
- Power efficiency
If you are not familiar with the testing methodologies or the units used for the metrics listed above, refer to our previous blog post, Optimizing energy efficiency on Red Hat Enterprise Linux. The goal of this follow-up post is to provide a real-life example of the testing methodology described in the previous post, and to set realistic expectations for throughput and power consumption.
Hardware used for the test
As a representative sample of recent server hardware, we will be using a single-socket system equipped with:
- 32-core CPU with 3.2 GHz base frequency fabricated using 5 nm technology
- 196 GB of DDR5 DRAM
- Dual-port 100 GbE network adapter
- 1 TB NVMe drive
We consider this a realistic example of a server that is correctly sized for network-intensive workloads in a 100 GbE environment. For hyperscale environments or high-performance computing, this setup would most likely be underpowered. We won't be considering such environments for the purposes of this blog post, however, and will stay focused on a node running one or few network-intensive applications
Testing methodology
We will be executing the testing methodologies described in detail in our previous blog post.
For this post, we will consider two additional metrics:
- Computational efficiency for 3 GHz core
- Scaling factor
Computational efficiency for 3 GHz core
The formula for computing the computational efficiency for a 3 GHz core is as follows:
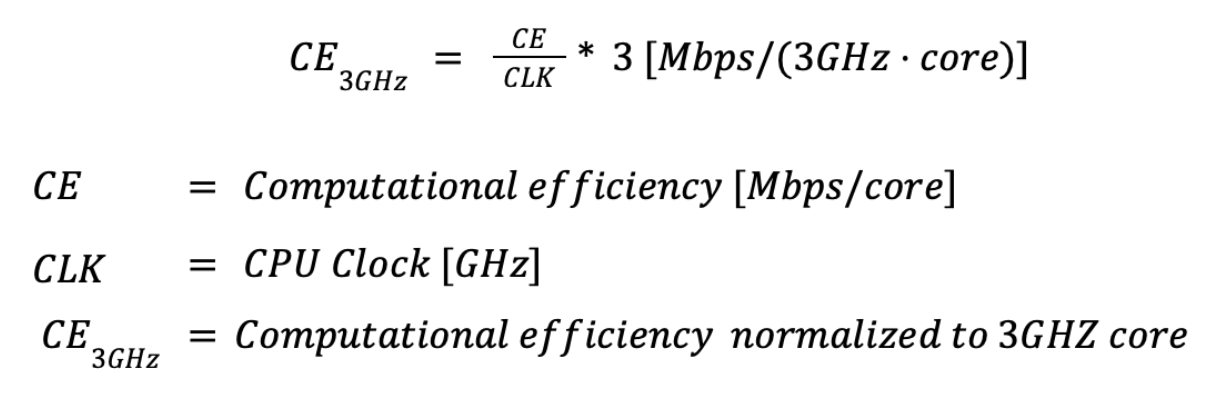
This metric normalizes computational efficiency by the CPU's base clock frequency. This normalization provides a concise view of instructions per core for network-related workloads. By multiplying the normalized CPU efficiency by 3, we derive a more intuitively comparable figure representing how the same CPU would perform if clocked at 3 GHz in our setup. This value is entirely extrapolative and hypothetical. Its sole purpose is to enable approximate comparisons across CPUs with differing clock speeds and core architectures.
Scaling factor
The formula for calculating the scaling factor for N parallel iperf3 instances is as follows:
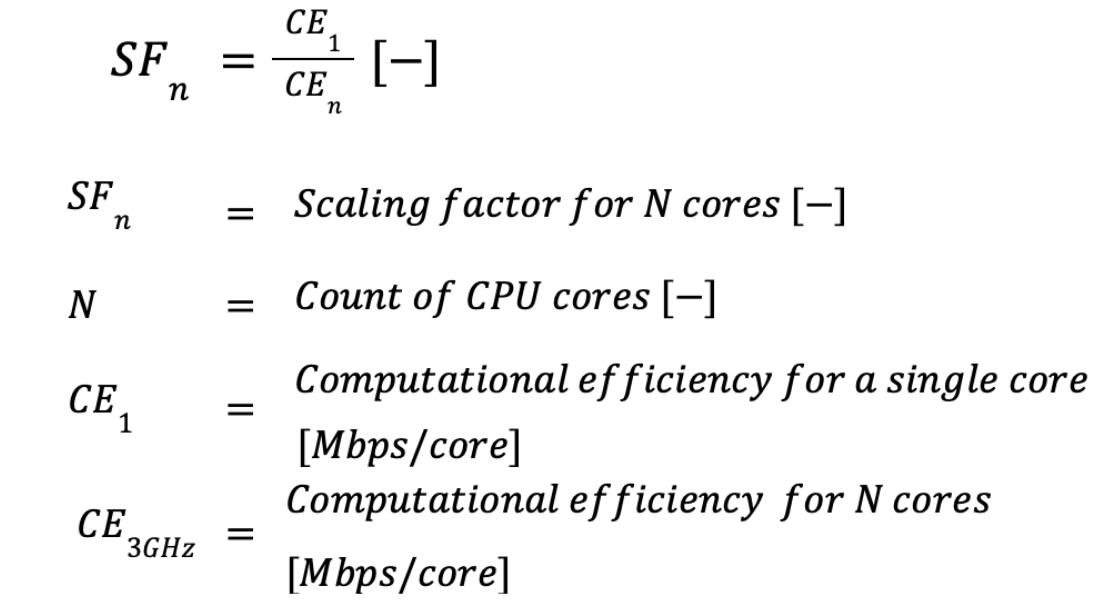
This metric measures diminishing returns when running parallel network-related workloads. Ideally, doubling the number of iperf3 instances should result in a doubling of achievable throughput. In real-world scenarios, however, concurrent iperf3 instances compete for shared resources, creating scalability bottlenecks. These resources may include DRAM bandwidth, available chip thermal design power (TDP), and—when the link is saturated—NIC bandwidth.
Test results
Our tests measured both performance and power consumption.
Performance testing results
We used iperf3 and NUMA-aware processes and interrupt pinning. The results are summarized in Table 1 and in Figures 1-3.
# of instances | Operating regime | Frequency | Throughput | Remote CPU utilization | Computational Efficiency | Computational efficiency for 3Ghz core | Scaling factor |
|---|---|---|---|---|---|---|---|
[GHz] | [Mbps] | [%] | Mbps/core | Mbps/core | [-] | ||
1 | Single core | 3.2 | 24,287.36 | 168.66 | 14400.19 | 13500.17 | 1 |
2 | Multi core | 3.2 | 45,148.76 | 337.55 | 13375.43 | 12539.46 | 0.93 |
4 | Multi core | 3.2 | 79,982.62 | 673.33 | 11878.67 | 11136.25 | 0.82 |
8 | Multi core | 3.2 | 94,237.26 | 942.52 | 9998.44 | 9373.54 | 0.69 |
16 | Saturated | 3.2 | 110,831.41 | 1,344.55 | 8243.06 | 7727.82 | 0.57 |


Single-core performance
In a single-core regime, the CPU has ample available TDP, and the network card also has plenty of available bandwidth. The determining factors for achievable throughput are the maximum available turbo boost frequency and the CPU's instructions per cycle (IPC). We measured single-core performance of 24 Gbps per core; when normalized to a hypothetical 3 GHz CPU, this corresponds to 22.7 Gbps per core. This is a respectable result, but not particularly stellar.
During the development of the testing and orchestration harness, we measured throughput exceeding 40 Gbps per core on a 4 GHz desktop CPU, which is equivalent to roughly 30 Gbps per core when normalized to 3 GHz. Desktop CPUs tend to prioritize higher IPC and higher turbo boost frequencies, often at the expense of scalability and parallel performance.
Multicore performance
The multicore regime in our test setup begins with two parallel instances, which achieve 45 Gbps of network throughput, and scales up to eight parallel instances, reaching 94 Gpbs of TCP throughput. This corresponds to the line rate of 100 Gbps Ethernet, minus the necessary protocol overhead.
Across this regime, we observe that adding more CPU cores produces diminishing returns. Adding a 2nd core yields only 92% of the ideal linear performance increase. With a single instance, a hypothetical 3 GHz CPU would deliver 13.5 Gbps per core. With 8 cores, however, the same hypothetical 3 GHz CPU yields only 9.3 Gbps per core. While this result is somewhat disappointing, we still consider this level of horizontal scaling more than adequate for the intended use case.
The diminishing returns of horizontal CPU scaling also introduce several important economic considerations.
- Up to a certain number of CPU cores, adding cores helps dilute the fixed costs of the system barebone and rack space.
- Beyond that point, however, both the reduced marginal performance gains and the higher cost per core of high-density CPU models can no longer justify further scaling within a single system.
- When additional compute capacity is required, deploying an additional system becomes the more economical option.
- Future-proofing and the cost of potential upgrades must also be factored into this decision.
In the multicore regime, instances also compete for the available thermal headroom of the CPU. Even when iperf3 instances are CPU-pinned, interrupts are still distributed across cores by the Receive Side Scaling (RSS) mechanism. RSS uses hashing to assign network interrupts to individual CPU cores. Depending on the hash outcome, collisions may occur, creating localized bottlenecks on affected cores. With a small number of TCP streams, this can lead to result instability and subtle hashing artifacts that are difficult to detect. This is the primary reason multiple test runs and statistical evaluation of the results are required.
Saturated performance
After nearly saturating the 100 Gbps link with eight iperf3 instances, we decided to run an additional experiment. This time, we doubled the number of instances to 16 and also doubled the available NIC bandwidth by using both ports on the network card. In effect, we scaled the original experiment by a factor of 2—both in compute resources and in available network bandwidth—with the expectation of approaching 200 Gbps throughput.
The results were disappointing. While CPU load increased by 42% (from 942% to 1344%), throughput improved by only 17% (from 94 Gbps to 110 Gbps). Despite extensive tuning and experimentation, we were unable to break through this apparent 110 Gbps barrier.
The root cause only became clear after a careful review of the network card's silicon datasheet. We discovered that the NIC contains an internal switch with a maximum aggregate throughput of 100 Gbps across all hardware ports and virtual functions. Although this limitation was accurately documented in the silicon datasheet, it was notably absent from the marketing materials.
The key takeaway is that hidden hardware bottlenecks can be particularly costly: even when throughput is capped, the system may continue to consume significant CPU resources as processes compete for bandwidth that does not actually exist. Those wasted CPU cycles could otherwise be used for productive work.
Testing system power consumption
In the next and more important part of our test, we started with the throughput from the performance testing results and divided it by CPU consumption itself to get CPU power efficiency. Then we divided that throughput by DC power supply unit (PSU) output to get system power efficiency. We put special emphasis on whole system power efficiency because this is the figure that is the most relevant to day-to-day data center operation. The measured results can be found in Table 2 and in Figures 4 and 5.
# of cores | Operating regime | Frequency | CPU | Throughput | PSU out | CPU in | System power efficiency | CPU power efficiency | CPU power as a fraction of system consumption |
|---|---|---|---|---|---|---|---|---|---|
[Ghz] | [Mbps] | [W] | [W] | [Mbps/W] | [Mbps/W] | [%] | |||
1 | Single core | 3.2 | X64 32 cores | 24,287.36 | 210.01 | 104.00 | 115.65 | 233.53 | 49.52 |
2 | Multi core | 3.2 | X64 32 cores | 45,148.76 | 216.00 | 104.00 | 209.02 | 434.12 | 48.15 |
4 | Multi core | 3.2 | X64 32 cores | 79,982.62 | 228.50 | 112.00 | 350.03 | 714.13 | 49.01 |
8 | Multi core | 3.2 | X64 32 cores | 94,237.26 | 339.24 | 99.98 | 277.79 | 942.52 | 29.47 |
16 | Saturated | 3.2 | X64 32 cores | 110,831.41 | 249.00 | 136.00 | 445.11 | 814.94 | 54.62 |


Figures 4 and 5 make it clear that both CPU power efficiency and overall system efficiency increase as the number of iperf3 instances grows. However, diminishing returns are observed when adding additional CPU cores and iperf3 instances. By the end of the test, overall system efficiency is four times higher than at the beginning.
Our data also shows that CPU power management alone accounts for only part of the overall efficiency story, as CPU power consumption represents roughly 50% of total system power usage. When fully loaded with 16 iperf3 instances, the system draws 249 W from the power source.
We attempted to break this down by individual system components using the information available in the vendor's datasheet and summarized these estimates in Table 3 and Figure 6.
| CPU (measured) | 136W |
| 12 DDR5 modules (datasheet) | 48W |
| Network card (datasheet) | 20W |
| Idle SSD (datasheet) | 2W |
| 8x 1U fan running at 4000 RPM (measured) | 32W |
| Motherboard and the rest of the system (estimate) | 11W |

Our data shows that power consumption peaks when running eight parallel iperf3 instances, reaching approximately 90 W higher than when running 16 instances. Comparing CPU and overall system power usage indicates that this spike is not primarily caused by the CPU, suggesting that other components are responsible.
Our working hypothesis is that, under this load, some CPU cores continue operating in boost mode, prompting the firmware to increase fan speeds to maximum in order to maintain full boost. The additional power drawn by the cooling fans—which can be up to 80 W—likely accounts for the observed increase in overall system power consumption.
We can also confirm that, under 8-instance load, the system is noticeably louder, consistent with higher fan activity. Unfortunately, due to limitations in our current equipment, we were unable to directly measure the power consumption of the fans.
Conclusion
This study demonstrates how a modern, right-sized 32-core x64 server behaves under realistic 100 GbE network workloads, highlighting both its strengths and its limitations. Single-core performance is solid but clearly optimized for balanced scalability rather than peak per-core throughput, while multicore scaling proves sufficient to saturate a 100 GbE link with 8 parallel streams—albeit with predictable diminishing returns as shared resources become contested.
From a computational efficiency standpoint, it's advantageous to use fewer, higher-performing cores, as per-core throughput declines steadily with increasing parallelism due to contention for shared resources and thermal headroom.
Conversely, from an energy efficiency perspective, the system benefits from higher core counts and increased parallelism: overall system power efficiency improves substantially as workload concurrency grows, even as marginal throughput gains diminish. These opposing trends—declining computational efficiency per core versus improving energy efficiency at the system level—work directly against each other and create a fundamental trade-off in server sizing and deployment strategy.
The saturated performance tests further reveal how undocumented hardware constraints, such as internal NIC switching limits, can cap achievable throughput while still driving significant CPU and system power consumption. In such scenarios, wasted CPU cycles directly translate into reduced efficiency and higher operational cost.
Taken together, these results validate the testing methodology presented in the previous article and provide realistic expectations for both throughput and power consumption. More importantly, they underscore the need for system-level evaluation when designing network-intensive platforms. Optimal system sizing must carefully balance computational efficiency, energy cost, rack space constraints, and long-term investment protection.