Every millisecond of GPU latency is a drain on your enterprise AI budget. While vLLM has become the industry standard for high-throughput serving, the sequential nature of LLM decoding often leaves expensive hardware drastically under-utilized.
Within the open source community, speculative decoding has emerged as a powerful solution to the "sequential bottleneck". By running a small, fast draft model to propose tokens ahead of time, and verifying them in a single pass with the target model, you can significantly increase throughput without altering a model's output quality.
Among the available speculative decoding methods, I chose Eagle3 because it reuses the target model's internal features through a lightweight draft head rather than requiring a separately trained draft model, and it is natively supported in vLLM. Prior work has generally characterized speculative decoding as a low-concurrency optimization. In this post, I demonstrate that this characterization does not hold for all model architectures: Benchmarking gpt-oss-120B (a mixture-of-experts model) with Eagle3 speculative decoding on vLLM, I observed consistent throughput and latency improvements that persist with up to 200 concurrent requests.
Why it matters: 19% cost savings at scale
In enterprise AI, performance is money. Using vLLM, I found that speculative decoding reduces the cost per 1M output tokens by 19.4% on code-heavy workloads (using SWE-bench).
At Red Hat, we are integrating these upstream innovations into Red Hat AI Inference Server, providing an enterprise-ready distribution of vLLM optimized for the hybrid cloud.
We measure throughput, latency, and time-to-first-token across varying concurrency levels, datasets, tensor-parallelism settings, and draft-token budgets, all evaluated on real-world datasets rather than synthetic benchmarks, so the results reflect the workload diversity and token distributions that production systems actually encounter.
I set out to answer three questions:
- Does speculative decoding consistently improve serving metrics across diverse workloads (conversational, enterprise summarization, and code-generation) and tensor-parallelism configurations?
- How does the number of draft tokens affect the acceptance-rate and performance tradeoff?
- How do throughput improvements translate into real dollar savings on production GPU infrastructure?
Experimental setup
The vLLM server configurations for enabling Eagle3 speculative decoding were adapted from the official vLLM Recipes for GPT-OSS.
- Inference server: vLLM v0.13.0
- Benchmarking tool: GuideLLM v0.5.3
- Target model: openai/gpt-oss-120b (MoE, MXFP4 quantized)
- Draft model: nvidia/gpt-oss-120b-Eagle3-v2 (Eagle3 method)
- Hardware: NVIDIA H200-PCIe-141GB GPU
- Tensor parallelism: TP=1 and TP=2
Note
The Red Hat Speculator Eagle3 draft model was not available at the time of this investigation. It is now available on Hugging Face and can be used instead of the NVIDIA draft model.
I used three real-world datasets:
- ShareGPT: Sourced from ShareGPT on HuggingFace. Prompts are variable in length and representative of multi-turn chat (mean 122, median 72 input tokens).
- MLPerf: The GPT-OSS benchmark dataset from MLPerf Inference. Prompts are substantially longer, representative of enterprise summarization and analysis tasks (mean 5011, median 4593 input tokens).
- SWE-bench: Sourced from SWE-bench on HuggingFace. Contains real GitHub issues from popular Python repositories with code snippets, representing code-heavy workloads (mean 556, median 355 input tokens).
For each dataset, I selected 600 unique prompts, pre-shuffled and split into 6 non-overlapping sets of 100 prompts. Each set was assigned to a specific concurrency level (1, 5, 25, 50, 100, 200) to ensure no prompt overlap across test configurations. Prefix caching was enabled by default in vLLM, and remains on in all configurations. "Baseline" refers to the default vLLM serving configuration with prefix caching enabled and no speculative decoding.
- Baseline configuration: No speculative decoding and no draft tokens.
- Speculative decoding configuration: Eagle3 with 3 draft tokens.
Metrics
The per-concurrency graphs show raw measured values at each concurrency level. For the summary tables, I'm computing the geometric mean across the six concurrency levels to provide a single aggregate number that's robust to outliers and scale differences.
Higher is better:
- Output throughput: Generated tokens per second
- Total throughput: Prompt + output tokens per second
Lower is better:
- TTFT P95: 95th-percentile time to first token in seconds
- ITL P95: 95th-percentile inter-token latency in milliseconds
- TPOT P95: 95th-percentile time per output token in milliseconds
- Request Latency Median: Median end-to-end latency in seconds
Benchmarking on ShareGPT: Speculative decoding versus baseline
I begin with the ShareGPT dataset, a collection of real multi-turn chat conversations with short, highly variable prompts (median 72 input tokens). This workload is decode-heavy, making it an ideal first test for speculative decoding.
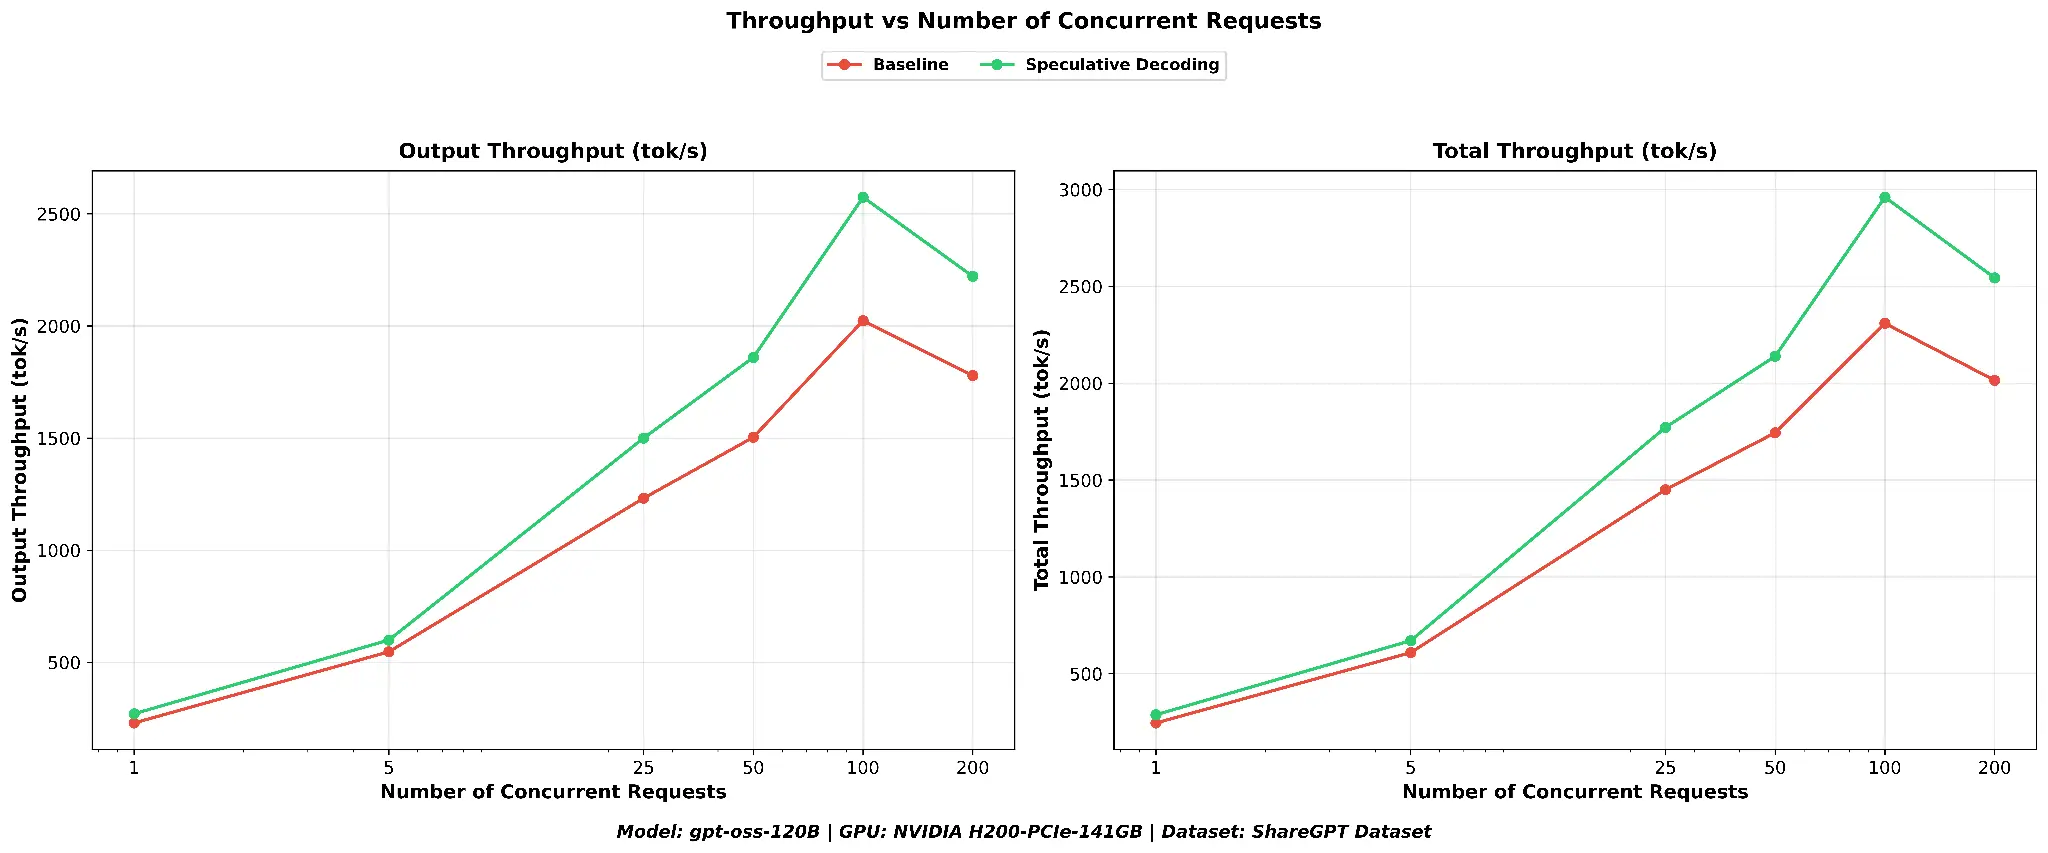
Throughput
As shown in Figure 1, speculative decoding consistently produces higher output throughput across all concurrency levels. The peak output throughput for speculative decoding reaches 2574 tok/s compared to the baseline's 2024 tok/s, a 27.2% peak improvement. Total throughput (including prompt processing) follows the same pattern.
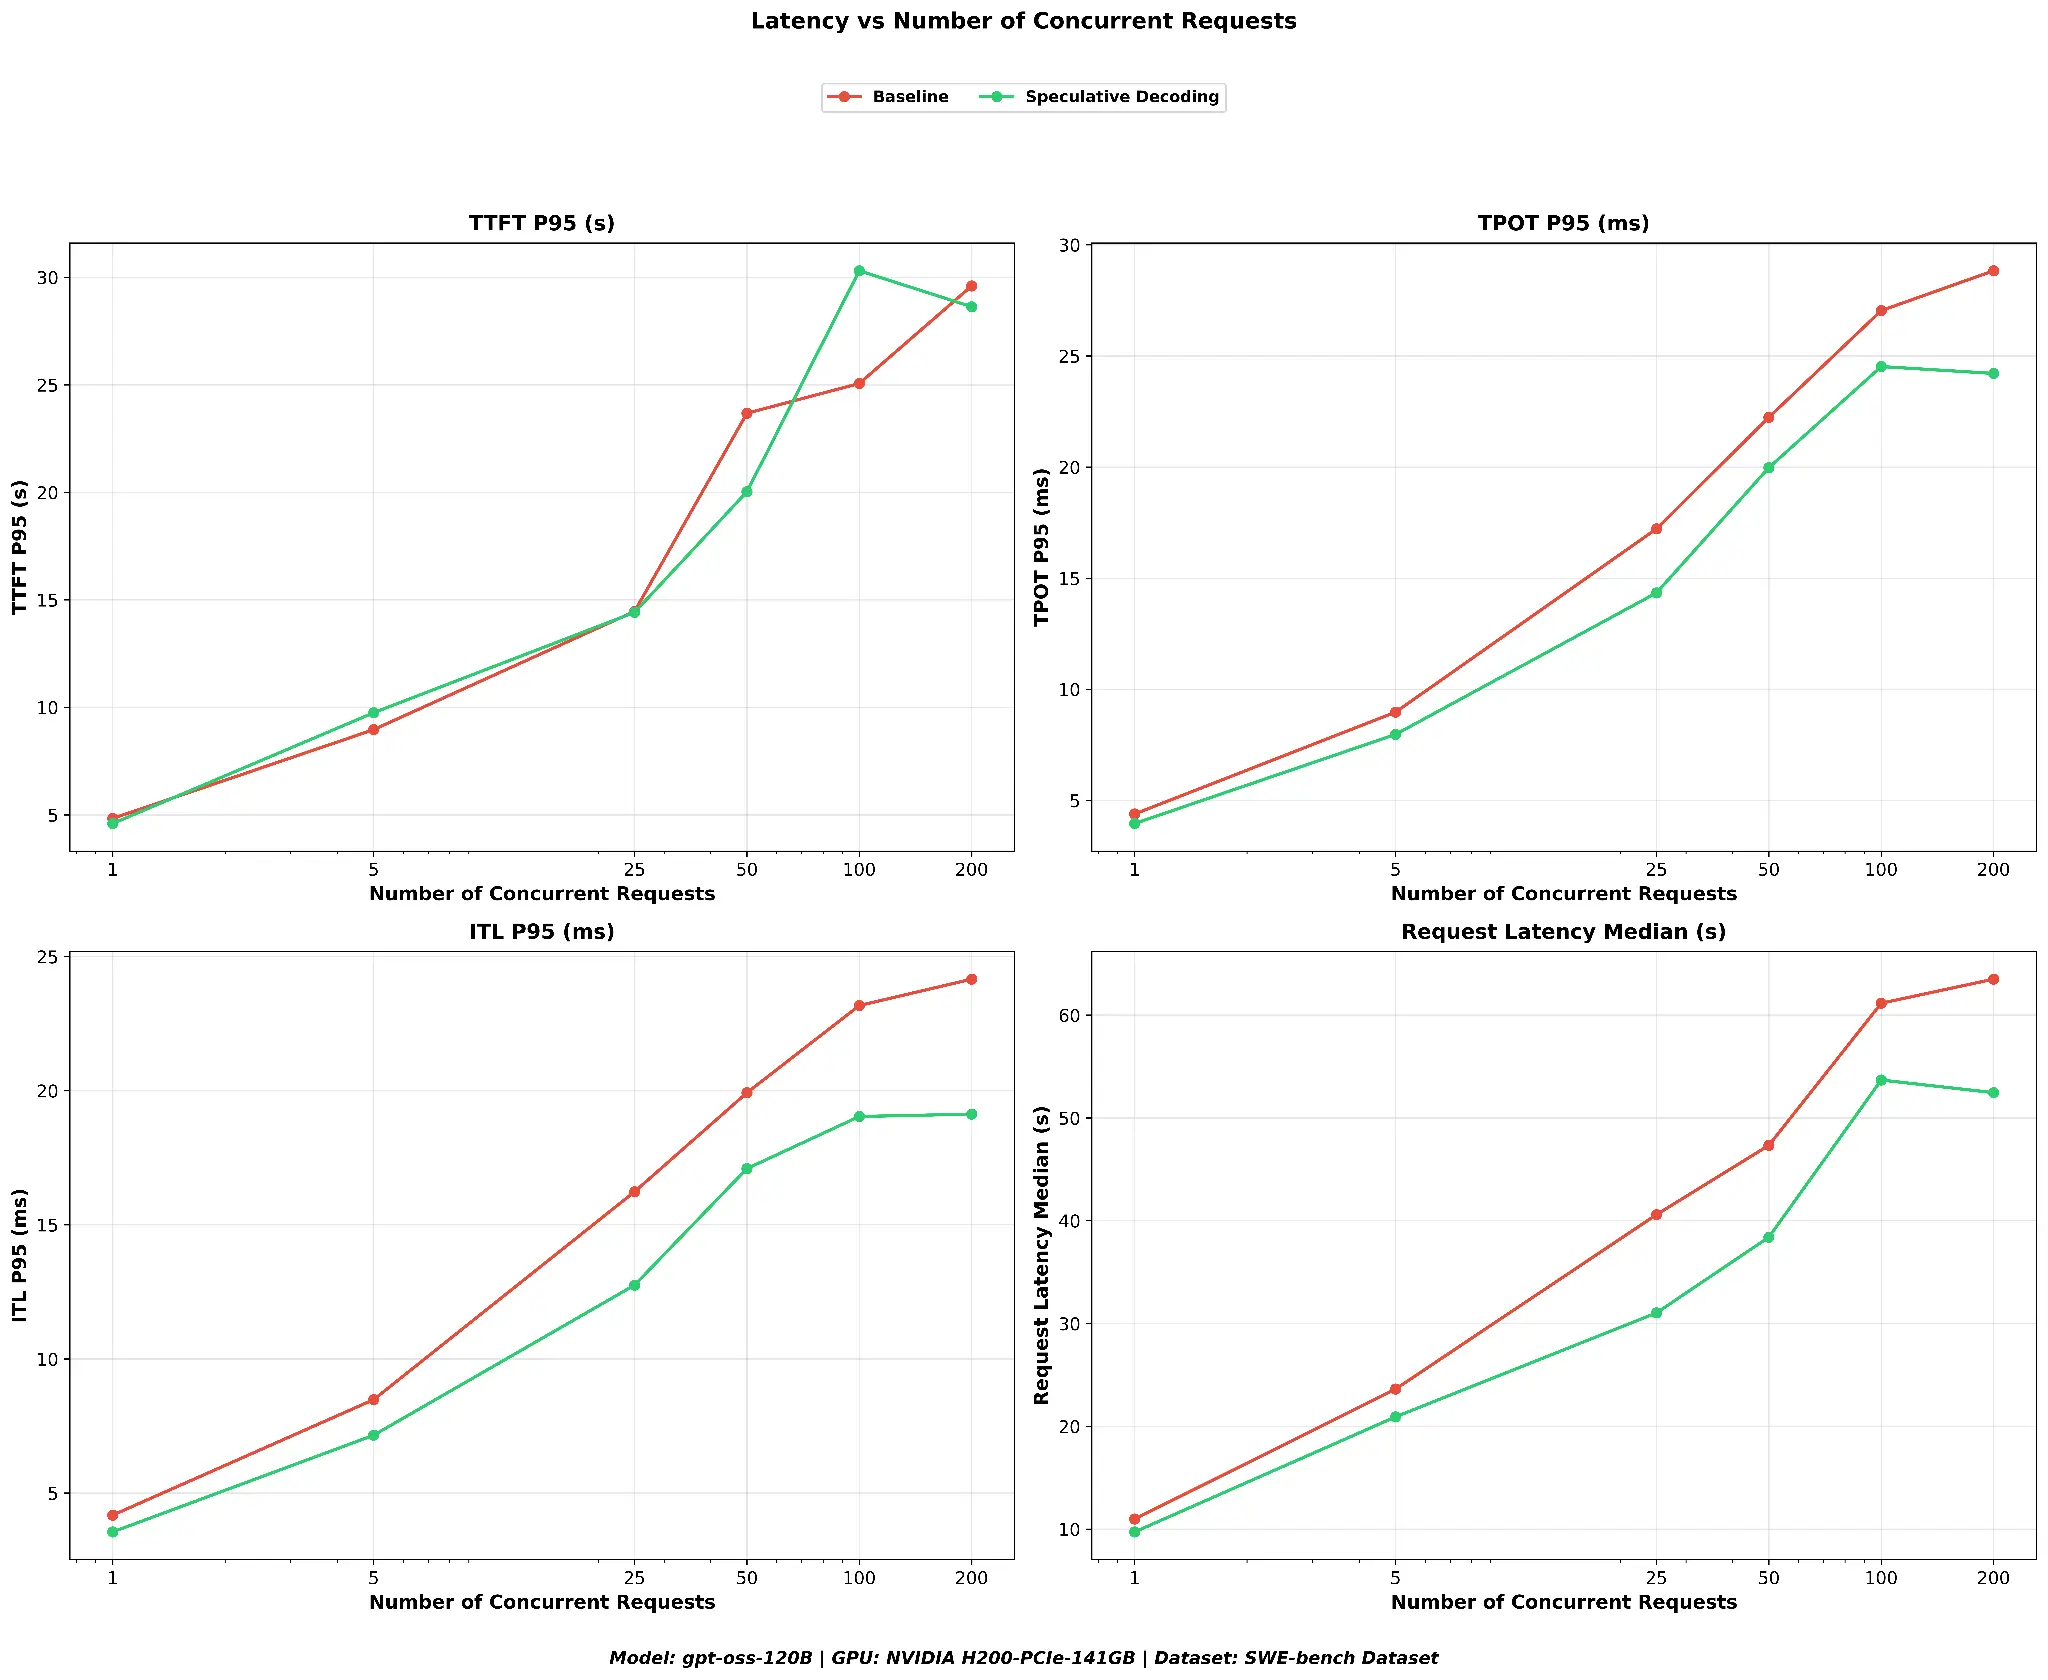
TTFT and request latency
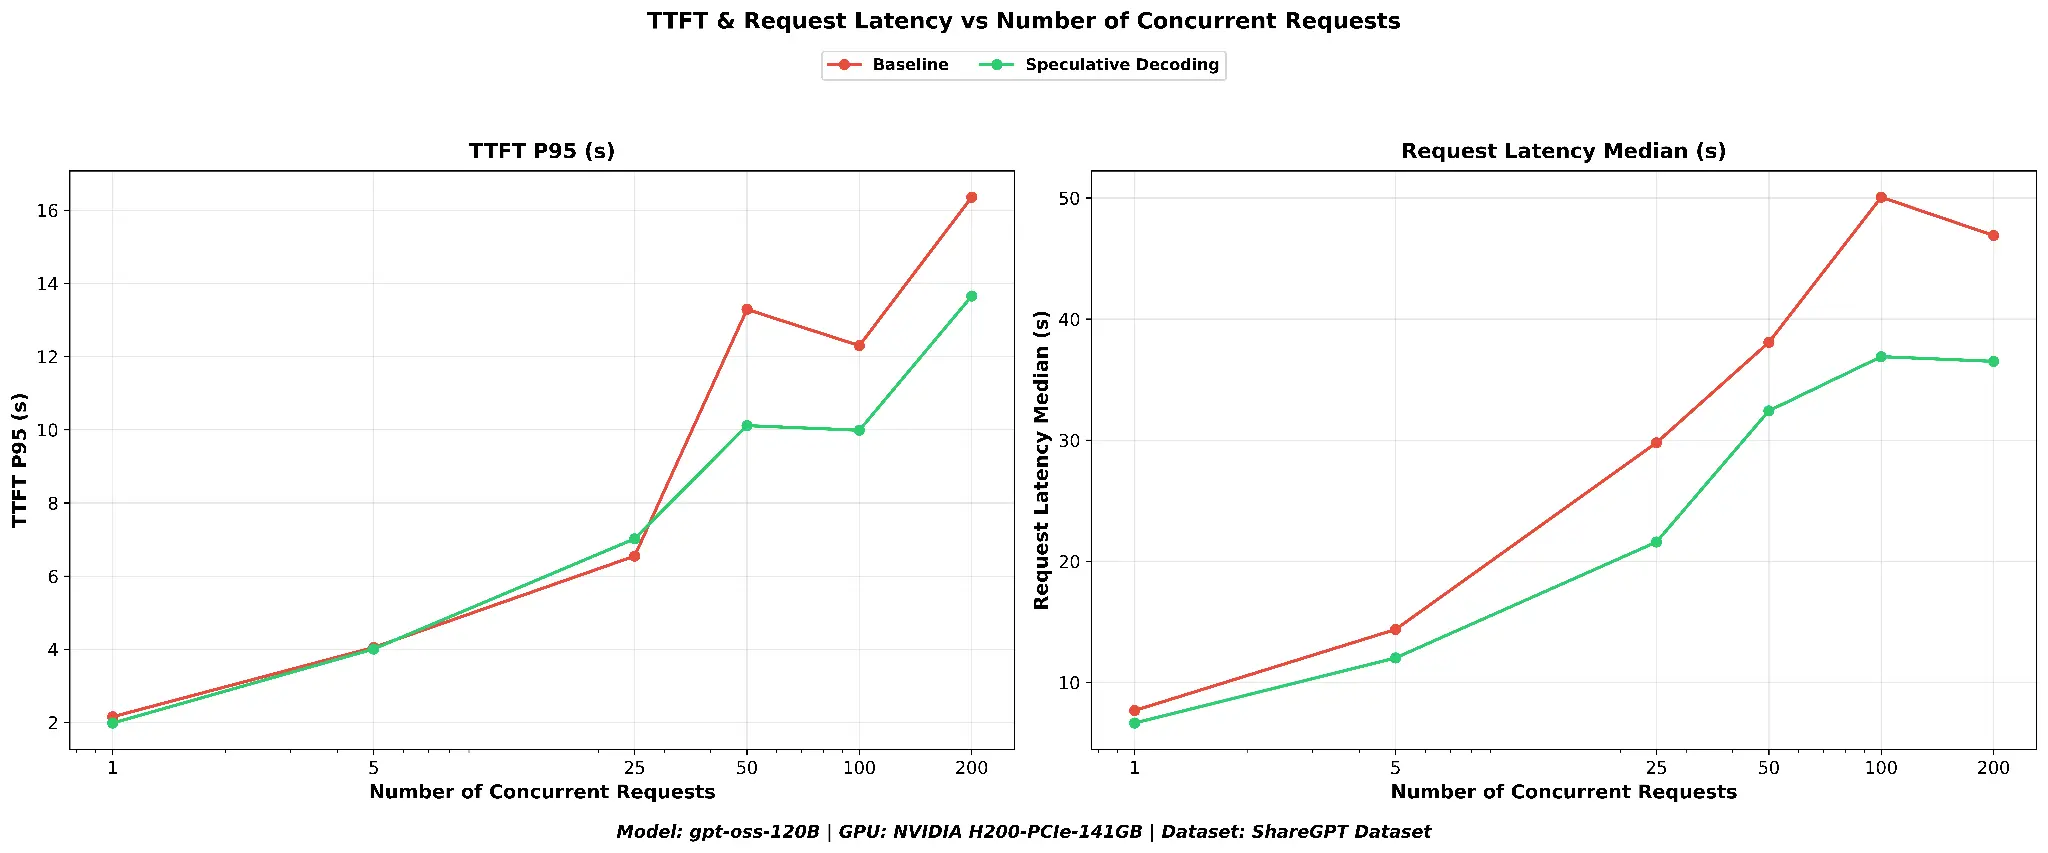
As shown in Figure 2, time to first token is reduced with speculative decoding, and the benefit becomes more pronounced as concurrency increases. At concurrency 100, speculative decoding achieves a TTFT P95 of ~10.0s versus 12.3s for the baseline, a 18.7% reduction, and the gap persists at concurrency 200 (~13.7s versus ~16.4s). End-to-end request latency is reduced across the board with speculative decoding, with the greatest savings at higher concurrency.
ITL and TPOT
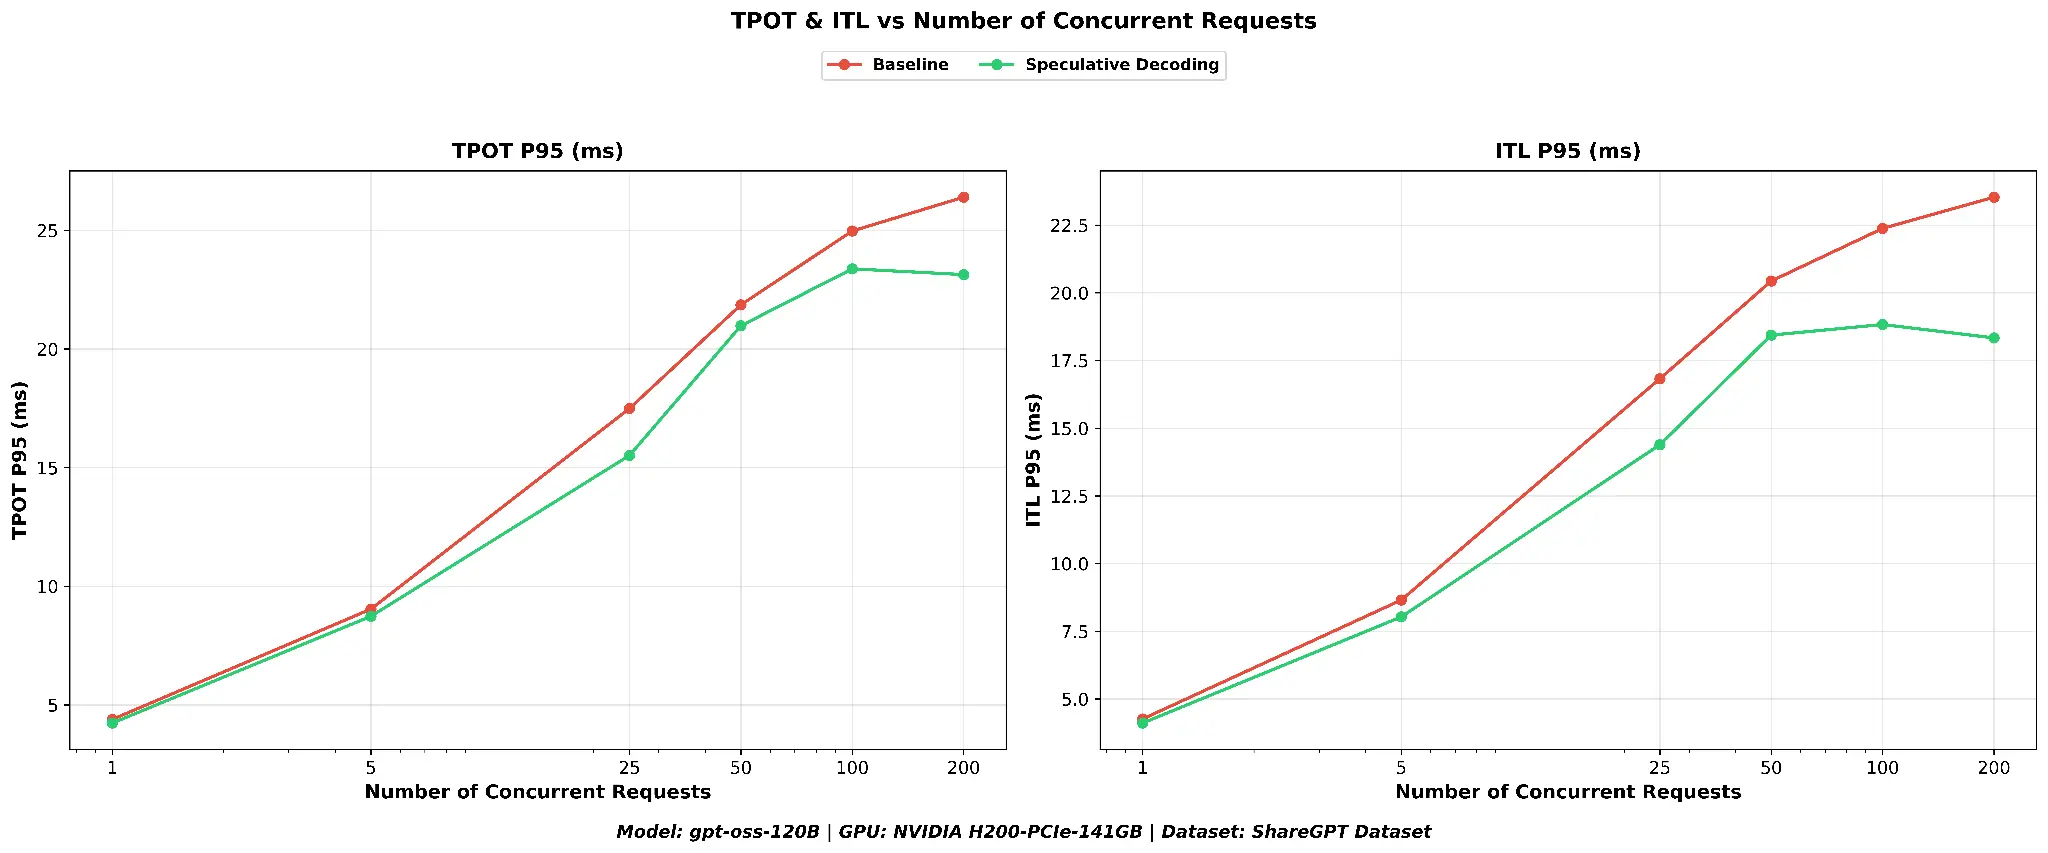
As shown in Figure 3, inter-token latency and time per output token at P95 are consistently lower with speculative decoding across all concurrency levels, indicating smoother token streaming for users. The TPOT improvement (+6.9%) is smaller than the ITL improvement (+12.4%) because TPOT measures the average time per token across the entire response, including the first token, while ITL captures only the inter-token gaps during streaming, where speculative decoding's batch verification has the most direct impact.
Geometric mean summary
The table below shows the geometric mean of each metric across all six concurrency levels, and the percentage improvement relative to the baseline.
| Metric | Baseline | Speculative decoding | Speculative decoding versus baseline |
|---|---|---|---|
| Output throughput (tok/s) | 970.9 | 1171.7 | +20.7% |
| Total throughput (tok/s) | 1098.7 | 1329.0 | +21% |
| TTFT P95 (s) | 7.31 | 6.52 | +10.8% |
| TPOT P95 (ms) | 14.68 | 13.66 | +6.9% |
| ITL P95 (ms) | 13.7 | 12.0 | +12.4% |
| Request latency median (s) | 25.8 | 20.6 | +20.3% |
On the ShareGPT dataset, speculative decoding delivers a ~21% throughput improvement and ~20% latency reduction. TTFT P95 improves by 10.8% and ITL P95 by 12.4%, confirming that the gains span both the prefill and decode phases.
Tuning the draft token count: How many speculative tokens?
A natural question is: Should we propose more draft tokens per step?
I tested three configurations using the ShareGPT dataset with speculative decoding enabled, varying only the num_speculative_tokens parameter.
Draft acceptance rate analysis
I extracted speculative decoding metrics from the vLLM server logs during each benchmark run.
| Draft tokens | Average acceptance rate | Mean acceptance length |
|---|---|---|
| 2 | 45.4% | 1.91 |
| 3 | 35.6% | 2.07 |
| 4 | 28.3% | 2.13 |
The acceptance rate drops steadily with more draft tokens, from 45.4% at 2 drafts to 35.6% at 3 and 28.3% at 4. With 2 draft tokens nearly half of all speculative batches are fully accepted, while at 4 drafts fewer than a third are.
The mean acceptance length tells a nuanced story: 2 draft tokens achieves 1.91, showing that most proposals are accepted. 3 draft tokens achieves 2.07, extracting slightly more tokens per step despite a lower acceptance rate. 4 draft tokens achieves a slightly higher mean acceptance length (2.13) than 3, meaning the occasional extra accepted token compensates for the extra draft.
Performance comparison
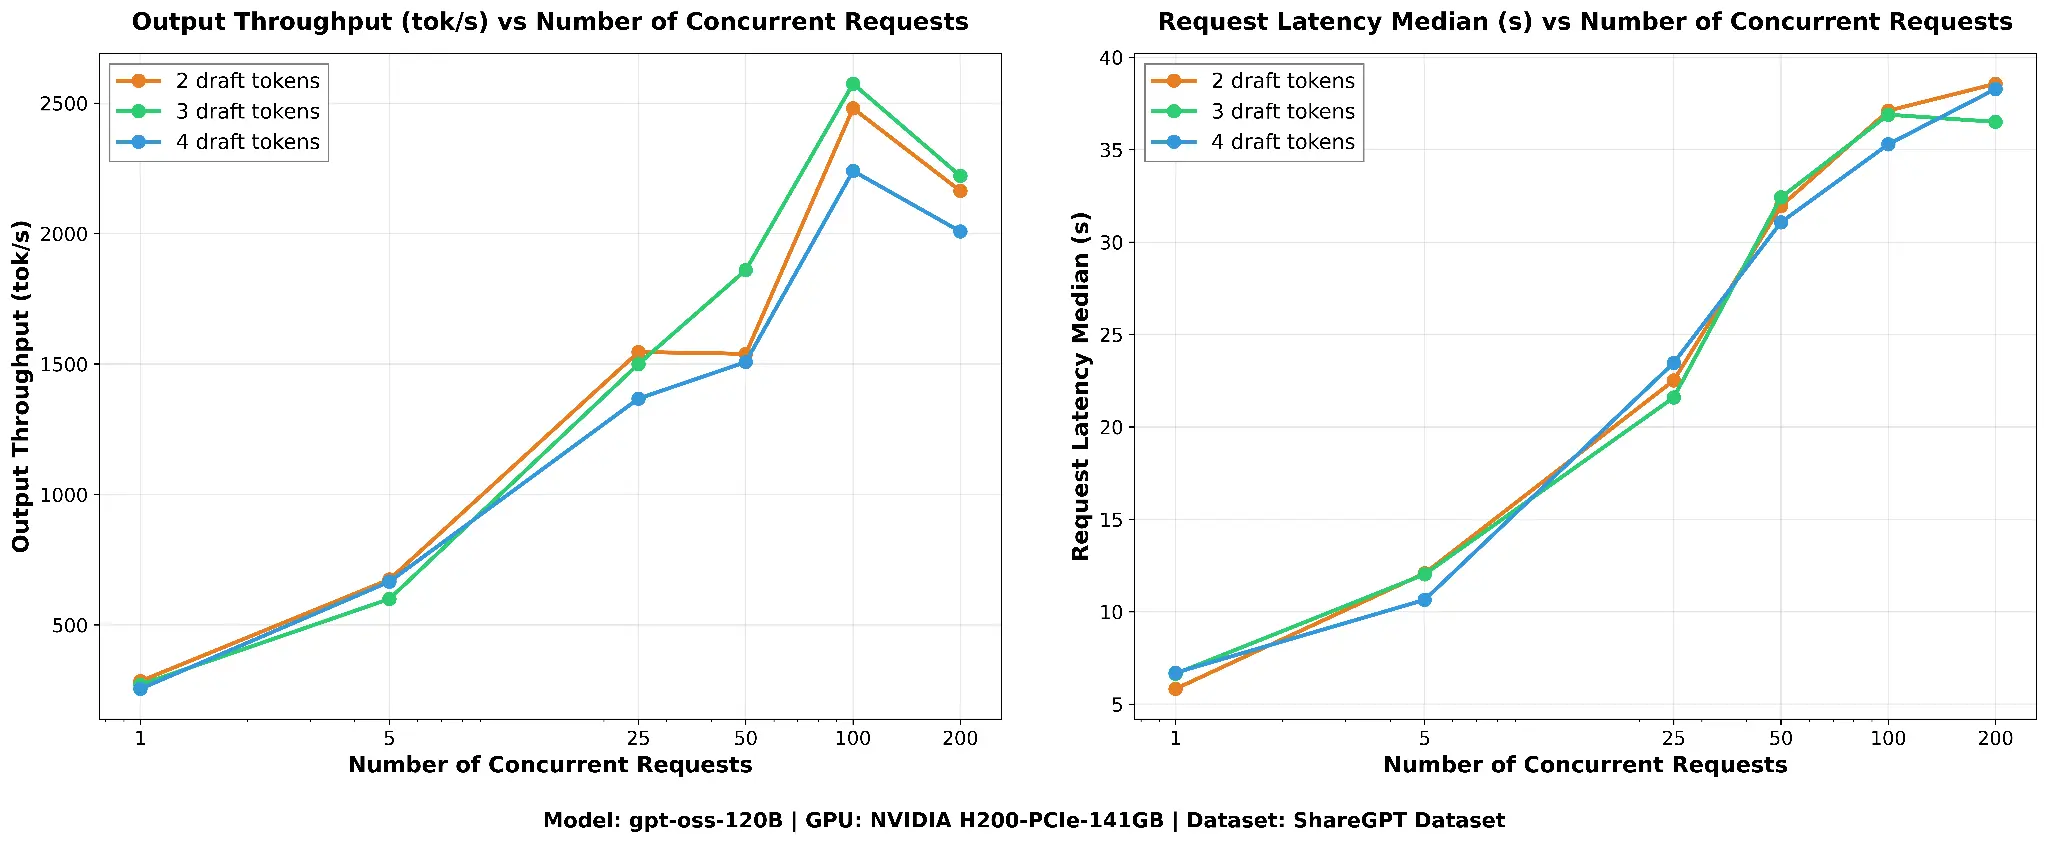
As shown in Figure 4, peak output throughput is 2574 tok/s for 3-draft, 2480 tok/s for 2-draft (within 4%), and 2240 tok/s for 4-draft (13% lower). Median request latency is comparable across all three.
Geometric mean summary
The 2-draft and 3-draft configurations perform nearly identically on throughput, with the 3-draft performing better at higher number of concurrent requests, while 2-draft delivers slightly better latency metrics 3.6% lower TTFT and 3.3% lower ITL thanks to its higher acceptance rate (45.4% versus 35.6%) and lighter verification overhead. Going from 3 to 4 draft tokens causes a modest 8% output throughput drop and a 7.6% ITL regression, with no meaningful improvement in any metric. The lower acceptance rate at 4 drafts (28.3%) means the additional draft token is rejected more often than not, adding verification overhead without a commensurate throughput gain. We have hence chosen 3 draft tokens for all our speculative decoding runs, as production workloads typically operate at higher concurrency where the 3-draft configuration excels.
| Metric | 2 draft | 3 draft | 4 draft | 3 versus 2 | 4 versus 3 |
|---|---|---|---|---|---|
| Output throughput (tok/s) | 1160.6 | 1171.7 | 1078.4 | +1.0% | -8.0% |
| Total throughput (tok/s) | 1315.3 | 1329.0 | 1228.1 | +1.0% | -7.6% |
| TTFT P95 (s) | 6.29 | 6.52 | 6.70 | -3.6% | -2.7% |
| ITL P95 (ms) | 11.6 | 12.0 | 12.9 | -3.3% | -7.6% |
| Request latency median (s) | 20.4 | 20.6 | 20.3 | -0.6% | +1.2% |
Validating on MLPerf: Cross-dataset and cross-TP confirmation
To validate that these findings are not dataset-specific, I repeated the comparison on the MLPerf dataset across six concurrency levels at both TP=1 and TP=2. The per-concurrency trends mirror what I observed on ShareGPT: Speculative decoding configuration consistently delivers higher throughput, lower inter-token latency, and reduced request latency.
Rather than repeating the metric-by-metric breakdown, I present the geometric mean summaries below. The key difference from ShareGPT is in magnitude: MLPerf's substantially longer prompts (~5,011 tokens avg versus ~122 for ShareGPT) shift a larger fraction of total serving time into the prefill phase, where speculative decoding has no effect. This compresses the relative throughput gains compared to the decode-heavy ShareGPT workload, but the improvements remain meaningful and consistent at both tensor-parallelism settings.
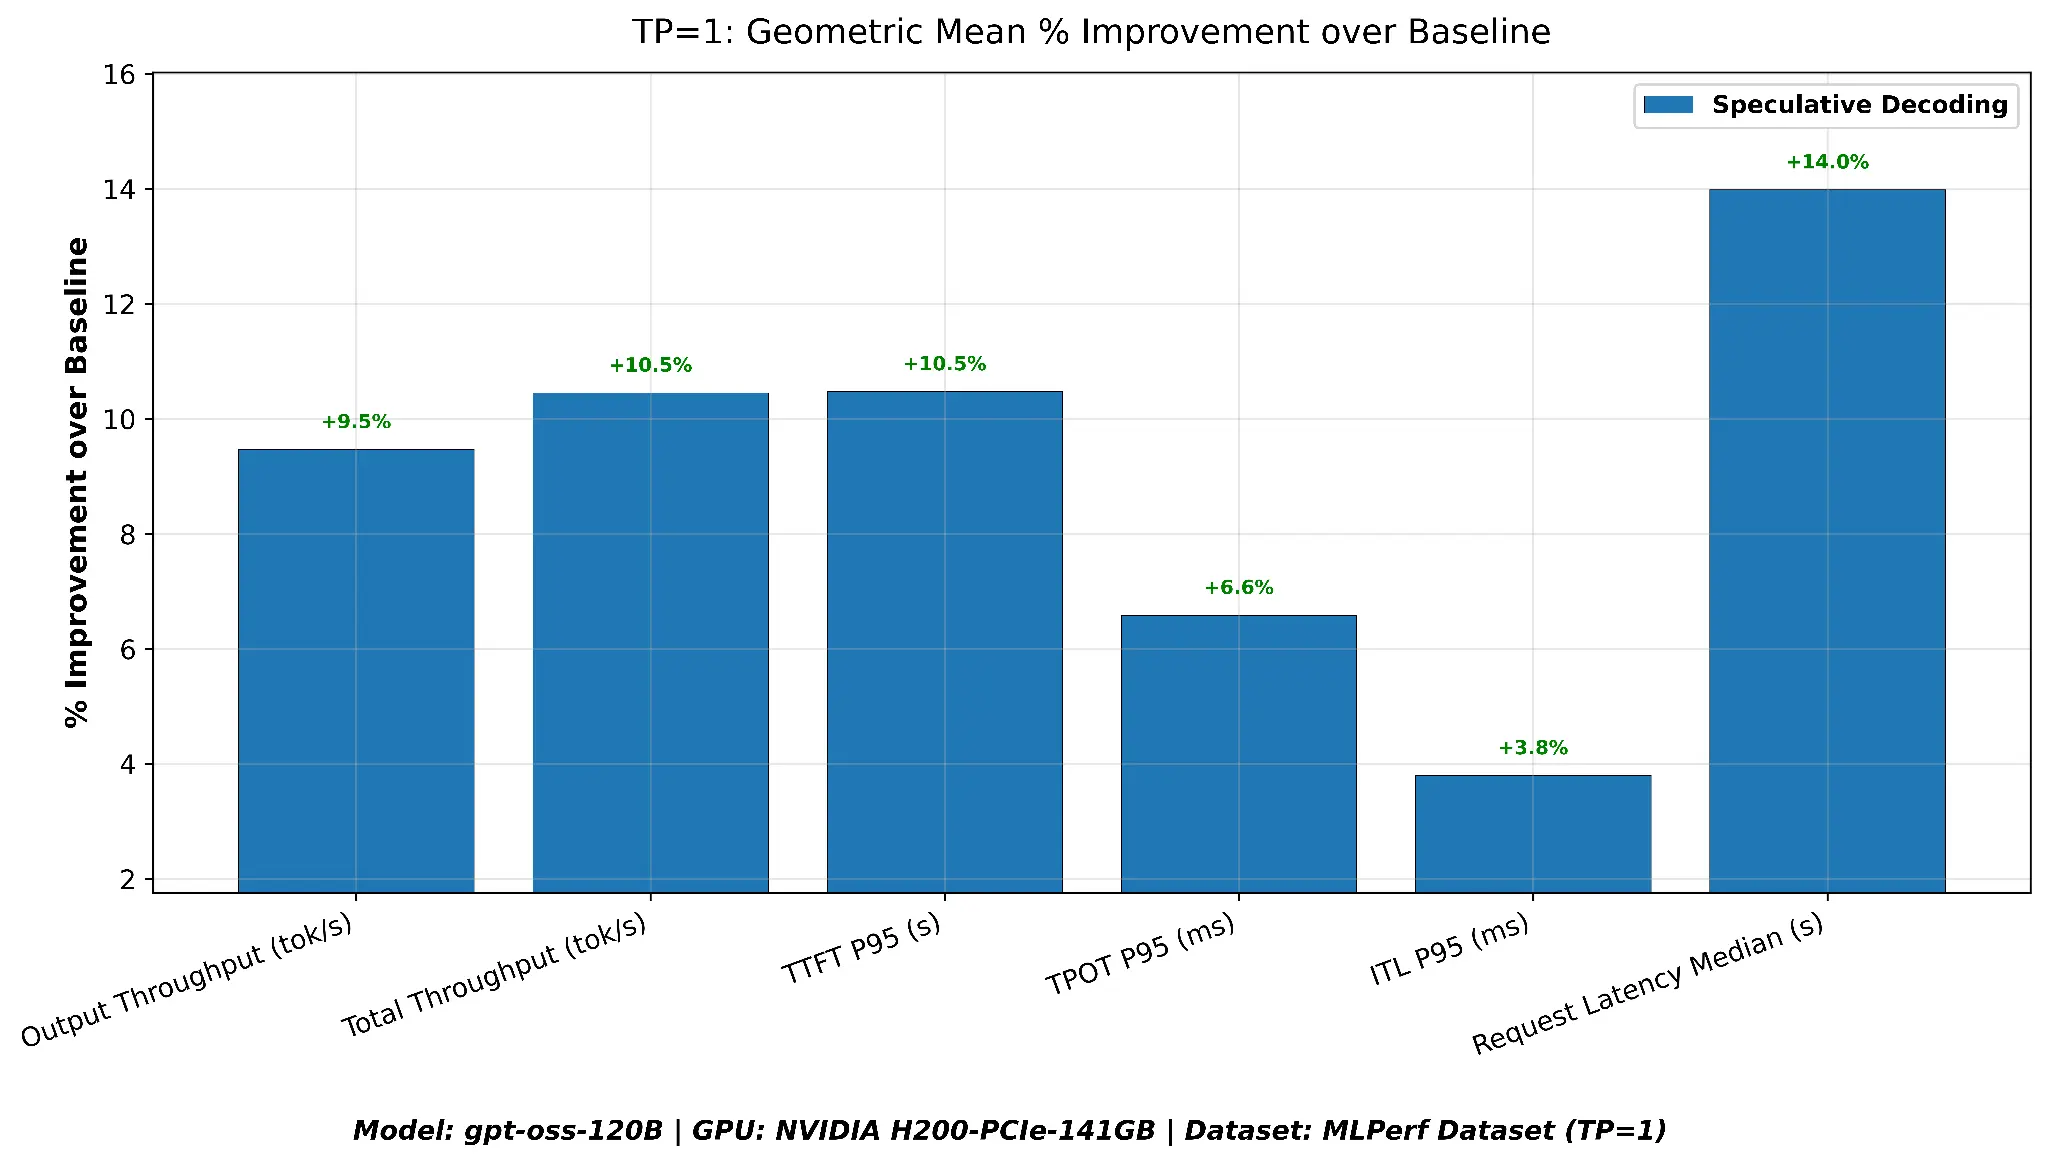
TP=1 geometric mean summary
| Metric | Baseline | Speculative decoding | Speculative decoding versus baseline |
|---|---|---|---|
| Output throughput (tok/s) | 1051.0 | 1150.5 | +9.5% |
| Total throughput (tok/s) | 4652.1 | 5138.3 | +10.5% |
| TTFT P95 (s) | 10.17 | 9.10 | +10.5% |
| ITL P95 (ms) | 16.5 | 15.9 | +6.6% |
| TPOT P95 (ms) | 21.1 | 19.7 | +3.8% |
| Request latency median (s) | 26.6 | 22.9 | +14.0% |
As shown in Figure 5, with a single GPU, speculative decoding improves every metric. Output throughput improves by 9.5%, TTFT P95 drops by 10.5%, and median request latency is reduced by 14.0%. Peak output throughput is close between the two configurations (speculative decoding: 2,418 tok/s versus baseline: 2,328 tok/s) because both saturate the single GPU at high concurrency, the geometric mean advantage comes from speculative decoding reaching near-peak throughput at lower concurrency levels where the baseline lags.
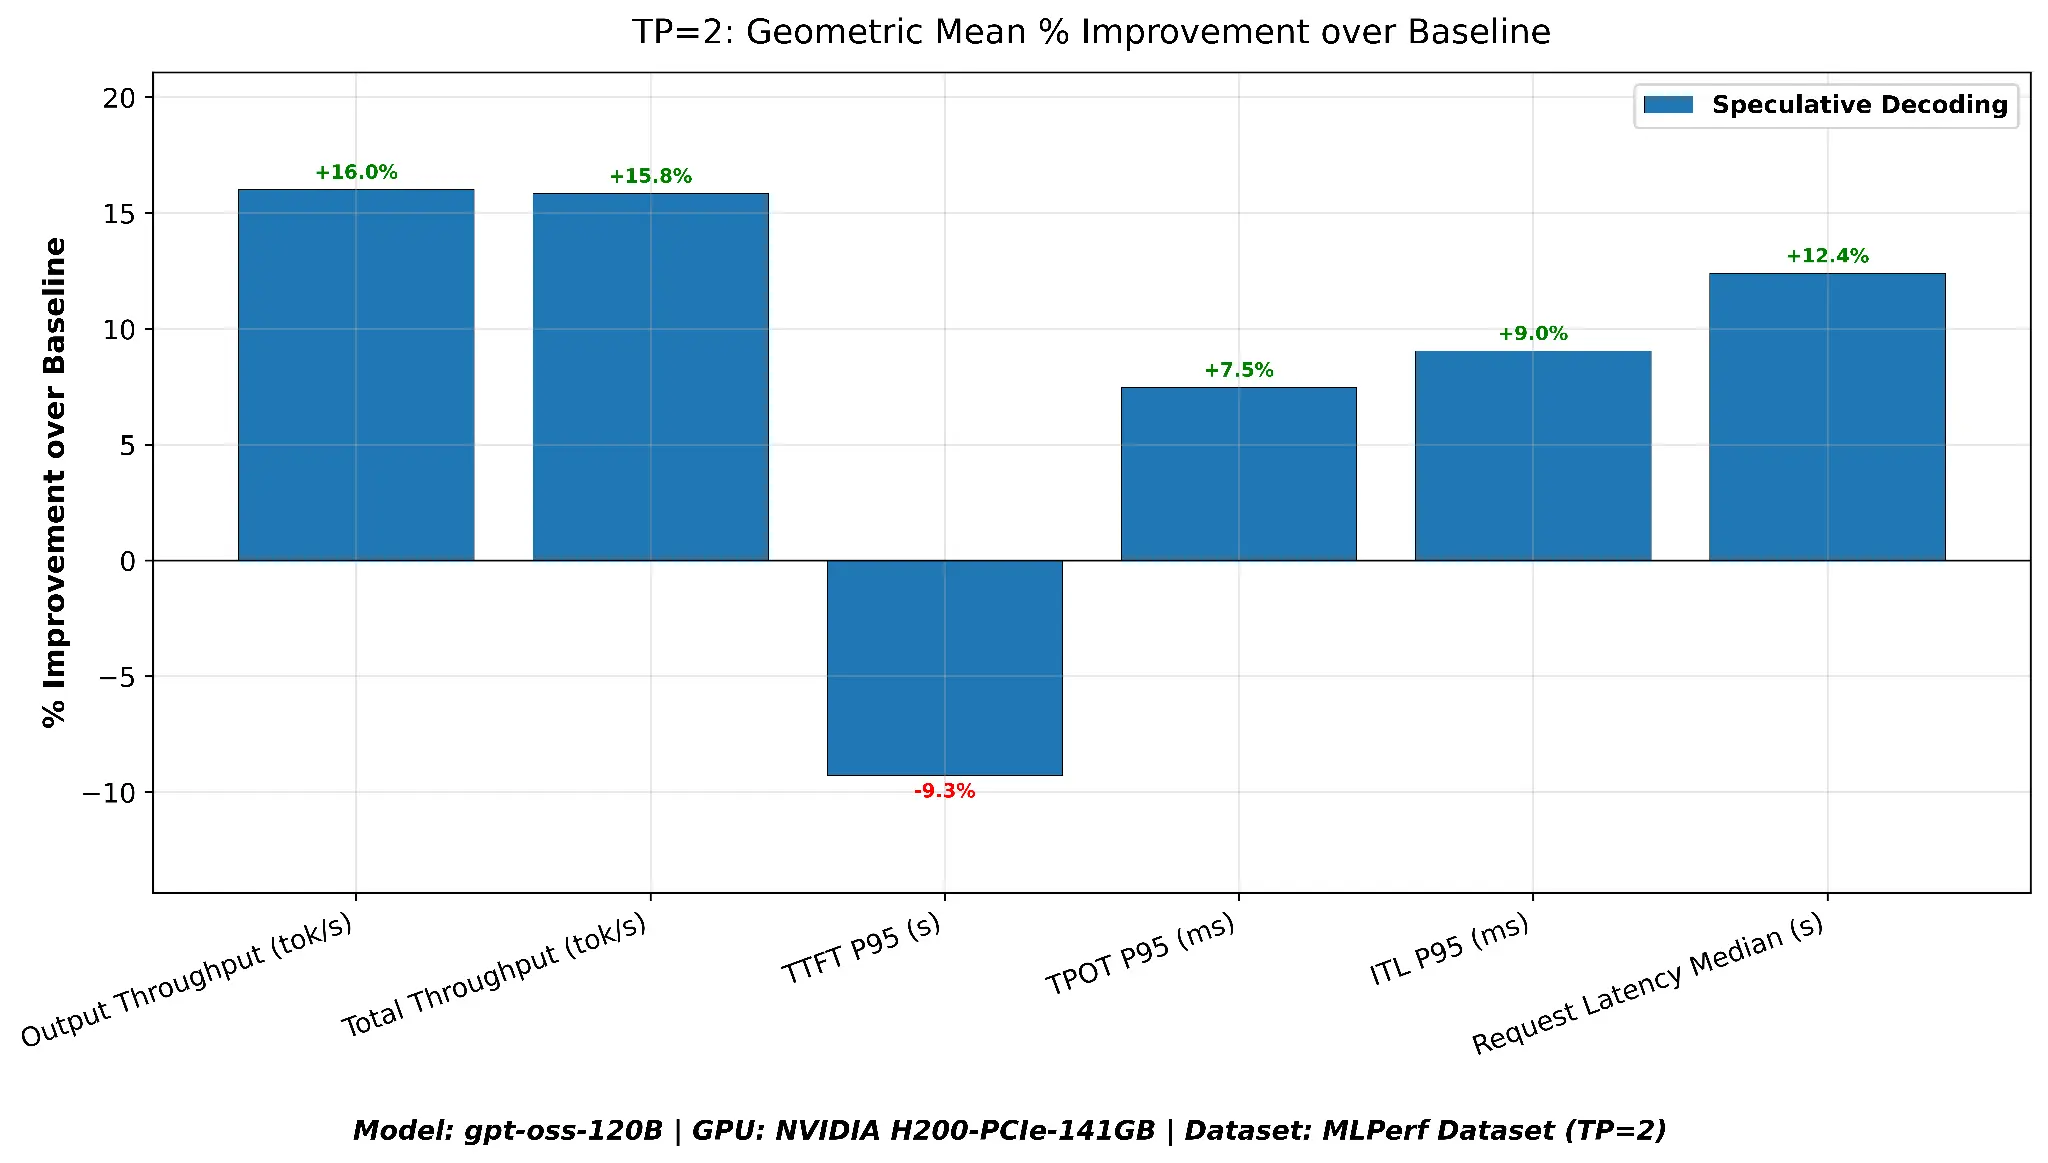
TP=2 geometric mean summary
| Metric | Baseline | Speculative decoding | Speculative decoding versus baseline |
|---|---|---|---|
| Output throughput (tok/s) | 1500.6 | 1740.8 | +16% |
| Total throughput (tok/s) | 6684.5 | 7743.6 | +15.8% |
| TTFT P95 (s) | 6.18 | 6.75 | +9.3% |
| ITL P95 (ms) | 11.2 | 10.2 | +9.0% |
| TPOT P95 (ms) | 13.9 | 12.9 | +7.5% |
| Request latency median (s) | 17.3 | 15.2 | +12.4% |
As shown in Figure 6, with two GPUs, absolute throughput roughly doubles compared to TP=1, and speculative decoding delivers even stronger throughput gains, output throughput improves by 16.0% and median latency is reduced by 12.4%. The one exception is TTFT P95, which regresses by 9.3% when speculative decoding is enabled at TP=2. This is because the draft model's additional compute during the prefill phase competes with the target model for GPU resources that are already better utilized at TP=2. Despite the TTFT regression, speculative decoding delivers the best throughput and ITL across the board at TP=2, making it the recommended configuration when overall serving efficiency is the priority.
Coding workloads: SWE-bench validation
To test whether the gains extend to code-heavy workloads, I ran a 2-way comparison (baseline versus speculative decoding) on the SWE-bench dataset at TP=1. SWE-bench consists of 2,294 real GitHub issues from popular Python repositories, prompts that contain code snippets, tracebacks, and technical descriptions, representing a very different token distribution than conversational or summarization tasks.
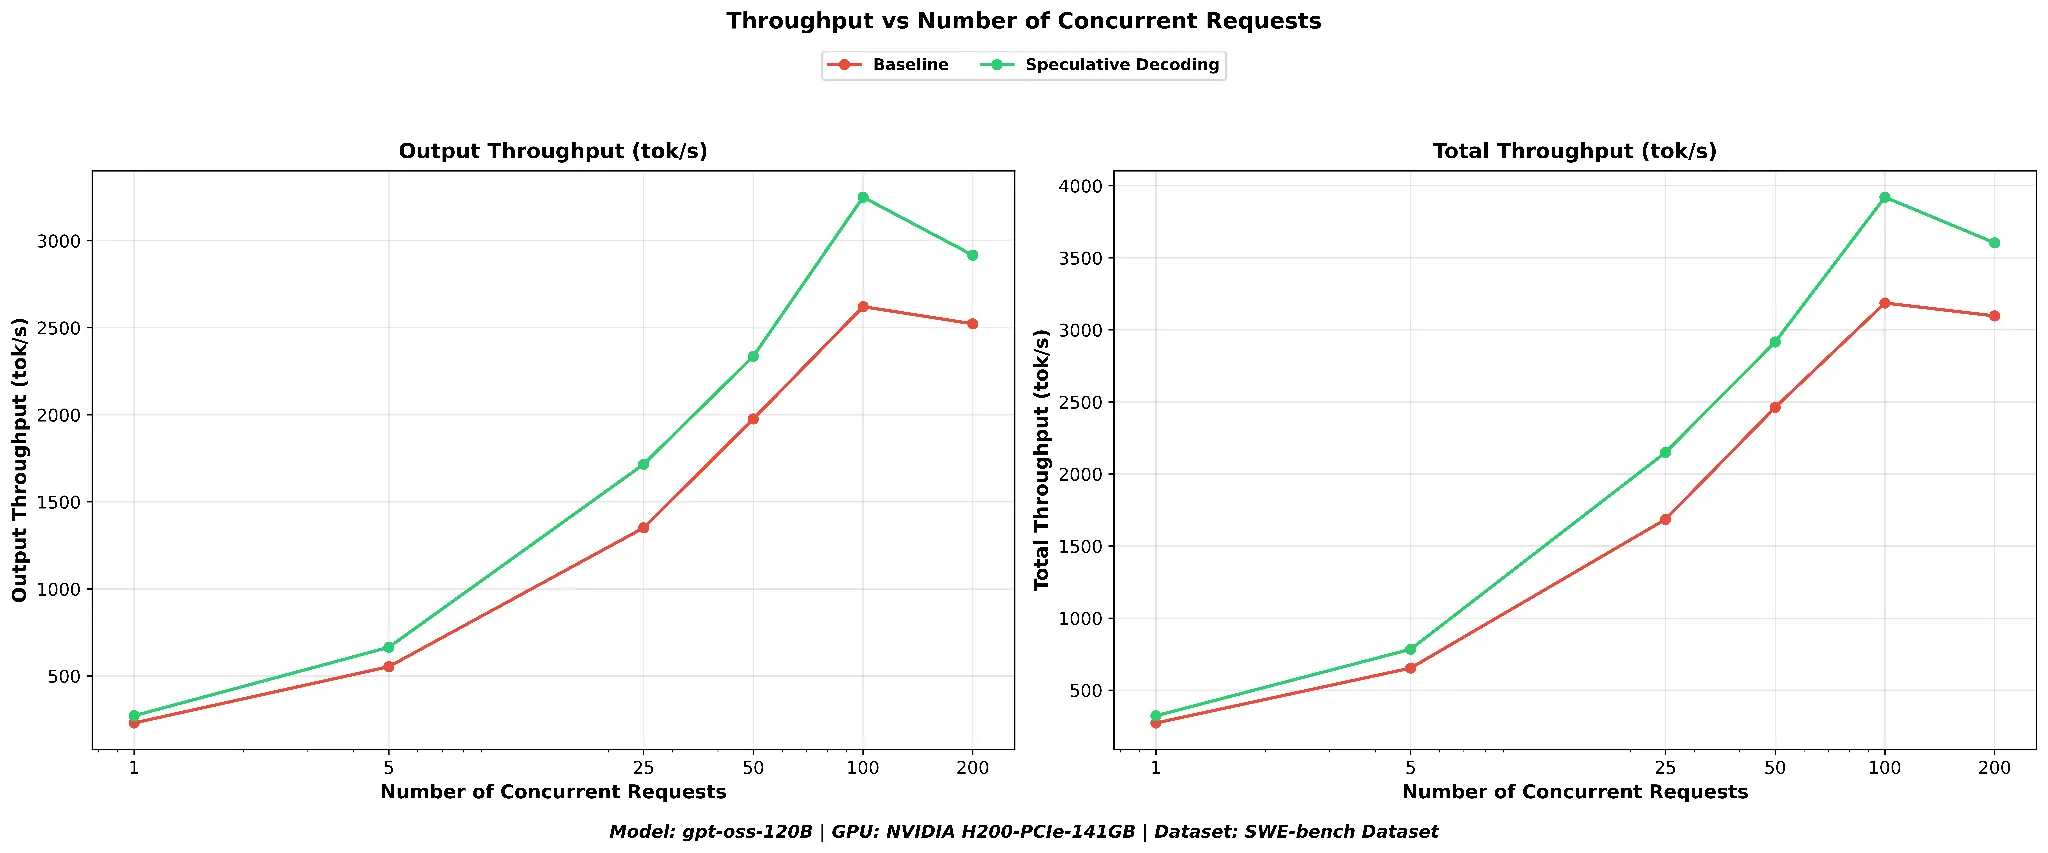
Speculative decoding delivers a substantial throughput advantage on SWE-bench. At concurrency 100, speculative decoding reaches a peak output throughput of ~3,250 output tok/s compared to ~2,621 for the baseline, a 24% improvement. Total throughput follows the same pattern (see Figure 7).
Inter-token latency (ITL P95) is consistently lower with speculative decoding across all concurrency levels. TTFT P95 is essentially unchanged between the two configurations, which is expected: SWE-bench prompts are long and unique (GitHub issues), so prefix cache hit rates are low and the prefill phase is unaffected. Request latency median shows meaningful reductions at all concurrency levels. At concurrency 200, the median drops from ~63.5 s to ~52.5 s, a 17% improvement (see Figure 8).
Geometric mean summary
| Metric | Baseline | Speculative decoding | Speculative decoding versus baseline |
|---|---|---|---|
| Output throughput (tok/s) | 1143.87 | 1377.94 | +20.5% |
| Total throughput (tok/s) | 1391.89 | 1678.17 | +20.6% |
| TTFT P95 (s) | 14.92 | 14.97 | -0.3% |
| ITL P95 (ms) | 13.63 | 11.24 | +17.5% |
| TPOT P95 (ms) | 15.08 | 13.24 | +12.2% |
| Request latency median (s) | 35.30 | 29.68 | +15.9% |
Across the geometric mean of all concurrency levels, speculative decoding delivers a 20.5% output throughput improvement and 15.9% request latency reduction on the SWE-bench coding dataset.
The negligible TTFT change (-0.3%) confirms that the gains come from the decode phase, not prefill, consistent with the fact that code-heavy prompts are long and unique, limiting prefix cache reuse.
The strong ITL improvement (+17.5%) shows that speculative decoding effectively accelerates token generation even on code-heavy workloads with distinct token distributions.
Cost implications for production deployments
Throughput improvements translate directly into serving cost reductions. To quantify this, I compute the cost per 1M output tokens using the measured throughput and the hourly GPU cost:
Cost per 1M Output = (1,000,000 / OutputTokens/sec) × (GPUCost/Hour / 3600)
I use the peak throughput (at concurrency 100) for each configuration, because this represents the server running at maximum utilization (the operating point that minimizes cost per token). I'm pricing a dedicated H200 instance at $41.62/hr (the on-demand rate for an equivalent AWS instance).
Using the SWE-bench peak throughput results (TP=1, peak concurrency 100):
- Baseline:
- Output throughput (tok/s): 2620.89
- Cost per 1M output tokens: $4.41
- Speculative decoding:
- Output throughput (tok/s): 3250.07
- Cost per 1M output tokens: $3.56
Total savings: 19.4%
At peak utilization, speculative decoding reduces the cost per 1M output tokens by $0.85 (19.4%), with no change to the model weights or output distribution.
Conclusion
Our benchmarks across three datasets, two tensor-parallelism settings, and three draft-token budgets lead to clear conclusions:
- Speculative decoding with Eagle3 consistently improves serving performance across diverse workloads, even at high concurrency. Output throughput improves by 10-21%, end to end latency drops by 12-20%, and ITL improves by 4-18% across all tested configurations. Crucially, these gains persist up to 200 concurrent requests, contradicting the conventional expectation that speculative decoding majorly helps in low-QPS scenarios. The SWE-bench result (+20.5% throughput on real GitHub issues) is particularly notable because code workloads have distinct vocabulary patterns and longer sequences, yet the gains remain strong.
- The number of draft tokens matters, and more is not always better. For this model, 2 or 3 draft tokens is the sweet spot, both deliver nearly identical throughput (within 1%), though 2-draft achieves slightly better latency.
- The gains are consistent across TP=1 and TP=2, confirming that speculative decoding is compatible with tensor parallelism and does not introduce scaling bottlenecks.
- The throughput gains translate directly into serving cost reductions. At peak utilization on our H200 instance, speculative decoding reduces the cost per 1M output tokens by 19.4% on the SWE-bench workload, with no change to model weights or output quality.
Get started
- Try it yourself: Red Hat AI Inference Server provides an enterprise-ready distribution of vLLM with speculative decoding support out of the box.
- Join the vLLM office hours: The upstream vLLM community hosts regular office hours, where contributors discuss speculative decoding, performance tuning, and new features. It's a great way to stay current on the latest optimizations.
Acknowledgments
I would like to extend my gratitude to Michael Goin, Lucas Wilkinson, Ashish Kamra, Carlos Condado, and Naveen Miriyalu for their feedback and critical insights, which significantly improved the quality of this blog.
Last updated: April 20, 2026