TL;DR — During performance validation of Red Hat Enterprise Linux 10.2, we identified a kernel scheduler regression that reduced system throughput by up to 93% on multi-NUMA instance types. The regression is bimodal: Workloads either run at full speed or experience severe CPU work starvation. Eliminate this throughput collapse at runtime without rebooting by disabling the NI_RANDOM scheduler feature:
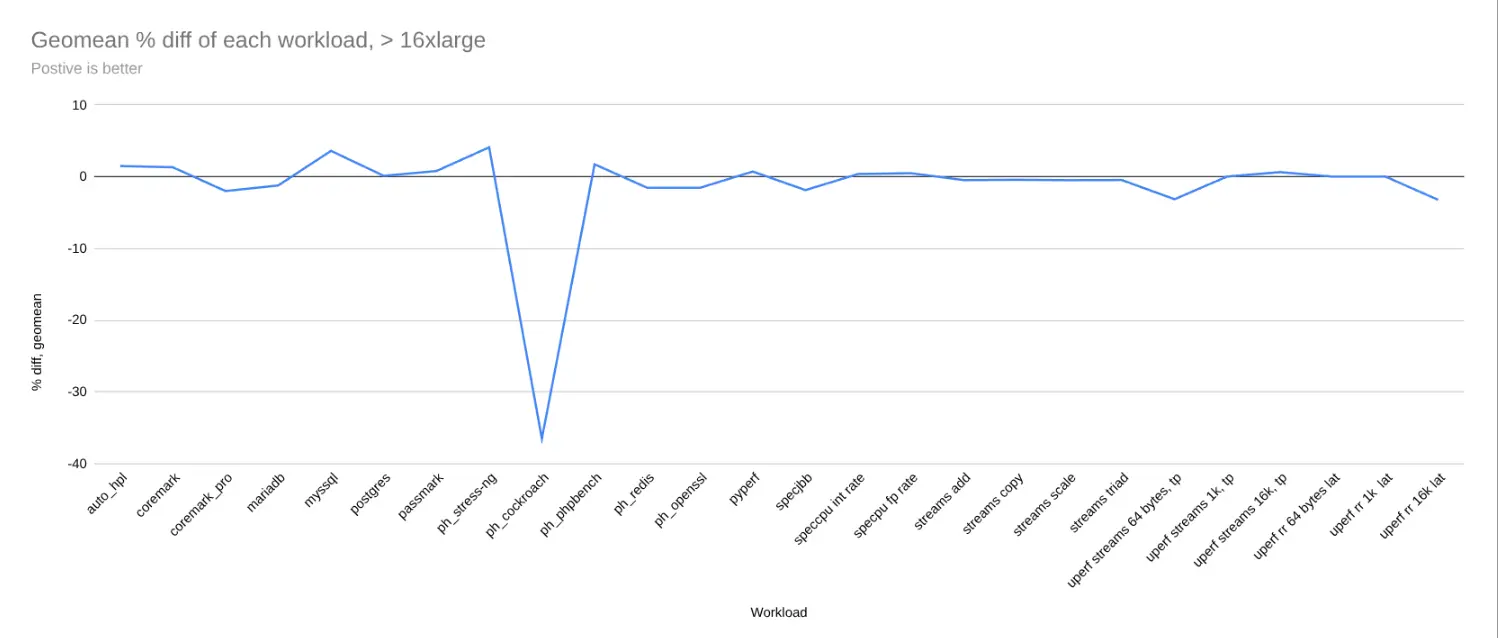
echo NO_NI_RANDOM > /sys/kernel/debug/sched/featuresEvery Red Hat Enterprise Linux (RHEL) minor release carries hundreds of kernel patches. Most of them are invisible to performance. This one is not. During RHEL 10.2 compose validation, the team caught a regression that caused up to 93% throughput loss on CockroachDB across multiple AWS instance types (see figure 1). A few other benchmarks flagged minor issues on individual instances, but nothing else came close to this magnitude.
What is CockroachDB?
CockroachDB is a distributed SQL database, but with the Phoronix wrapper it serves as a system benchmark. This runs cockroachdb as a single-node server on a local machine — no network, no distributed coordination — so the only variables are the kernel, CPU, and memory subsystem. The benchmark spawns 128 to 1024 concurrent workers that perform random reads and writes against a single key-value table for 90 seconds, measuring throughput in ops/s. CockroachDB is written in Go, which multiplexes thousands of goroutines across operating system (OS) threads, placing heavy demand on the kernel's thread scheduler, making it an effective stress test for exactly the kind of regression we found.
What problem does the regression cause?
This is the story of how I found the regression, what I ruled out, and why it was so hard to pin down.
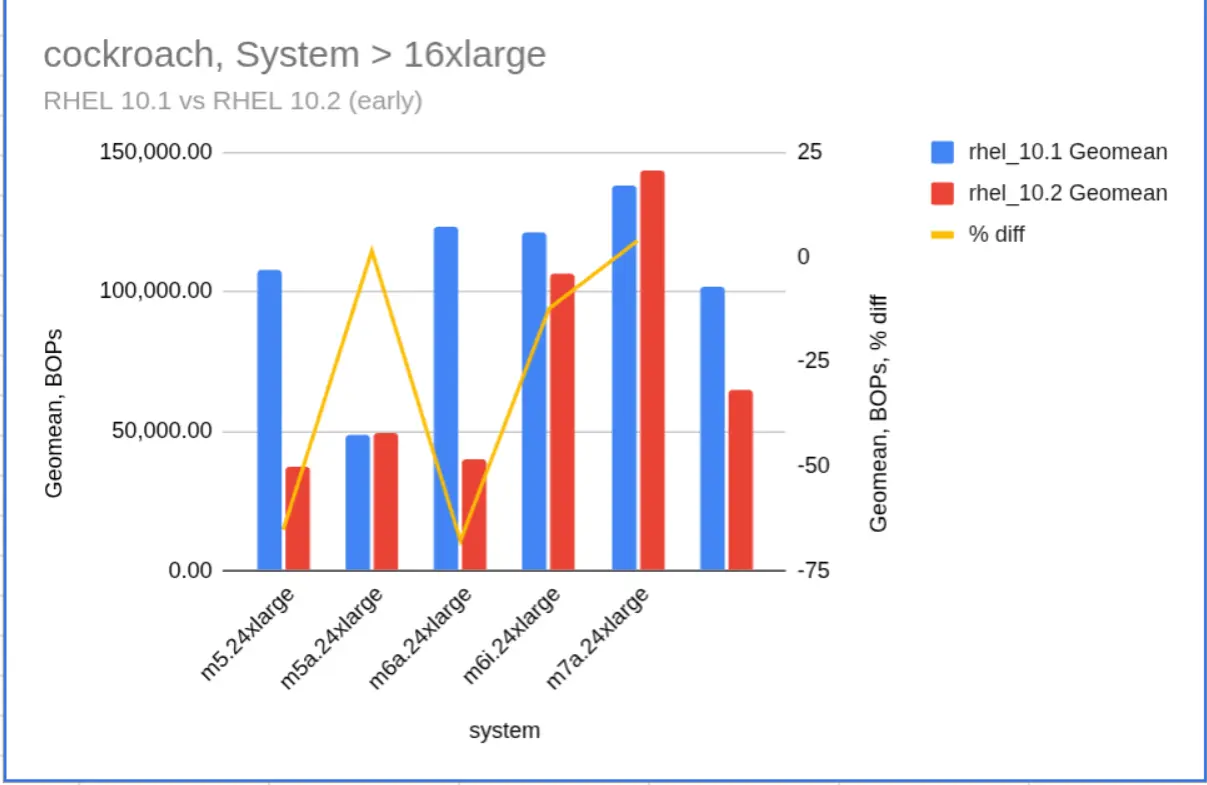
Of 29 instance types tested, the major hit was large machines. The pattern was immediate: large multi-NUMA instances experience severe degradation, while small single-NUMA instances remain largely unaffected. So I picked the worst-performing instance (m6a.24xlarge, 96 vCPUs, two NUMA nodes, AMD EPYC 7R13) and began investigating (see figure 2).
| Instance | Processor | vCPUs | NUMA | Delta |
|---|---|---|---|---|
| m6a.24xlarge | AMD EPYC 7R13 | 96 | 2 | -68% |
| m5.24xlarge | Xeon 8175M | 96 | 2 | -65% |
| m7a.16xlarge | AMD EPYC 9R14 | 64 | 2 | -31% |
| m7i.16xlarge | Xeon 8488C | 64 | 2 | -15% |
The first surprise: It doesn't wobble, it flips
I ran 10 iterations on each kernel — RHEL 10.1 (6.12.0-124.38.1) and 10.2 (6.12.0-211.7.1) — with identical configuration. The same instance type, same availability zone, same tunables, same Phoronix cockroach-1.1.0 benchmark, XFS, SELinux enforcing, no tuned profile, no swap, no hugepages. The only differences were the kernel and glibc versions.
RHEL 10.1 stays within a 3% band across all iterations. RHEL 10.2 has two catastrophic swings: -69.4% entering the degraded state and +231.1% recovering from it.
| Iter | RHEL 10.2 GeoMean | 10.2 Run-to-Run | RHEL 10.1 GeoMean | 10.1 Run-to-Run | Delta | Delta % |
|---|---|---|---|---|---|---|
| 1 | 127,553 | - | 126,620 | - | 933 | 0.70% |
| 2 | 124,467 | -2.40% | 126,323 | -0.20% | -1,856 | -1.50% |
| 3 | 38,047 | -69.40% | 126,461 | 0.10% | -88,414 | -69.90% |
| 4 | 37,983 | -0.20% | 127,459 | 0.80% | -89,476 | -70.20% |
| 5 | 38,298 | 0.80% | 124,154 | -2.60% | -85,856 | -69.20% |
| 6 | 38,099 | -0.50% | 127,739 | 2.90% | -89,640 | -70.20% |
| 7 | 38,220 | 0.30% | 125,460 | -1.80% | -87,240 | -69.50% |
| 8 | 38,315 | 0.20% | 127,277 | 1.40% | -88,962 | -69.90% |
| 9 | 126,802 | 231.10% | 126,176 | -0.90% | 626 | 0.50% |
| 10 | 125,893 | -0.70% | 127,104 | 0.70% | -1,211 | -1.00% |
| Avg | 73,368 | - | 126,477 | - | -53,110 | -42.00% |
| StdDev | 40,197 | - | 1,060 | - | - | - |
| CoV | 54.80% | - | 0.84% | - | - | - |
| Max +ve swing | - | 231.10% | - | 2.90% | - | - |
| Max -ve swing | - | -69.40% | - | -2.60% | - | - |
Breaking down iteration 3 by individual workload shows the regression scales with both write ratio and concurrency
| Workload | RHEL 10.1 | RHEL 10.2 | Delta (10.2 vs 10.1) |
|---|---|---|---|
| 60% c=128 | 79,174 | 5,269 | -93% |
| 60% c=256 | 105,824 | 12,340 | -88% |
| 60% c=512 | 118,799 | 25,140 | -79% |
| 95% c=128 | 131,005 | 37,948 | -71% |
| 95% c=256 | 149,322 | 91,496 | -39% |
| 95% c=512 | 167,405 | 144,323 | -14% |
| 60% c=1024 | 118,833 | 52,456 | -56% |
| 95% c=1024 | 164,032 | 157,428 | -4% |
The performance doesn't fluctuate, it flips. Iterations 1 (127,553) and 2 (124,467) match 10.1 within 1.5%. On iteration 3, throughput drops to 38,047-a 69.4% fall in a single step. It stays locked between 37,983 and 38,315 for six consecutive iterations (CoV under 1% within the degraded band), then snaps back to 126,802 on iteration 9. That's a 231% jump between consecutive runs. Iteration 10 holds at 125,893, confirming the recovery is real.
This is not noise. It is a binary state change. The system has two stable operating points and something tips it from one to the other. What triggers the recovery is not yet understood. The degraded state persists for six consecutive iterations (~9 hours of runtime), then resolves spontaneously between iterations 8 and 9 with no configuration change or restart. Per entity load tracking (PELT) load averages decay with a 32ms half-life, which is far shorter than the inter-iteration gap-so simple time-based decay does not explain why the system stays degraded for hours and then recovers. The trigger likely involves a secondary state change (a NUMA rebalance, a memory compaction event, or a topology update) that resets the newidle pull probability, but I have not confirmed this.
The second surprise: RHEL 10.2 CPUs are 95% idle
Next I captured vmstat 1 during active benchmarking on both kernels and the pattern was unmistakable: One second, r=128 runnable processes, the next, r=0 and id=85%. The work existed. CockroachDB was running, the workload generator was running, but CPUs were not picking it up. This is work starvation, and it is the unmistakable signature of a scheduler regression.
| Metric | RHEL 10.1 | RHEL 10.2 |
|---|---|---|
| r (runnable) | 109-132 | 0-128 |
| us (user %) | 73% | 3-4% |
| id (idle %) | 8% | 85-95% |
The cumulative vmstat data on RHEL 10.2 showed what was happening underneath the flip. Idle time staircase-dropped from 67% after the first run to 60% by the fourth, then plateaued. Interrupts climbed from 7,591 at clean boot to 215,576 (a 28x increase) then flattened at the same point. Context switches during the benchmark climbed from 312K/s on the first run to 553K/s on the fifth, a 77% increase within a single session.
| Metric | Before Run 1 (clean boot) | After Run 1 | After Run 2 | After Run 3 | After Run 4 | After Run 5 |
|---|---|---|---|---|---|---|
| us | 0% | 24% | 26% | 27% | 29% | 29% |
| sy | 0% | 8% | 9% | 10% | 10% | 10% |
| id | 100% | 67% | 65% | 63% | 60% | 60% |
| cs/s | 0 | 312,637 | 340,511 | 440,528 | 493,689 | 552,996 |
| in/s | 7,591 | 165,327 | 183,991 | 199,600 | 215,576 | 214,093 |
The scheduler was accumulating state across runs and not letting go, likely PELT load averages drifting up and never fully decaying between iterations.
Where the work went
Thread stack traces during the degraded state told the story. 148 CockroachDB threads were blocked in futex_do_wait — Go runtime locks. Another 24 were idle in hrtimer_nanosleep.
| TID | On CPU (ms) | Waiting (ms) | Wait % |
|---|---|---|---|
| 48049 | 1,327 | 1,886 | 59% |
| 47062 | 1,563 | 1,879 | 55% |
| 47063 | 1,072 | 840 | 44% |
| 47064 | 1,343 | 872 | 39% |
| 47069 | 1,370 | 909 | 40% |
Only 4 threads were actually running. Zero threads were in dequeue_task, throttle_cfs, or load_balance. No kernel-level scheduler stalls. The scheduler was not distributing wake-ups, so threads that could run were stuck waiting for lock holders that never got CPU time.
| Process | Stack Function | Count |
|---|---|---|
| Server | futex_do_wait | 49 |
| Server | hrtimer_nanosleep | 15 |
| Server | sched_yield | 2 |
| Workload | futex_do_wait | 99 |
| Workload | hrtimer_nanosleep | 9 |
| Workload | sched_yield | 6 |
| Workload | syscall_exit_to_user_mode | 3 |
| Workload | irqentry_exit_to_user_mode | 1 |
Schedstat showed the other half of the problem. Even when threads were runnable, they spent 39-59% of their time waiting for the scheduler to pick them up.
NUMA placement was not the cause. RHEL 10.2 counters showed half the activity of 10.1, consistent with half the throughput, and zero numa_miss on both sides.
The regression scaled with how much the workload depended on the scheduler to distribute work: -93% at low concurrency with write-heavy traffic (128 connections, 60% reads), -4% at high concurrency with read-heavy traffic (1024 connections, 95% reads).
Having confirmed the symptom, I needed to isolate the cause. The kernel is the only variable.
- glibc: CockroachDB bundles jemalloc and bypasses glibc malloc entirely, so that's not a factor.
- Hardware: Reproducible on fresh instances in the same availability zone.
- Reboot: I got degraded throughput from the very first run on a freshly rebooted instance.
With thousands of commits between the 10.1 and 10.2 kernels, a full git bisect was not practical. Each run takes 90 minutes per workload. With 8 workloads across multiple iterations, a single bisect step could take 12+ hours.
I used kbisect-dbs, a centralized bisection database maintained by Red Hat's kernel performance team, to narrow 18,848 commits down to 35 scheduler-related changes. These fell into six functional groups. I tested each group through targeted kernel reverts, with multiple CockroachDB test runs
- CFS bandwidth throttle: Eight commits rewriting
cfs_rq-basedaccounting to task-based. Reverting the group delayed the degraded state by one or two runs but didn't prevent it. A timing factor, not the root cause. - PELT load tracking: Idle-time accounting changes. Cleared individually.
- EEVDF entity scheduling:
min_slicetuning and related changes. Cleared individually. - Deadline server: Cleared individually.
- Miscellaneous:
SD_OVERLAPtoSD_NUMArefactor,wait_task_inactive force-dequeue,hrtickdonor,CONFIG_SCHED_CLASS_EXTacrosscore.c,topology.c, and kernel config. All cleared. - Newidle balance: Three commits controlling whether idle CPUs steal work from busy ones. The strongest suspects given the symptoms. Individually, none reproduced the regression. These commits are tightly coupled, so reverting one without the others doesn't compile cleanly. But one of them (
NI_RANDOM) is a runtime-togglableSCHED_FEAT, which revealed a new path.
Conclusion and workaround
Disabling NI_RANDOM breaks the feedback loop where randomized newidle balancing starves runnable threads on multi-NUMA hardware. The fix is a single runtime toggle no reboot required:
echo NO_NI_RANDOM > /sys/kernel/debug/sched/featuresTo persist across reboots, create a tmpfiles drop-in:
# /etc/tmpfiles.d/sched_features.conf
w- /sys/kernel/debug/sched/features - - - - NO_NI_RANDOM
Chris Mason at Meta reported the original newidle balance overhead idle CPUs burning cycles on balance attempts that almost always failed. Peter Zijlstra's proportional-randomization fix (NI_RANDOM) solved that problem, but introduced the starvation behavior we caught here. Both the original patches and further refinements are working through the mainline with backports to v6.12 already posted.. Until those land in RHEL, disabling NI_RANDOM restores full throughput.

