Red Hat Enterprise Linux (RHEL) comes with powerful monitoring tools, including:
- Performance Co-Pilot (PCP): The toolbox for collecting data from various systems, storing the data for later evaluation and more
- Grafana: For visualizing data collected with PCP
- Valkey/Redis: For caching
In a simple setup, PCP is installed on a single system, and gathers performance data that gets archived into local files. This provides an invaluable tool for debugging to answer questions like "Why was the load high on the system yesterday at 2am?" With this setup, we can also get graphs of metrics like the traffic running over network interfaces.
RHEL 10.2 adds the PUSH model to Performance Co-Pilot, further simplifying data collection.
Collecting performance data the old way
Many customers use central systems to collect PCP data from their systems, and then use Grafana to visualize the bandwidth.
We have designed and are testing multiple architectures, and the best option for you depends on your specific requirements and details like the number of systems and how much data you want to collect and visualize.
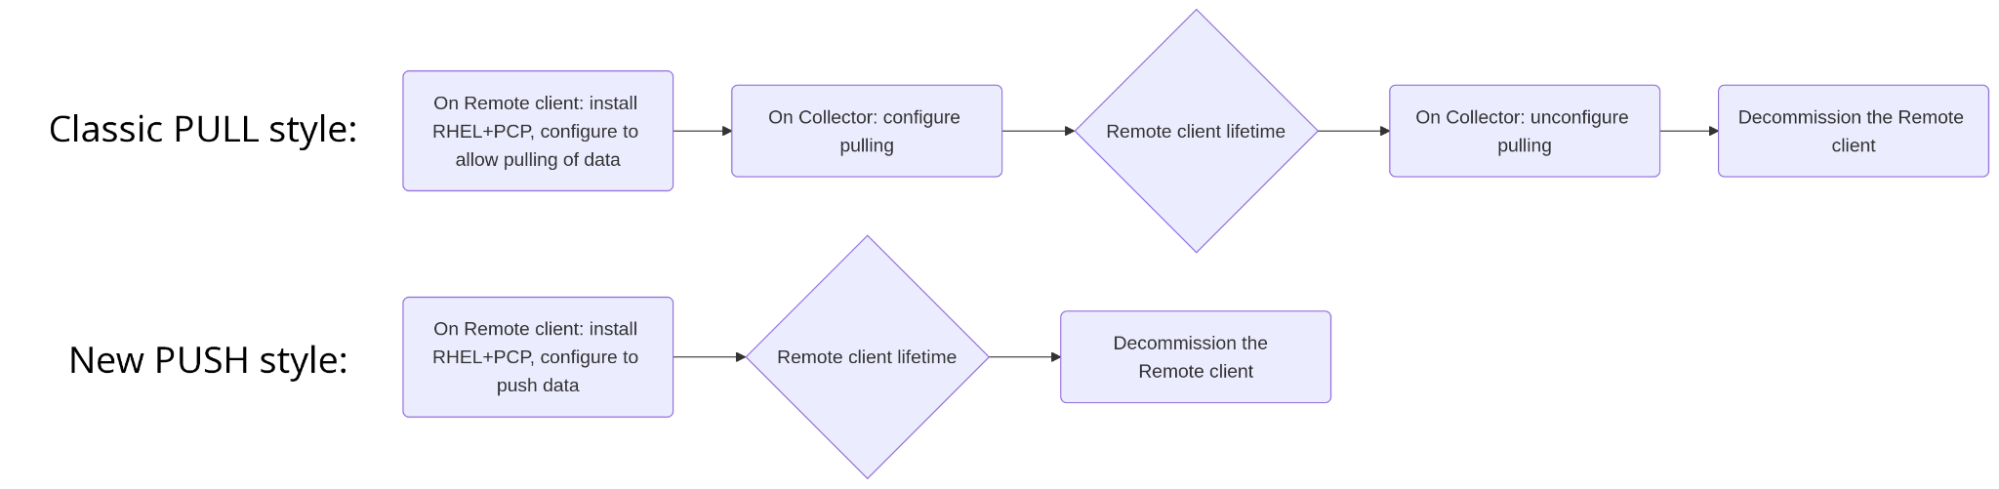
It's common to have one central system for collecting and visualizing data, and many remote systems to provide monitor data. To add a new system, these steps are required:
- On the remote system: Install PCP, configure to allow access from the collector system
- On the collector system: Configure for the new remote system, then start data collection
Also when the remote system goes out of service, the collector system needs to be reconfigured. Our system roles, which are Ansible playbooks that are included in your RHEL subscription, can help with this configuration, but the overall procedure is still complex. You still need to reconfigure the collector system whenever you set up a new remote system, and then again when decommissioning the remote system.
This process is demonstrated in Figure 1, but you asked us to make this easier, and we listened!
Introducing the pmlogger PUSH model
With RHEL 10.2, we have introduced PCP 7.0.3, which helps with the pmlogger PUSH model. The new functionality allows us to configure our collector system once, and we no longer have to touch it for configuration of new (or decommissioned) remote clients.
The remote clients are all running with the same config, and they just push the PCP data to the collector system. Couldn't be simpler.
Using the PUSH model: Collect system
Let's first prepare our collector system. On our RHEL 10.2 system, we install pcp, and ensure that two daemons are started. We then allow incoming TCP connections to port 44322 (that's where our pmproxy listens).
# cat /etc/redhat-release
Red Hat Enterprise Linux release 10.2 (Coughlan)
# dnf -y install pcp
[...]
# systemctl enable ––now pmcd pmproxy
# firewall-cmd --permanent --add-port 44322/tcp
# systemctl reload firewalld
That's all. From now on, clients can send data to the collector system, and no further configuration is required.
First client: pcp-zeroconf
Now let's look at our first client. We install the pcp-zeroconf package, which:
- Installs required packages
- Deploys a PCP configuration with some reasonable metrics
- Starts initial data archiving
Please note: Due to a bug, installation of pcp-zeroconf is achieved through dependencies pulling in other packages of ~900MB size onto the system. Look at the next section for a lean installation. With the following steps, a default config is created, which starts to archive PCP data into local files in /var/log/pcp/pmlogger.
# dnf -y install pcp-zeroconfFind out where this example system is storing the data:
# pcp | grep pmlogger
pmlogger: primary logger:
/var/log/pcp/pmlogger/amd102b.local/20260608.14.45-00
This means that a local pmlogger instance is running, frequently querying data, and storing it. We can now push this data to our collector system. Our collector system is amd102, and our first client system amd102b with the attached b.
# pmlogpush -h amd102 \
/var/log/pcp/pmlogger/amd102b.local/20260608.14.45-00
On our collecthost, pmproxy is the daemon for receiving and storing the data. If all went well, it now receives and stores the data we sent. Let's confirm:
# ls -al /var/log/pcp/pmproxy/
drwxr-xr-x. 2 pcp pcp 4096 Jun  8 15:25 amd102b.local
[...]
The directory has the name of our client, and the pmlogger data in the directory has the normal format. We can now examine the data with our normal tools like pmrep, pmchart, and so on. If the data has not appeared:
- Use
systemctl status pmproxyto confirm whetherpmproxyis running - Use
straceattached to pmproxy, which can confirm ifpmproxyis receiving the data - Use
tcpdumpto understand if the traffic is coming in, or maybe blocked by a firewall
Let's now reconfigure our remote system to send out the live data. Move the previously used file local away to deactivate the logging into local files on the remote system. Then create a file called remote, including a reference to http://amd102:44322, which is our collector system. Then restart pmlogger:
# cd /etc/pcp/pmlogger/control.d
# mv local /tmp
# echo 'LOCALHOSTNAME   y   n   +PCP_ARCHIVE_DIR/LOCALHOSTNAME -r -T24h10m -c config.default -v 100Mb http://amd102:44322' >remote
# systemctl restart pmlogger
On our collector system, we see now the incoming data being reported:
# pcp
Performance Co-Pilot configuration on amd102.local:
[...]
pmlogger: primary logger: /var/log/pcp/pmlogger/amd102.local/20260608.04.58
pmproxy: /var/log/pcp/pmproxy/amd102b.local/20260608.16.39
[...]
The line starting with pmlogger is referring to our collector system itself. The line starting with pmproxy is reporting the incoming data from our remote system. The pmlogsummary utility shows the details:
# pmlogsummary -a \
  /var/log/pcp/pmproxy/amd102b.local/20260608.16.39|head -4
Log Label (Log Format Version 3)
Performance metrics from host amd102b.local
  commencing Mon Jun  8 16:39:11.150408313 2026
  ending     Mon Jun  8 16:59:21.212261127 2026
This confirms the archive files are now spanning a time frame of 20 minutes.
Second client: handwritten config
Now let's configure a second client. This time without installing pcp-zeroconf, which means some manual config work. We start with installing minimal pcp, taking up just ~10MB.
# dnf -y install pcp
[...]
# systemctl enable --now pmcd
# /usr/libexec/pcp/bin/pmlogconf \
  /var/lib/pcp/config/pmlogger/config.default
# echo 'LOCALHOSTNAME   y   n   +PCP_ARCHIVE_DIR/LOCALHOSTNAME -r -T24h10m -c config.default -v 100Mb http://amd102:44322' \
>/etc/pcp/pmlogger/control.d/remote
# rm -f /etc/pcp/pmlogger/control.d/local
# systemctl enable --now pmlogger
These commands perform these actions:
- Install packages
- Create
config.defaultwith metrics that should be monitored - Create the config file for
pmlogger - Delete the file for local logging
- Start
pmlogger
At this point, we can again execute pcp on the collector system to confirm that data from our second client is coming in.
We can now repeat the steps for the second client on other remote systems so their data appears on the collector system. These new steps can easily be put into a script as well. Plus, the config.default file can also be copied to the remote system, eliminating the need to create it with the pmlogconf command.
Multiple collectors for redundancy
What if our collector system is down for maintenance, or temporarily not reachable over the network? We can solve failure scenarios like this by setting up a second collector system.
The clients are simply configured to send their data to both systems. So if one goes down, you still have the other one.
Conclusion
RHEL now has new tools for simplified data collection, making it much easier to include/remove systems to be monitored. With the data available on the collector system, you can create nice dashboards with Grafana (as in Figure 2) using code that's already included in RHEL!
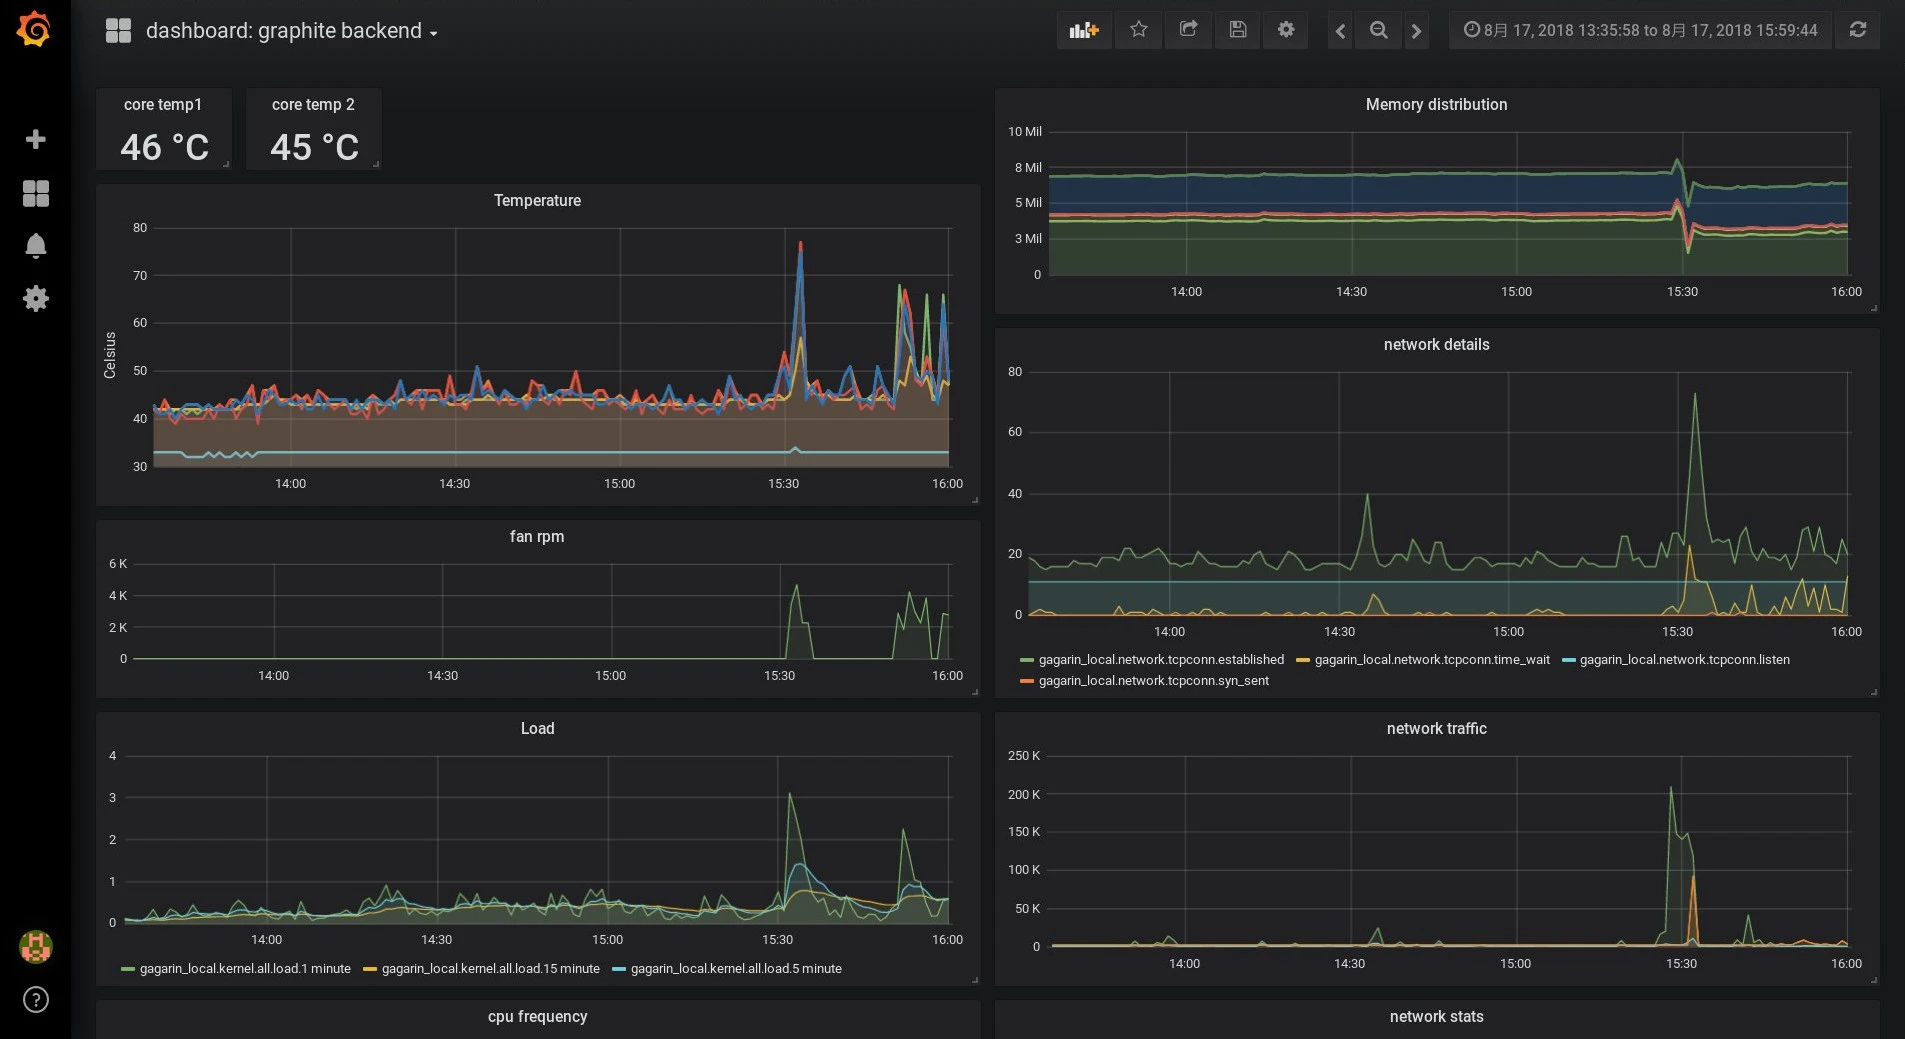
Plus, the data under /var/log/pcp/pmproxy is also picked up and made available in Grafana. To view details on how to set up Grafana to visualize PCP data, visit our documentation.

