When a virtual machine on Red Hat OpenShift Virtualization talks to the outside world over a localnet secondary network, a lot can sit between the guest and the wire: A VLAN tag, an OVS bridge mapping, an MTU, and any number of network policies.The problem of visibility is a helpful one to address.
The network observability command-line tool (oc netobserv) is a good fit for this kind of problem. It starts eBPF agents and (for some commands) a flowlogs-pipeline collector on demand. It streams the result to your terminal, then tears everything down when you're done. You don't need a persistent FlowCollector or Loki stack. That makes it useful when you are chasing one specific virtual machine (VM) issue instead of setting up long-running monitoring.
This post covers four troubleshooting scenarios for VMs on a localnet. Each one was reproduced on a live cluster and captured with the oc netobserv. The companion repo includes manifests, scripts, and capture output.
Everything here was run on Red Hat OpenShift 4.20.23, Red Hat OpenShift Virtualization 4.20.15, network observability operator 1.11.2, and the oc netobserv plug-in 1.11.1 (the features were introduced in 1.8, but I ran them on the newer 1.11.1 plug-in for this article).
The test environment
Two labs, both on the same vmtrunk physical network (mapped to OVS bridge br-trunk on each node by a NodeNetworkConfigurationPolicy — this matters in Scenario 1), all NADs MTU 1500 with IPAM disabled:
- VLAN-500 lab (Scenarios 1, 3, 4): Namespace
vm-test2, one localnet on VLAN 500 (ClusterUserDefinedNetwork/vlan500). - Two Fedora VMs with static IPs:
fedora-a10.50.0.11/24,fedora-b10.50.0.12/24 (using cloud-init). - DHCP lab (Scenario 2): Namespace
vm-dhcp, two localnets on VLAN 10 and VLAN 15 (ClusterUserDefinedNetwork/vlan10 and /vlan15). - A
dhcp-serverVM runsdnsmasqon VLAN 10 only (10.10.0.1/24, range .50–.150). There are deliberately none on VLAN 15. - A
dhcp-clientVM straddles both VLANs (enp2s0/VLAN 10, enp3s0/VLAN 15), each NICipv4.method auto.
Scenario 1: Is my VM really on the VLAN?
The first question with any VLAN/localnet setup is simply whether a VM's traffic actually using the network I expect? The command-line interface (CLI) answers this directly with the --enable_udn_mapping flag, which tags every flow with the user-defined network its endpoints belong to.
$ export NETOBSERV_NAMESPACE=netobserv-cli
$ oc netobserv flows --background --enable_udn_mapping=true \
--protocol=ICMP --peer_cidr=10.50.0.0/24 --max-time=5m
Ping fedora-b from fedora-a over 10.50.0.x, and then look at the capture:
$ oc netobserv stop && oc netobserv copy && oc netobserv cleanupEvery captured record was the VM-to-VM ICMP exchange, and both endpoints were mapped to the vlan500 UDN:
$ export NETOBSERV_NAMESPACE=netobserv-cli
$ oc netobserv flows --background --enable_udn_mapping=true --protocol=ICMP --peer_cidr=10.50.0.0/24 --max-time=5m
8/8 Ready. Background capture started.
To read back the captured flow:
$ oc netobserv copy
Records touching VLAN-500 NM IPs: 149
Distinct UDN labels: [`vlan500`]
Time      SecAddr     OutAddr     Proto  SrcMac.. UDN
03:54:46  10:50.0.11  10.50.0.12  ICMP   02...02  vlan500
03:54:46  10:50.0.12  10.50.0.11  ICMP   02...01  vlan500
[...]
That proves the traffic is on the VLAN-500 localnet and not leaking onto the pod network, without logging into either guest. If a VM you expect on VLAN 500 shows an empty UDN, then its NIC isn't attached where you think it is.
Scenario 2: A NIC that never gets a DHCP lease
The moment you let a localnet hand out addresses with DHCP, a new failure shows up: A VM NIC comes up, but never gets an IP. The guest just sits there, "connecting". Is the NIC dead? On the wrong VLAN? Firewalled? Or is there simply no DHCP server on that VLAN?
For this one, we use a different lab: Namespace vm-dhcp with two localnets, VLAN10 and VLAN15. A dnsmasq DHCP server lives on VLAN10 only (10.10.0.1, range .50–.150). A single dhcp-client VM has one NIC on each VLAN, both set to ipv4.method auto. So VLAN10 should work and VLAN15 should not — and we want to prove exactly that from outside the guest.
DHCP is UDP, and every DHCP packet touches port 67 (the client sends to dport 67, the server replies from sport 67), so one filter catches the whole conversation on both VLANs at once:
$ oc netobserv flows --background \
--enable_udn_mapping=true \
--protocol=UDP --port=67 --max-time=5m
Forcing a DHCP attempt on both client NICs. The capture splits logs cleanly by VLAN. The only question that matters is whether a packet sourced from port 67 — a server reply — ever appears on each VLAN:
$ python3 analyze-dhcp.py output/flow/*.json
DHCP flows captured: 75 records, 80 packets
== VLAN10 ==
  netobserv UDN mapping (--enable_udn_mapping): vlan10
  client -> broadcast  DISCOVER/REQUEST     9 pkts
  server -> client     OFFER/ACK  (from 10.10.0.1:67)   1 pkts
  => a DHCP server ANSWERED. Lease handed to 10.10.0.53
== VLAN15 ==
  netobserv UDN mapping (--enable_udn_mapping): vlan15
  client -> broadcast  DISCOVER/REQUEST    68 pkts
  server -> client     OFFER/ACK            0 pkts
  => NO server answered — port 67 was never sourced on VLAN15. No lease.
The client's DISCOVERs are leaving on both VLANs, so the NIC, the link, and the localnet are all fine. But on VLAN15 nothing ever answers. No packet is sourced from port 67, which is a sign that no DHCP server is on that VLAN, not a broken client. The retransmit count is a second indicator: VLAN10 sends a handful of DISCOVERs and stops once it has a lease, but VLAN15 keeps broadcasting (68 vs. 9) because it never gets one. Inside the guest, enp2s0 (VLAN10) holds 10.10.0.53 and enp3s0 (VLAN15) has no IPv4 at all.
Is the traffic actually on the right VLAN? The capture answers that too. The --enable_udn_mapping attributes each DHCP flow to its user-defined network, so the analysis shows VLAN10's flows mapped to VLAN10 and VLAN15's to VLAN15 — netobserv confirms the two NICs' traffic really did use separate VLAN localnets. (For the per-direction split, we also key off each MAC address's organizationally unique identifier (OUI), which is robust even for the broadcast DISCOVERs that OVN can't map to a UDN.)
One caveat: If you look for the literal 802.1Q tag in the capture, you won't find it. The eBPF agents hook the OVN/pod side of the datapath before OVS pushes the access-VLAN tag toward the physical network, so a raw netobserv capture is plain untagged IPv4. The UDN label is how netobserv identifies the VLAN.
To see the tag itself, capture on the node's physical uplink — the NIC that carries the vmtrunk localnet onto the wire, where OVS has already stamped the access VLAN. Run oc debug on the node the client runs on, find the uplink port of the br-trunk bridge, and tcpdump it for DHCP (no script needed — this is one command you can paste):
NODE=$(oc get vmi dhcp-client -n vm-dhcp -o jsonpath='{.status.nodeName}')
oc debug node/$NODE -- chroot /host bash -c '
  uplink=$(ovs-vsctl list-ports br-trunk | grep -vE "patch|^br-" | head -1)
  echo "trunk uplink: $uplink"
  timeout 120 tcpdump -i "$uplink" -e -nn "vlan and udp port 67"'
Now the 802.1Q header is right there on the wire — vlan 15 on every unanswered client DISCOVER, and vlan 10 on both the client's request and the server's reply from 10.10.0.1:
02:15:00:00:00:02 > ff:ff:ff:ff:ff:ff, 802.1Q, vlan 15, 0.0.0.0.68 > 255.255.255.255.67: BOOTP/DHCP, Request
02:10:00:00:00:02 > ff:ff:ff:ff:ff:ff, 802.1Q, vlan 10, 0.0.0.0.68 > 255.255.255.255.67: BOOTP/DHCP, Request
52:54:00:e4:85:4b > 02:10:00:00:00:02, 802.1Q, vlan 10, 10.10.0.1.67 > 10.10.0.53.68: BOOTP/DHCP, Reply
That's the same split netobserv showed with the UDN label, now confirmed as the literal VLAN tag leaving the node. VLAN 15 carries only requests, VLAN 10 carries the request and the reply.
Scenario 3: Reading the MTU off the wire
MTU problems on overlays and localnets are somewhat difficult because the symptoms are indirect. Here, the command-line helps show the effective MTU of VM traffic. The trick is to send a payload larger than the MTU so that the kernel fragments it. The first fragment is exactly MTU-sized. Capture that with ICMP, which (unlike TCP) isn't hidden behind segmentation offload:
$ oc netobserv packets --background \
--protocol=ICMP \
--peer_cidr=10.50.0.0/24 --max-time=5m
From fedora-a, send a burst of oversized pings so the capture has plenty of fragments to read back:
$ ping -s 2000 -c 40 -i 0.05 10.50.0.12
$ oc netobserv stop && oc netobserv copy && oc netobserv cleanup
The oc netobserv packets saves a file in the format of pcapng. Read it back, and the effective MTU is right there in the first fragment of every ping — no summarizing needed. In the misconfig capture (fedora-a dropped to 1280, fedora-b is still 1500).
The first fragment from fedora-a is capped at 1256:
10.50.0.11 > 10.50.0.12: ICMP echo request, seq 1, length 1256The remainder of the packet from fedora-a is listed:
10.50.0.11 > 10.50.0.12: ip-proto-1 (fragment) But the first fragment from fedora-b is 1480:
10.50.0.12 > 10.50.0.11: ICMP echo reply,   seq 1, length 1480
10.50.0.12 > 10.50.0.11: ip-proto-1 (fragment)
10.50.0.11 > 10.50.0.12: ICMP echo request, seq 2, length 1256
10.50.0.12 > 10.50.0.11: ICMP echo reply,   seq 2, length 1480
10.50.0.11 > 10.50.0.12: ICMP echo request, seq 3, length 1256
10.50.0.12 > 10.50.0.11: ICMP echo reply,   seq 3, length 1480
Every frame fedora-a puts on the wire tops out at an ICMP length of 1256 (IP total length 1276 → MTU ~1280).
However, fedora-b keeps sending 1480 (MTU 1500) — the effective MTU = ICMP length + 20 for the IP header.
The same result, summarized per direction (and demonstrated in figure 1):
| Capture | a to b (fedora-a TX) | b to a (fedora-b TX) |
|---|---|---|
| Healthy (a=1500, b=1500) | len 1480 → MTU 1500 | len 1480 → MTU 1500 |
| Misconfig (a=1280, b=1500) | len 1256 → MTU ~1280 | len 1480 → MTU 1500 |
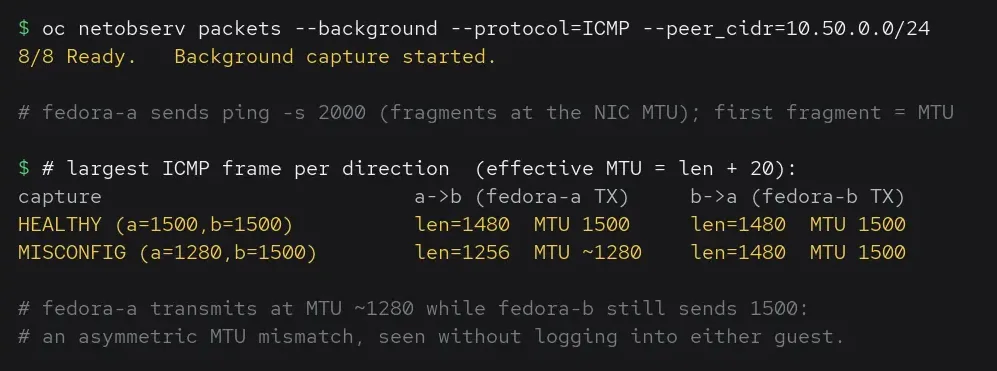
That asymmetry, with one VM's frames topping out at 1280 while its peer still sends 1500, is the MTU mismatch, diagnosed from outside the guest. The netobserv command captures with a 256-byte snaplen, so payloads read back truncated, but the IP total-length field (containing the MTU) is always in those first bytes.)
This scenario uses fragmented ICMP rather than a big file transfer for one key reason: The eBPF agent hooks before segmentation offload, so a TCP packets capture shows ~65,000-byte generic segmentation offload (GSO) "super-frames", not wire-sized frames. ICMP isn't offloaded, which is why we read the MTU from it.
A true MTU black hole, where pings work but large transfers stall, needs oversized frames silently dropped on a path that can't carry them. That usually means jumbo frames across nodes where the physical switch isn't configured for jumbo. On a fabric that handles jumbo cleanly, there is no black hole to reproduce. That brings us to drops in general.
Scenario 4: Confirming (and explaining) dropped packets
The classic "it worked yesterday" call: A VM can't reach its peer. Is it a dead peer? Routing? MTU? Or is something actively dropping the packets? The CLI's --enable_pkt_drop answers this,, and it even gives you the drop cause.
One caveat first: The eBPF agents run on the host kernel, so a drop inside a guest (an iptables rule in the VM, for example) is invisible. For you to see a drop here, it must happen in the host or OVN datapath. That is exactly what a MultiNetworkPolicy does.
apiVersion: k8s.cni.cncf.io/v1beta1
kind: MultiNetworkPolicy
metadata:
  name: deny-ingress-fedora-b
  namespace: vm-test2
  annotations:
    # Bind this policy to the vlan500 localnet NAD (not the pod network).
    k8s.v1.cni.cncf.io/policy-for: vm-test2/vlan500
spec:
  podSelector:
    matchLabels:
      vm.kubevirt.io/name: fedora-b
  policyTypes:
    - Ingress
  ingress: []   # deny all ingress on vlan500 to fedora-b
After enabling useMultiNetworkPolicy, this example deny-all-ingress policy — bound to the vlan500 NAD through the policy-for annotation, not the pod network — took VM-to-VM pings from 0% to 100% loss:
$ oc apply -f manifests/01-deny-ingress-fedora-b.yaml
multinetworkpolicy.k8s.cni.cncf.io/deny-ingress-fedora-b created
$ oc netobserv flows --background --enable_pkt_drop=true \
--enable_network_events=true \
--protocol=ICMP \
--peer_cidr=10.50.0.0/24 --max-time=3m
8/8 Ready. # ping fedora-a -> fedora-b: 100% packet loss
$ oc netobserv copy
records with dropped packets: 8
total dropped packets: 26
drop causes: {'OVS_DROP_EXPLICIT': 8}
SrcAddr    DstAddr    Proto DropPk DropBy Cause
10.50.0.11 10.50.0.12 ICMP  3     294  OVS_DROP_EXPLICIT
10.50.0.11 10.50.0.12 ICMP  4     392  OVS_DROP_EXPLICIT
[...]
The result is pretty clear: The traffic is leaving fedora-a but 100% of it is dropped with cause OVS_DROP_EXPLICIT. That's an explicit drop in the OVS/OVN datapath, the signature of an admin-defined ACL or network policy rather than an MTU or congestion drop. That points straight at the MultiNetworkPolicy. Delete it, and connectivity returns.
OVS_DROP_EXPLICIT tells you that a policy dropped the packet, but not which one. Network Observability can also surface the policy by name through its network events feature (--enable_network_events), which reads OVN's observability samples. One important caveat: OVN observability is default-network only today.
To see a named drop, deny traffic on the default network with a rule that has a name. An AdminNetworkPolicy deny rule does (a plain NetworkPolicy default-deny shows up as Type=NetpolNamespace with an empty name):
apiVersion: policy.networking.k8s.io/v1alpha1
kind: AdminNetworkPolicy
metadata:
  name: deny-web-ingress
spec:
  priority: 10
  subject:
    namespaces:
      matchLabels:
        kubernetes.io/metadata.name: netpol-demo
  ingress:
    - name: "block-all-to-web"
      action: Deny
      from:
        - namespaces: {}
Running netobserv and setting --peer_ip to the web pod IP:
$ oc netobserv flows --background \
 --enable_pkt_drop=true \
--enable_network_events=true \
--protocol=TCP --port=8080 --peer_ip=10.135.0.15
8/8 Ready. Background capture started.
$ oc netobserv copy
Total records 79  records with NetworkEvents: 79
SrcAddr     DstAddr     DstPort NetworkEvents
10.135.0.12 10.135.0.15 8080    Type=AdminNetworkPolicy Name=deny-web-ingress
Now every dropped flow carries the responsible policy by name:
{
'Action': 'drop',
'Type':   'AdminNetworkPolicy',
'Name':   'deny-web-ingress',
'Direction': 'Ingress',
'Feature': 'accl'
}
That's the difference between the two networks. On the localnet, you learn that a policy dropped the packet, and on the default network you also learn which one.
A few practical notes from running this for real
- Filter tightly: Captures can get pretty large, and capture unrelated cluster traffic before the VM traffic arrives. Always scope captures with
--peer_cidr,--port, and so on, to the VM you're chasing. - Stop is not cleanup: The
oc netobserv stopcommand ends the capture but leaves the namespace. Runoc netobserv cleanupbefore starting the next one. - Watch the collector's SCC: The collector does require SCC priority.

