In this article, I will demonstrate how to use Zabbix integrated with Prometheus/Thanos in the Red Hat OpenShift Virtualization cluster. We will use low level discovery (LLD) to automate the discovery of all VMs, and thus monitor CPU, memory, network, etc. This is for users who need to create and monitor their OpenShift Virtualization using Zabbix, creating capacity alerts, applications, etc. I will not cover the installation of the Zabbix.
Get started
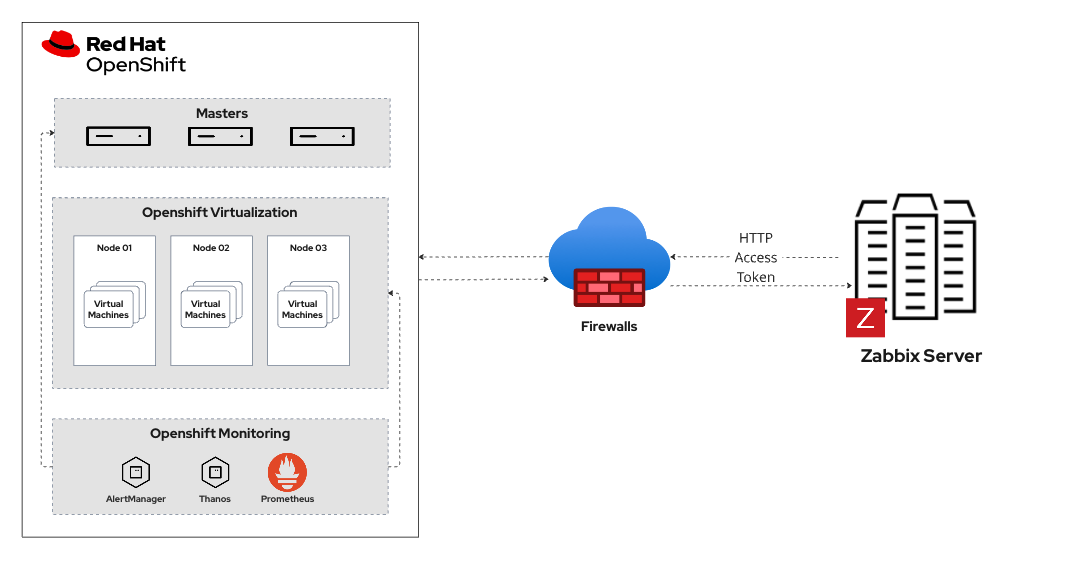
We will create a template using the LLD resource to process the collection of metrics for defining and creating the items and triggers. We will use Zabbix to connect to the Prometheus/Thanos API and have access to all metrics available in the environment, such as kubevirt metrics and infrastructure. Figure 1 shows the monitoring architecture.
Prerequisites:
- User with the cluster-admin cluster role
- OpenShift Virtualization 4.16+
- Zabbix server
In this article, we will use the following versions:
- OpenShift Virtualization v4.18.23
- Kubernetes v1.31.11
- Zabbix 6.0.43
Create a ServiceAccount
Let's create a ServiceAccount in OpenShift Virtualization to use in our Zabbix connection to Prometheus/Thanos.
Using the oc CLI, connect to OpenShift as follows.
$ oc project openshift-monitoring
$ oc create sa zabbix-sa
$ oc adm policy add-cluster-role-to-user cluster-monitoring-view -z zabbix-sa$ oc create token zabbix-sa -n openshift-monitoring --duration=8760hNote
Using this command, we will have a token valid for 1 year. After this period, it is necessary to create a new one.
To create a token without expiration, create a secret of type service-account-token.
$ cat <<EOF | oc apply -f -
apiVersion: v1
kind: Secret
metadata:
  name: zabbix-token                                # <----- Secret Name
  namespace: openshift-monitoring
  annotations:
    kubernetes.io/service-account.name: zabbix-sa   # <----- ServiceAccount Name
type: kubernetes.io/service-account-token
EOF
$ oc -n openshift-monitoring get secret zabbix-token -o jsonpath='{.data.token}' | base64 -d$ oc -n openshift-monitoring get route thanos-querier -o jsonpath='{.spec.host}'Create a host group
Let's create a host group to organize and create our OpenShift Virtualization hosts to monitor. In the left side menu, click on Configuration > Host groups > Create host group > define the Group name and click Add.
Now we'll create a template to centralize all the items we want to monitor in OpenShift Virtualization so we can reuse it in other clusters.
In the left side menu, click on Configuration > Templates > Create template > define the Template name > in Groups enter the host group name created previously, then click ADD.
Create the host
Now we will create a host, which will be the identifier for our OpenShift cluster. This will allow us to monitor more than one host (OpenShift cluster) with the same template.
In the left side menu, click on Configuration > Hosts > Create host, then define the following fields: Host name, Templates, Groups, Description. For templates and Groups, use the names created earlier.
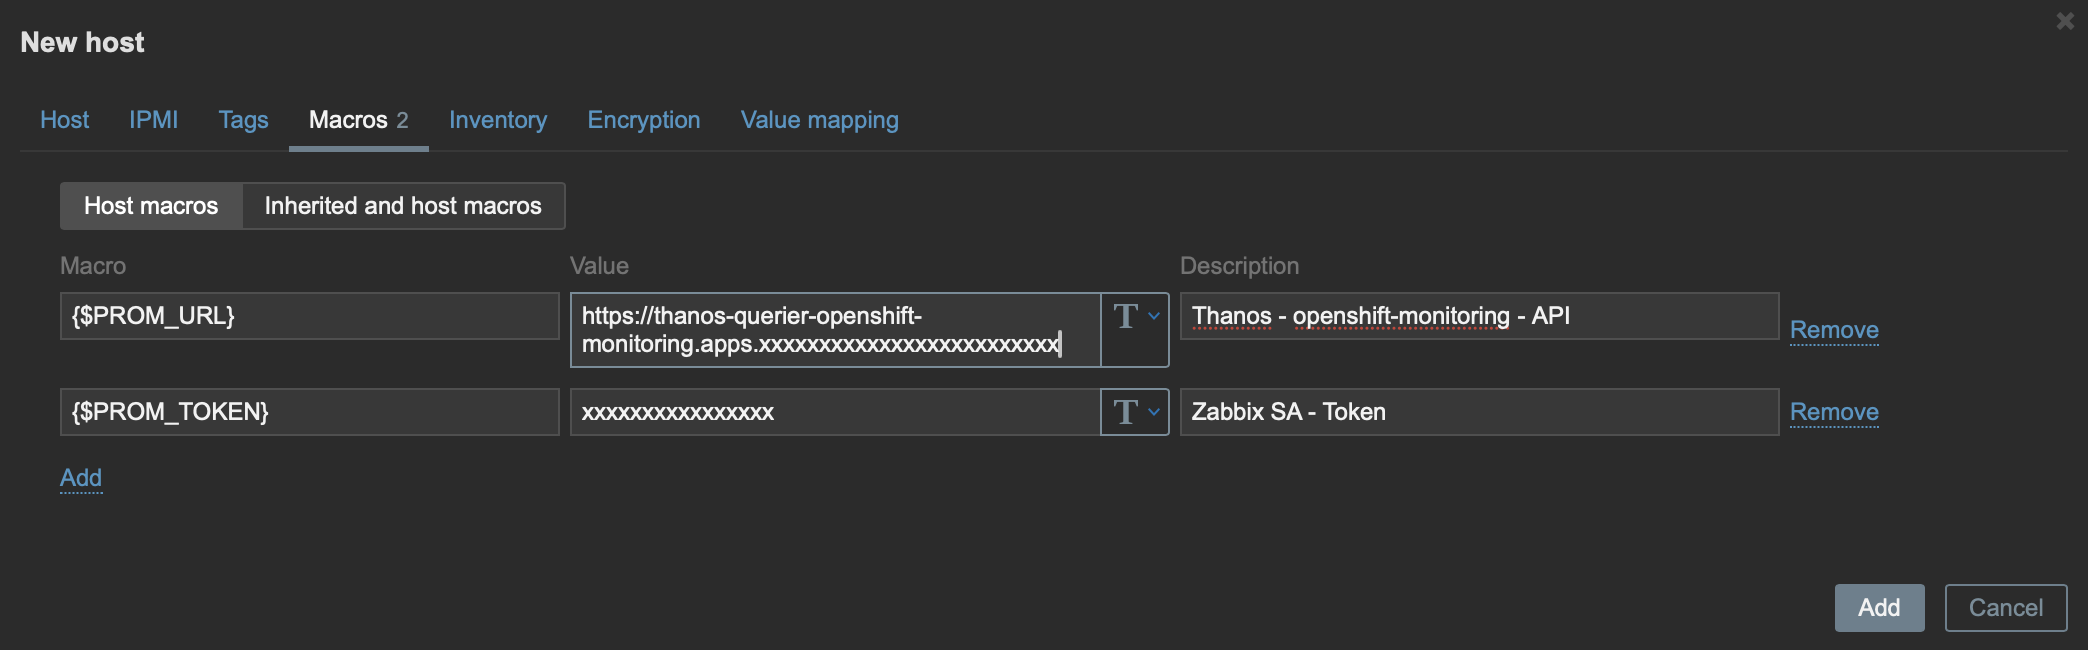
Before saving, click on Macros, and let's add two variables (macros), which we will associate with our host (cluster) and use in our data collection.
Create the following Macros:
{$PROM_URL}: Add the Thanos URL that we collected in the last step of the ServiceAccount.{$PROM_TOKEN}: Add the token we created for our ServiceAccount.
Now we can click Add and save our host (Figure 2).
Low level discovery
LLD in Zabbix is a feature that automatically discovers resources within a monitored system and dynamically creates monitoring items, triggers, and graphs based on predefined rules.
Knowing the function of LLD, let's create two: one for virtual machines and another for virtualization nodes in OpenShift Virtualization.
We will create a Discovery Rule (LLD) that will discover all the virtual machines created in our OpenShift Virtualization cluster.
In the left side menu, click on Configuration > Templates > click on the template we created earlier > click on Discovery rules in the top tab > then click on Create discovery rule.
Fill in the following fields:
- Name: Add the name of the discovery that will be made.
- Type: Select
HTTP agent - Key: Define a unique identifier for this execution.
- URL: This will be our endpoint for querying metrics using the Macro
{$PROM_URL}/api/v1/query - Query fields: This field is responsible for passing our query promql to the endpoint in the URL field.
- Name:
query - Value:
kubevirt_vm_info
- Name:
- Headers: Here we will add our token for authentication to the API using our token Macro.
- Name:
Authorization - Value:
Bearer {$PROM_TOKEN}
- Name:
- Update interval:
1his the frequency at which our VM discovery will be run to discover new VMs.
Our query will return a JSON output, but we need to filter the content we want in this output. We will use the Preprocessingfeature.
Click on Preprocessing > Add > In Name, select Javascript > click on Parameters and add the following script:
var obj = JSON.parse(value);
var out = [];

for (var i = 0; i < obj.data.result.length; i++) {
  var m = obj.data.result[i].metric;
  out.push({
    "{#VM}": m.name,
    "{#NAMESPACE}": m.namespace
  });
}

return JSON.stringify({ "data": out });
Note
This script will process all the output and filter only the following information: VM name and Namespace already creating Macros (variables) for later use.
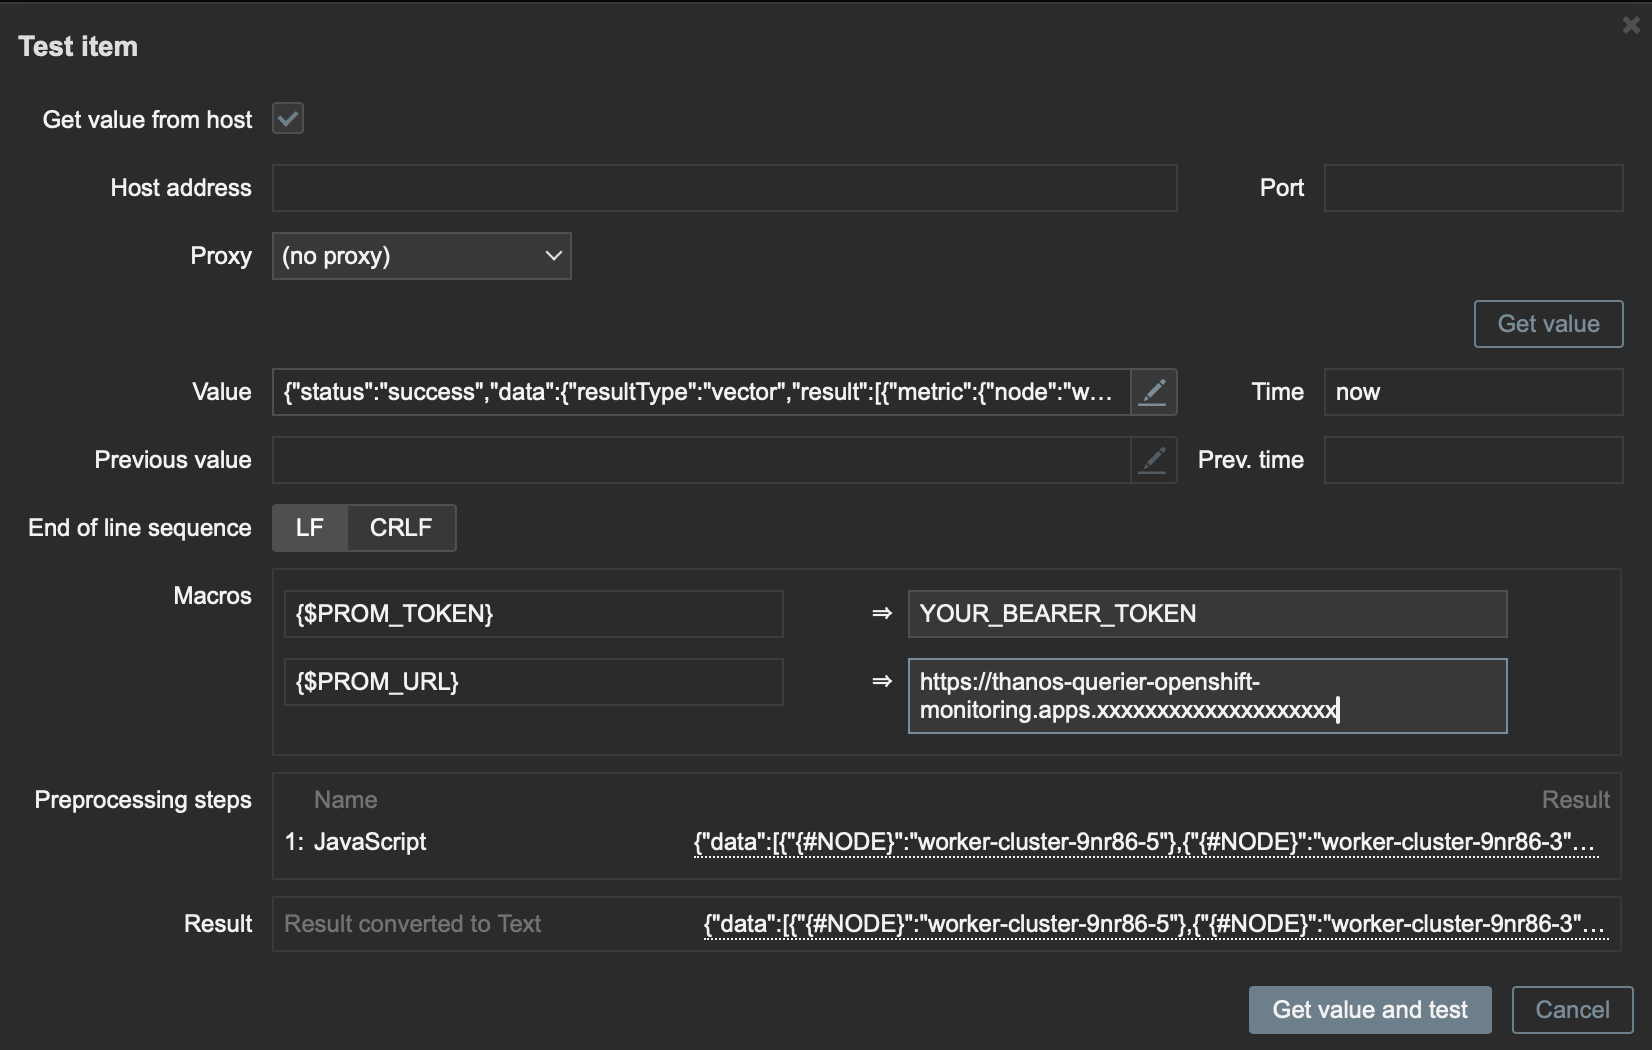
To validate that our Preprocessing is working correctly, click Test all steps.
Check the Get value from host box and add the Macros values, adding the Thanos endpoint and the bearer token.
Then click Get value and test as shown in Figure 3.
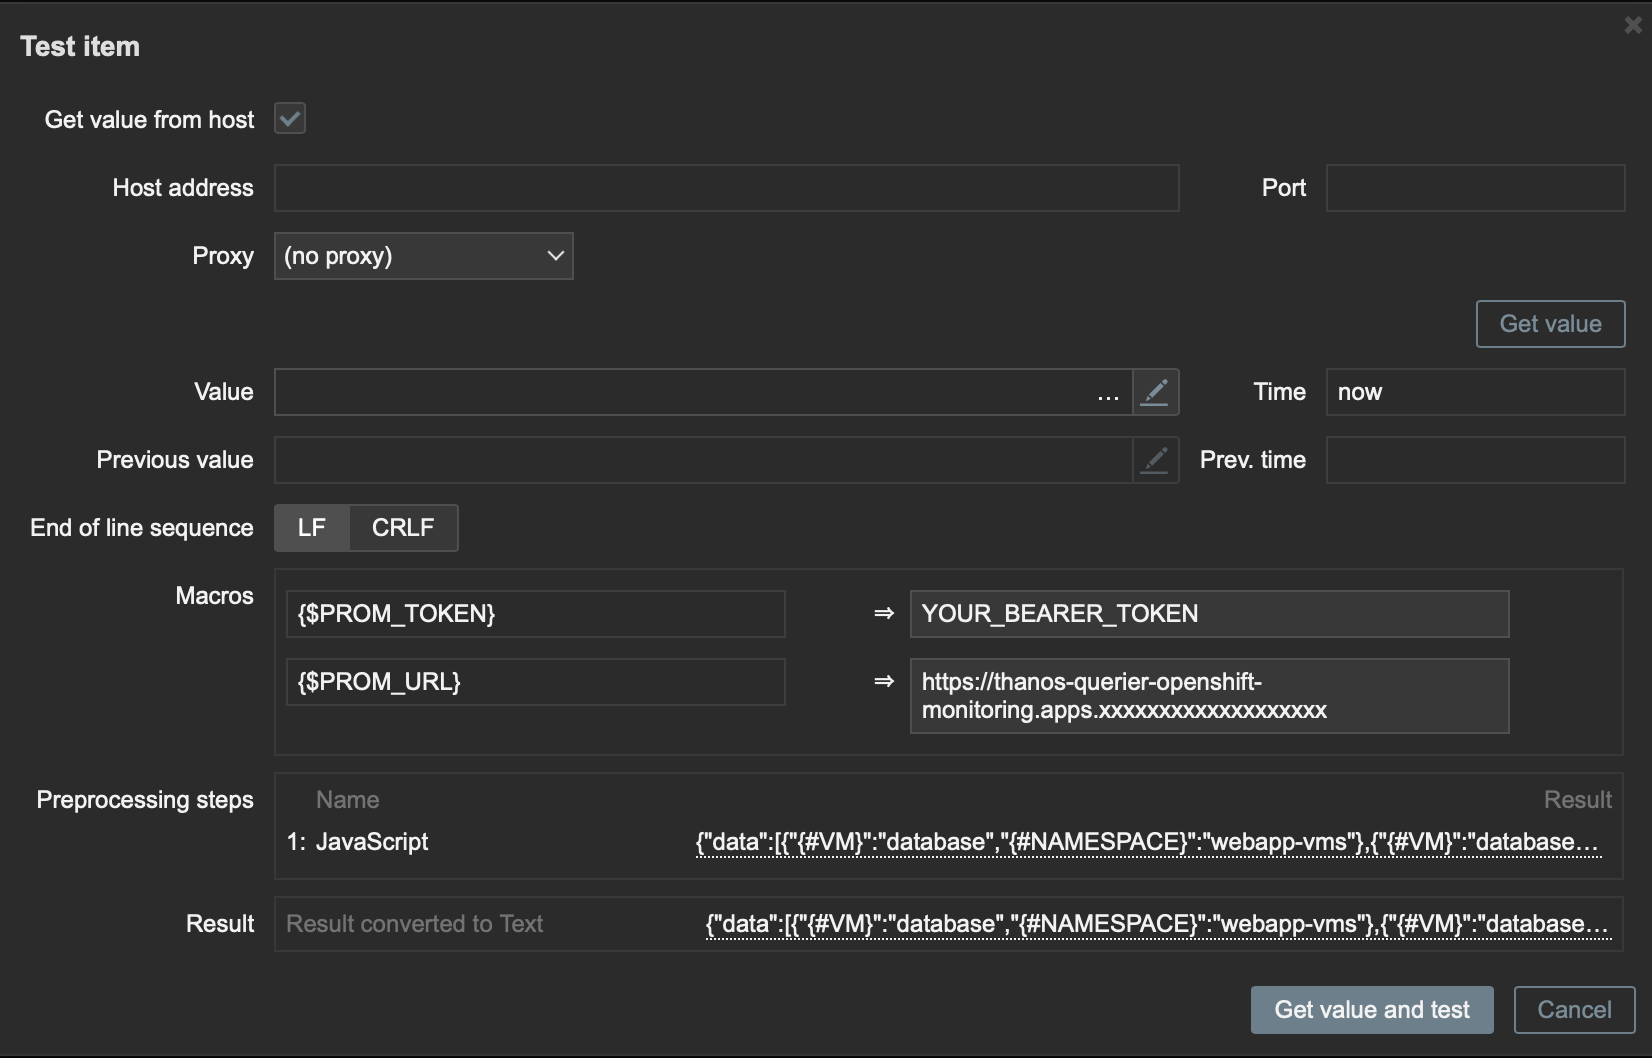
Click Add to save our preprocessing and click Add again to save our discovery rule.
Note
With this test, we can see that our script is working correctly.
Create the item prototype
With the Item Prototype, we will create specific queries such as CPU, memory, network, uptime, and phase using the discovery rule's Macros (variables), VM, and namespace.
Now click on Item Prototype within the discovery rule created earlier or Configuration > Templates > Template Name created earlier > Discovery Rule created earlier > Item prototypes > Create Item prototype.
Fill in the following fields:
- Name:
VM {#VM} CPU usage - Type: Select
HTTP agent - Key:
kubevirt.vm.cpu[{#NAMESPACE},{#VM}] - Type of Information:
Numeric (float) - URL:
{$PROM_URL}/api/v1/query - Query fields: Promql to collect CPU usage from VMs
- Name:
query - Value:
sum by (name,namespace)(rate(kubevirt_vmi_cpu_usage_seconds_total{name="{#VM}",namespace="{#NAMESPACE}"}[5m]))
- Name:
- Headers: Here we will add our token for authentication to the API using our token Macro.
- Name:
Authorization - Value:
Bearer {$PROM_TOKEN}
- Name:
- Units:
cores - Update interval:
1m, this is how often our item will be collected.
Click on Preprocessing > Add .
In Name, select Javascript and click on Parameters to add the following script:
var obj = JSON.parse(value);

if (obj.data.result.length === 0) {
  return 0;
}

return obj.data.result[0].value[1];
Note
This script processes the collected information; if the VM has no CPU usage data, it will be displayed as 0.
Click Add to save our preprocessing and click Add again to save our item.
To speed up the creation of new items, let's clone this one by clicking on the created item. At the bottom of the page, click Clone.
In this Item, we will update the following fields:
- Name:
VM {#VM} CPU total - Key:
kubevirt.vm.cpu.request[{#NAMESPACE},{#VM}] - Type of Information:
Numeric (unsigned) - Query fields: Promql to collect CPU Total from VMs
- Name:
query - Value:
max by (namespace, name) (kubevirt_vm_resource_requests{resource="cpu", name="{#VM}", namespace="{#NAMESPACE}"} )
- Name:
Note
The remaining fields should remain the same.
Click on Preprocessing > Add. In Name, select JSONPath.
Click Parameters and add the value $.data.result[0].value[1].
Click Add to save our preprocessing and click Add again to save our item.
Repeat the cloning process and add the following items.
Memory usage:
- Name:
VM {#VM} Memory Usage - Key:
kubevirt.vm.memory[{#NAMESPACE},{#VM}] - Type of Information:
Numeric (unsigned) - Query fields: Promql to collect Memory Usage from VMs
- Name:
query - Value:
sum by (name,namespace)(kubevirt_vmi_memory_used_bytes{name="{#VM}",namespace="{#NAMESPACE}"})
- Name:
In Preprocessing, select JavaScript and in parameter, add the following script:
var obj = JSON.parse(value);

if (obj.data.result.length === 0) {
  return 0;
    }

return obj.data.result[0].value[1];
Memory total:
- Name:
VM {#VM} Memory total - Key:
kubevirt.vm.mem.request[{#NAMESPACE},{#VM}] - Type of Information:
Numeric (float) - Query fields: Promql to collect memory total from VMs
- Name:
query - Value:
max by (namespace, name)(kubevirt_vm_resource_requests{resource="memory", name="{#VM}", namespace="{#NAMESPACE}"})
- Name:
- In preprocessing, select JSONPath and add
$.data.result[0].value[1]in parameter.
For this use case, we will monitor: CPU, memory, network, and VM status. You must create all the items you deem necessary to monitor, according to the needs of the environment.
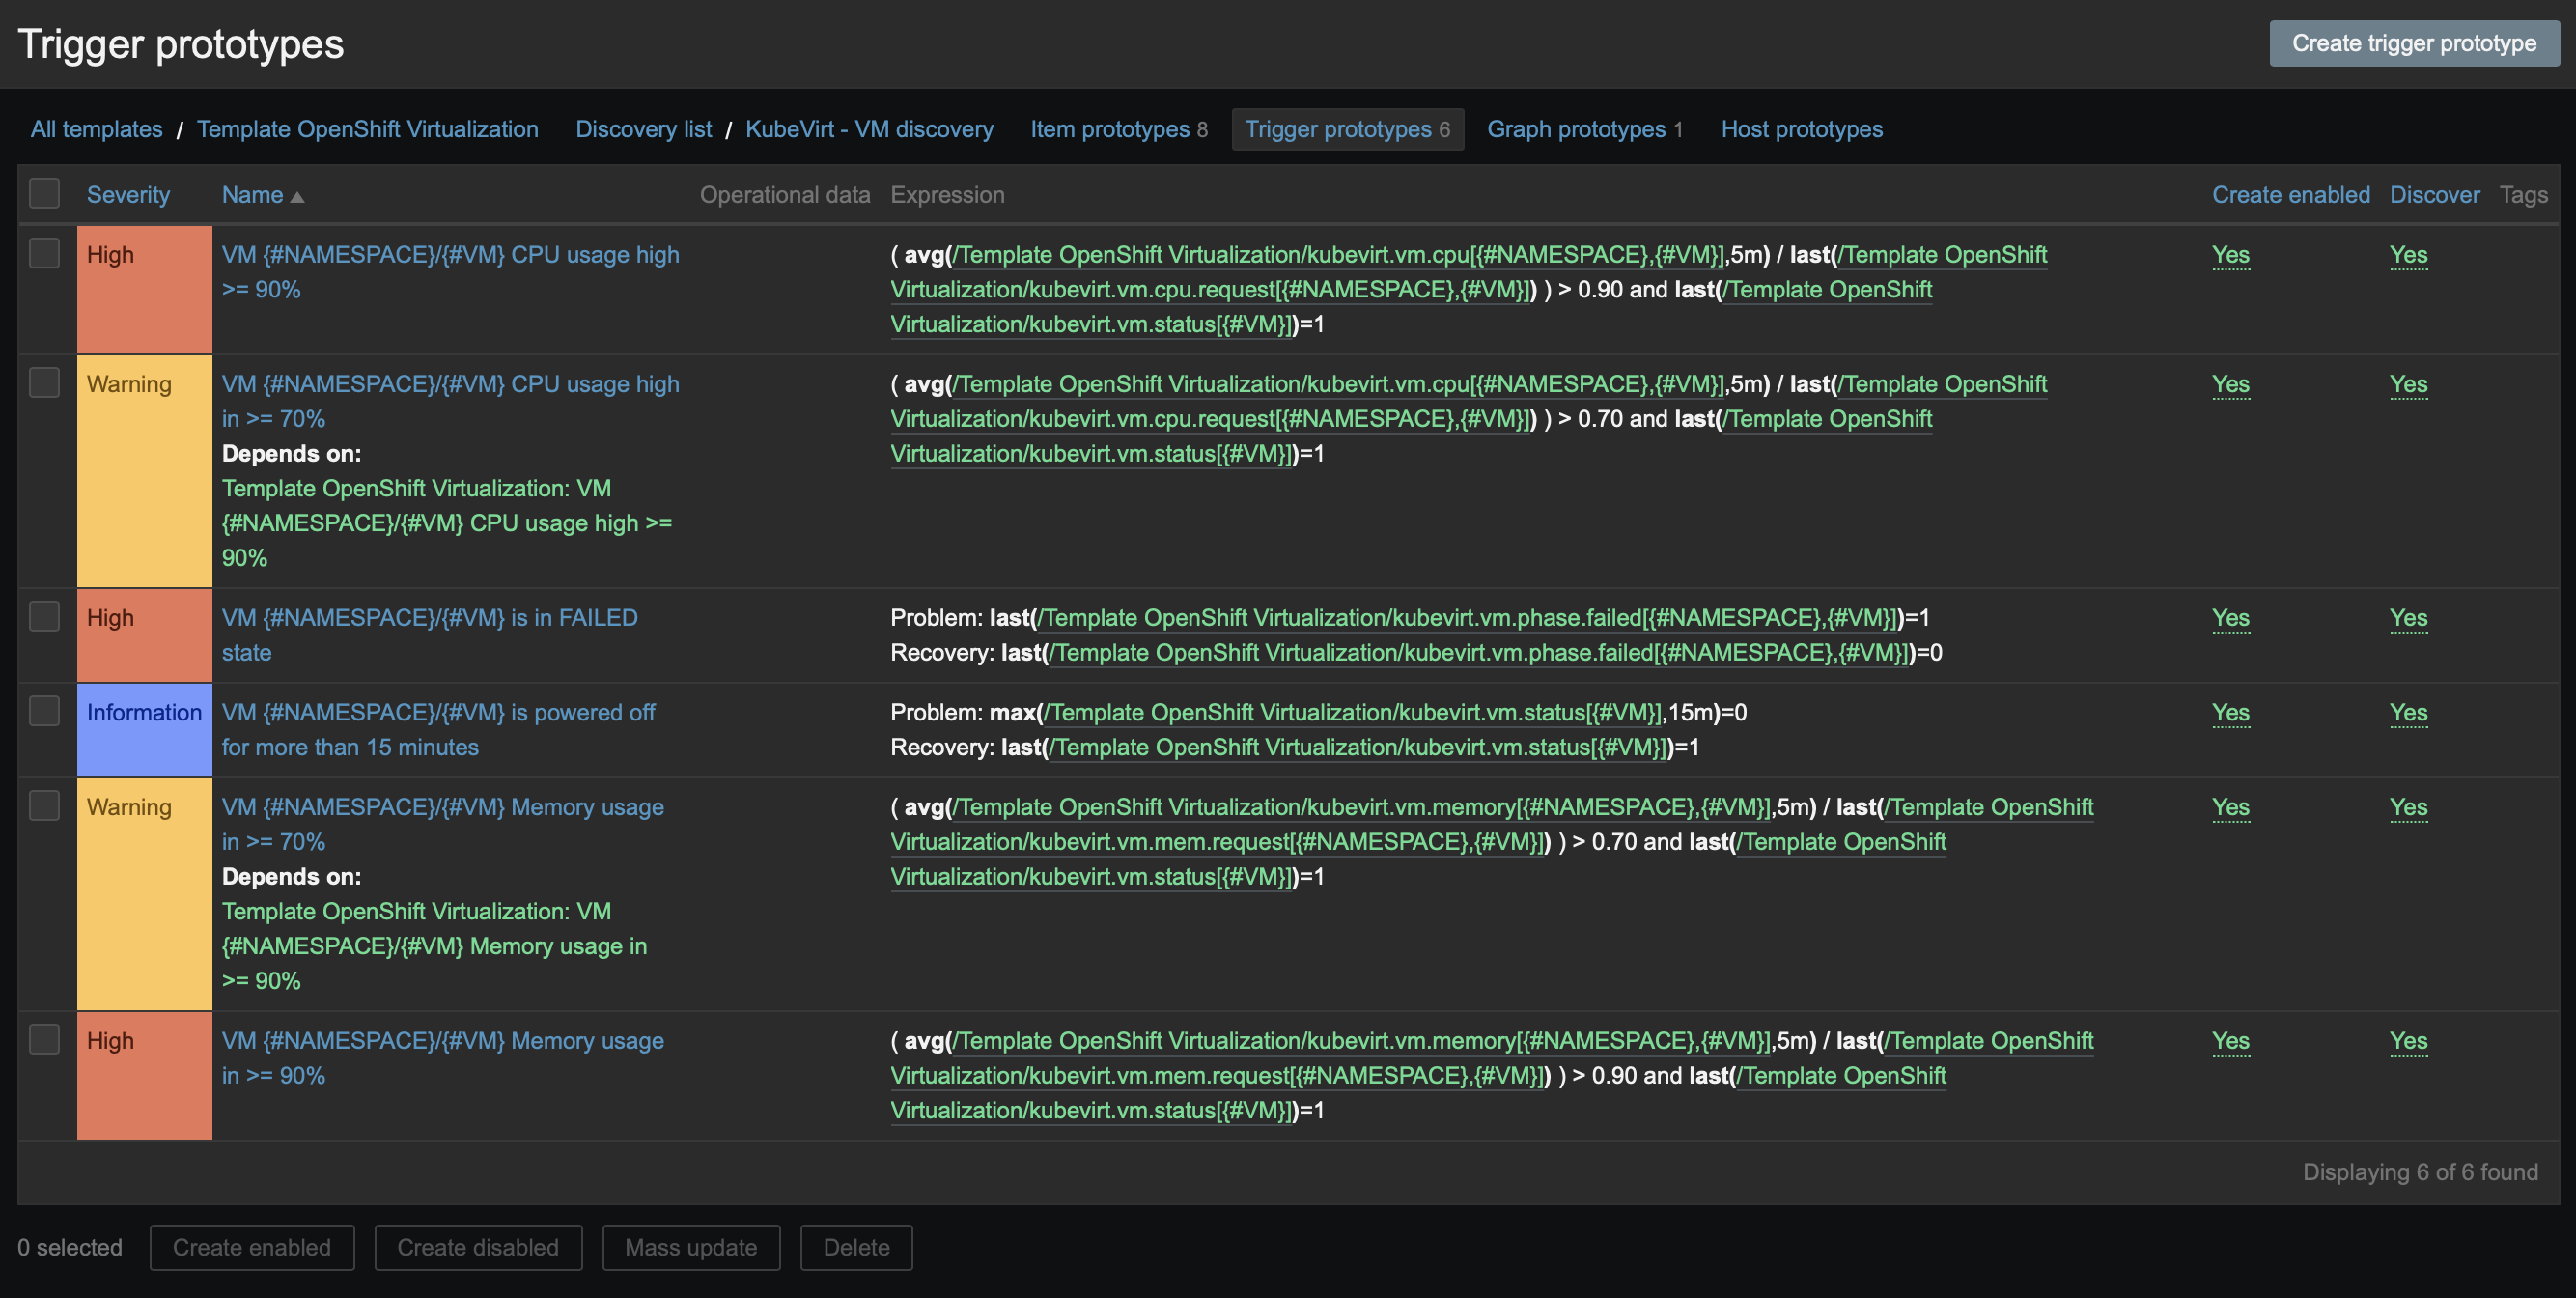
Create the trigger prototype
With the Trigger Prototype, we will create alerts based on the collected consumption items.
Now click on Trigger Prototype within the discovery rule created earlier or Configuration > Templates > Template Namecreated earlier > Discovery Rule created earlier > Trigger prototypes > Create trigger prototype
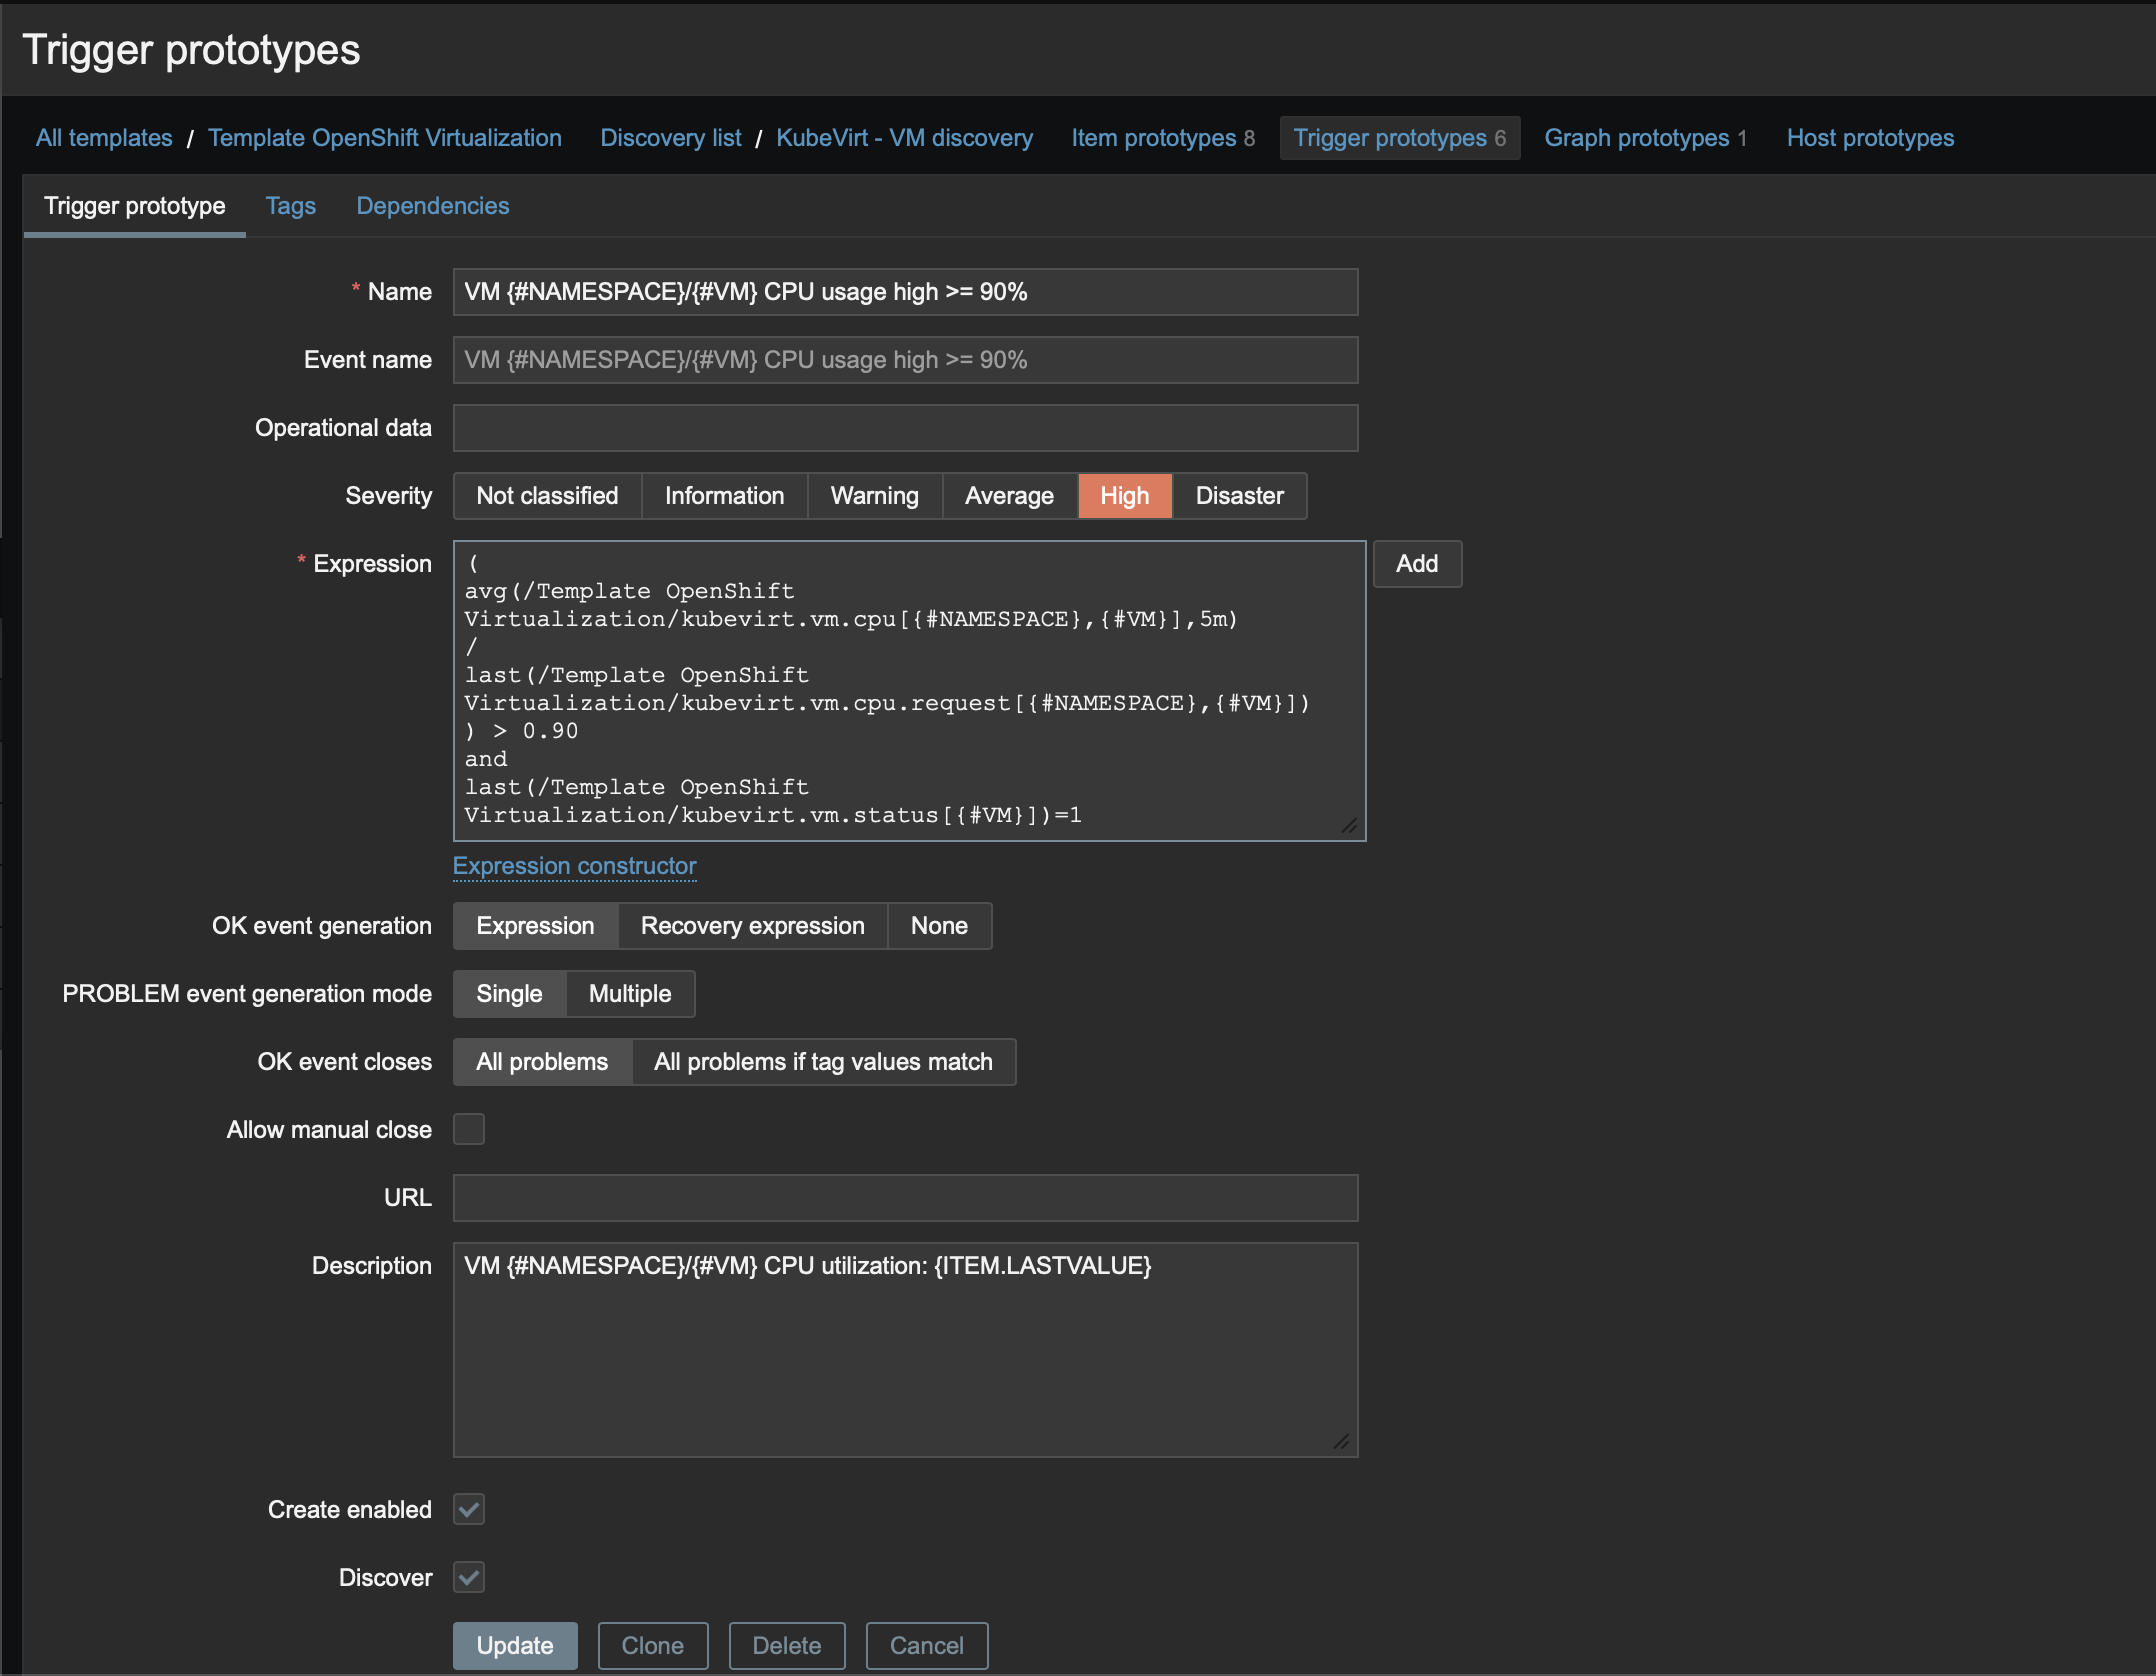
We will fill in the following fields:
- Name:
VM {#NAMESPACE}/{#VM} CPU usage high >= 90% - Severity:
High Expression:
( avg(/Template OpenShift Virtualization/kubevirt.vm.cpu[{#NAMESPACE},{#VM}],5m) / last(/Template OpenShift Virtualization/kubevirt.vm.cpu.request[{#NAMESPACE},{#VM}]) ) > 0.90 and last(/Template OpenShift Virtualization/kubevirt.vm.status[{#VM}])=1- Description:
VM {#NAMESPACE}/{#VM} CPU utilization: {ITEM.LASTVALUE}
Figure 4 illustrates the Zabbix trigger prototype.
Note
Repeat the cloning process, change the value from 0.90 to 0.70 for example, and create the alert with a Warning serverity level.
In this expression, we are dividing the total by the consumption, and the result needs to be greater than 0.90 (90%), ensuring that we only do this for the VMs that are running.
Create alerts with different severities, according to the items that were discovered (Figure 5).
Create the graph prototype
With Graph Prototype, we can create specific graphs, such as a network graph.
Click on Graph Prototype within the discovery rule created earlier or Configuration > Templates > Template Name created earlier > Discovery Rule created earlier > Graph prototypes > Create graph prototype.
Fill in the following fields:
- Name:
VM {#NAMESPACE}/{#VM} Network throughput - Items:
- Add prototype:
- Select the prototype items created for network RX and TX.
- Add prototype:
After adding the items, change the Function field to avg, adjust the item colors as desired, and click Add.
Create discovery rule (LLD) for VMs
Now, to make our monitoring more complete, let's create an LLD of nodes for virtualization. That is, nodes where the VMs run.
In the left side menu, click on Configuration > Templates
Click on the template we created earlier.
Click on Discovery rules in the top tab.
Then click on Create discovery rule.
Fill in the following fields as follows:
- Name: OpenShift - Node discovery
- Type: Select
HTTP agent - Key: openshift.node.discovery
- URL:
{$PROM_URL}/api/v1/query - Query fields: This field is responsible for passing our query promql to the endpoint in the URL field.
- Name:
query - Value:
count by (node) (kube_node_labels{label_kubevirt_io_schedulable="true"})
- Name:
- Headers: Here we will add our token for authentication to the API using our Token Macro.
- Name:
Authorization - Value:
Bearer {$PROM_TOKEN}
- Name:
- Update interval:
1h, this is the frequency at which our VM discovery will be run, to discover new VMs.
Click on Preprocessing > Add.
In Name, select Javascript.
Click on Parameters and add the following script:
var obj = JSON.parse(value);
var out = [];

for (var i = 0; i < obj.data.result.length; i++) {
  out.push({ "{#NODE}": obj.data.result[i].metric.node });
}

return JSON.stringify({ "data": out });
Note
This script will process all the output and filter only the following information: NODE Name, already creating Macros (variables) for later use.
To validate that our Preprocessing is working correctly, click Test all steps (Figure 6).
Check the Get value from host box and add the Macros values, adding the Thanos endpoint and the bearer token. Then click Get value and test.
Click Add to save our preprocessing and click Add again to save the item.
Create the item prototype
With the LLD of nodes, we can also create ITEM Prototype such as CPU, memory, network, uptime, and phase using the discovery rule's Macros (variables), NODE.
Now click on Item Prototype within the discovery rule created earlier or Configuration > Templates > Template Name created earlier > Discovery Rule created earlier > Item prototypes > Create Item prototype.
Fill in the following fields:
- Name:
Node {#NODE} Ready status - Type: Select
HTTP agent - Key:
node.ready[{#NODE}] - Type of Information:
Numeric (unsigned) - URL:
{$PROM_URL}/api/v1/query - Query fields: Promql to collect CPU usage from VMs
- Name:
query - Value:
max by (node) (kube_node_status_condition{ condition="Ready", status="true", node="{#NODE}" })
- Name:
- Headers: Here we will add our token for authentication to the API using our token macro.
- Name:
Authorization - Value:
Bearer {$PROM_TOKEN}
- Name:
- Update interval:
30s, this is how often our item will be collected.
Click on Preprocessing > Add
In Name, select Javascript.
Click on Parameters and add the following script:
var obj = JSON.parse(value);

if (obj.data.result.length === 0) return 0;

return obj.data.result[0].value[1];
Note
This JavaScript will simply ensure that we get 0 as a return value if it's null or if the value is different from what's expected.
Click Add to save our preprocessing and click Add again to save the item. Repeat the previous steps to create new items, triggers, and graph prototypes.
In this LLD, we create items and triggers for the CPU, memory, network, boot time and ready status. Download the XML template if needed by clicking this link.
Important
This is not a complete template. You should use it as a base and customize according to the environment/cluster.
Viewing the collected items
Now that we have created our host cluster and template with the LLDs and their items, let's check if the data was collected correctly by going to Monitoring > Latest Data.
Figure 7 shows the items collected by LLD KubeVirt - VM discovery.
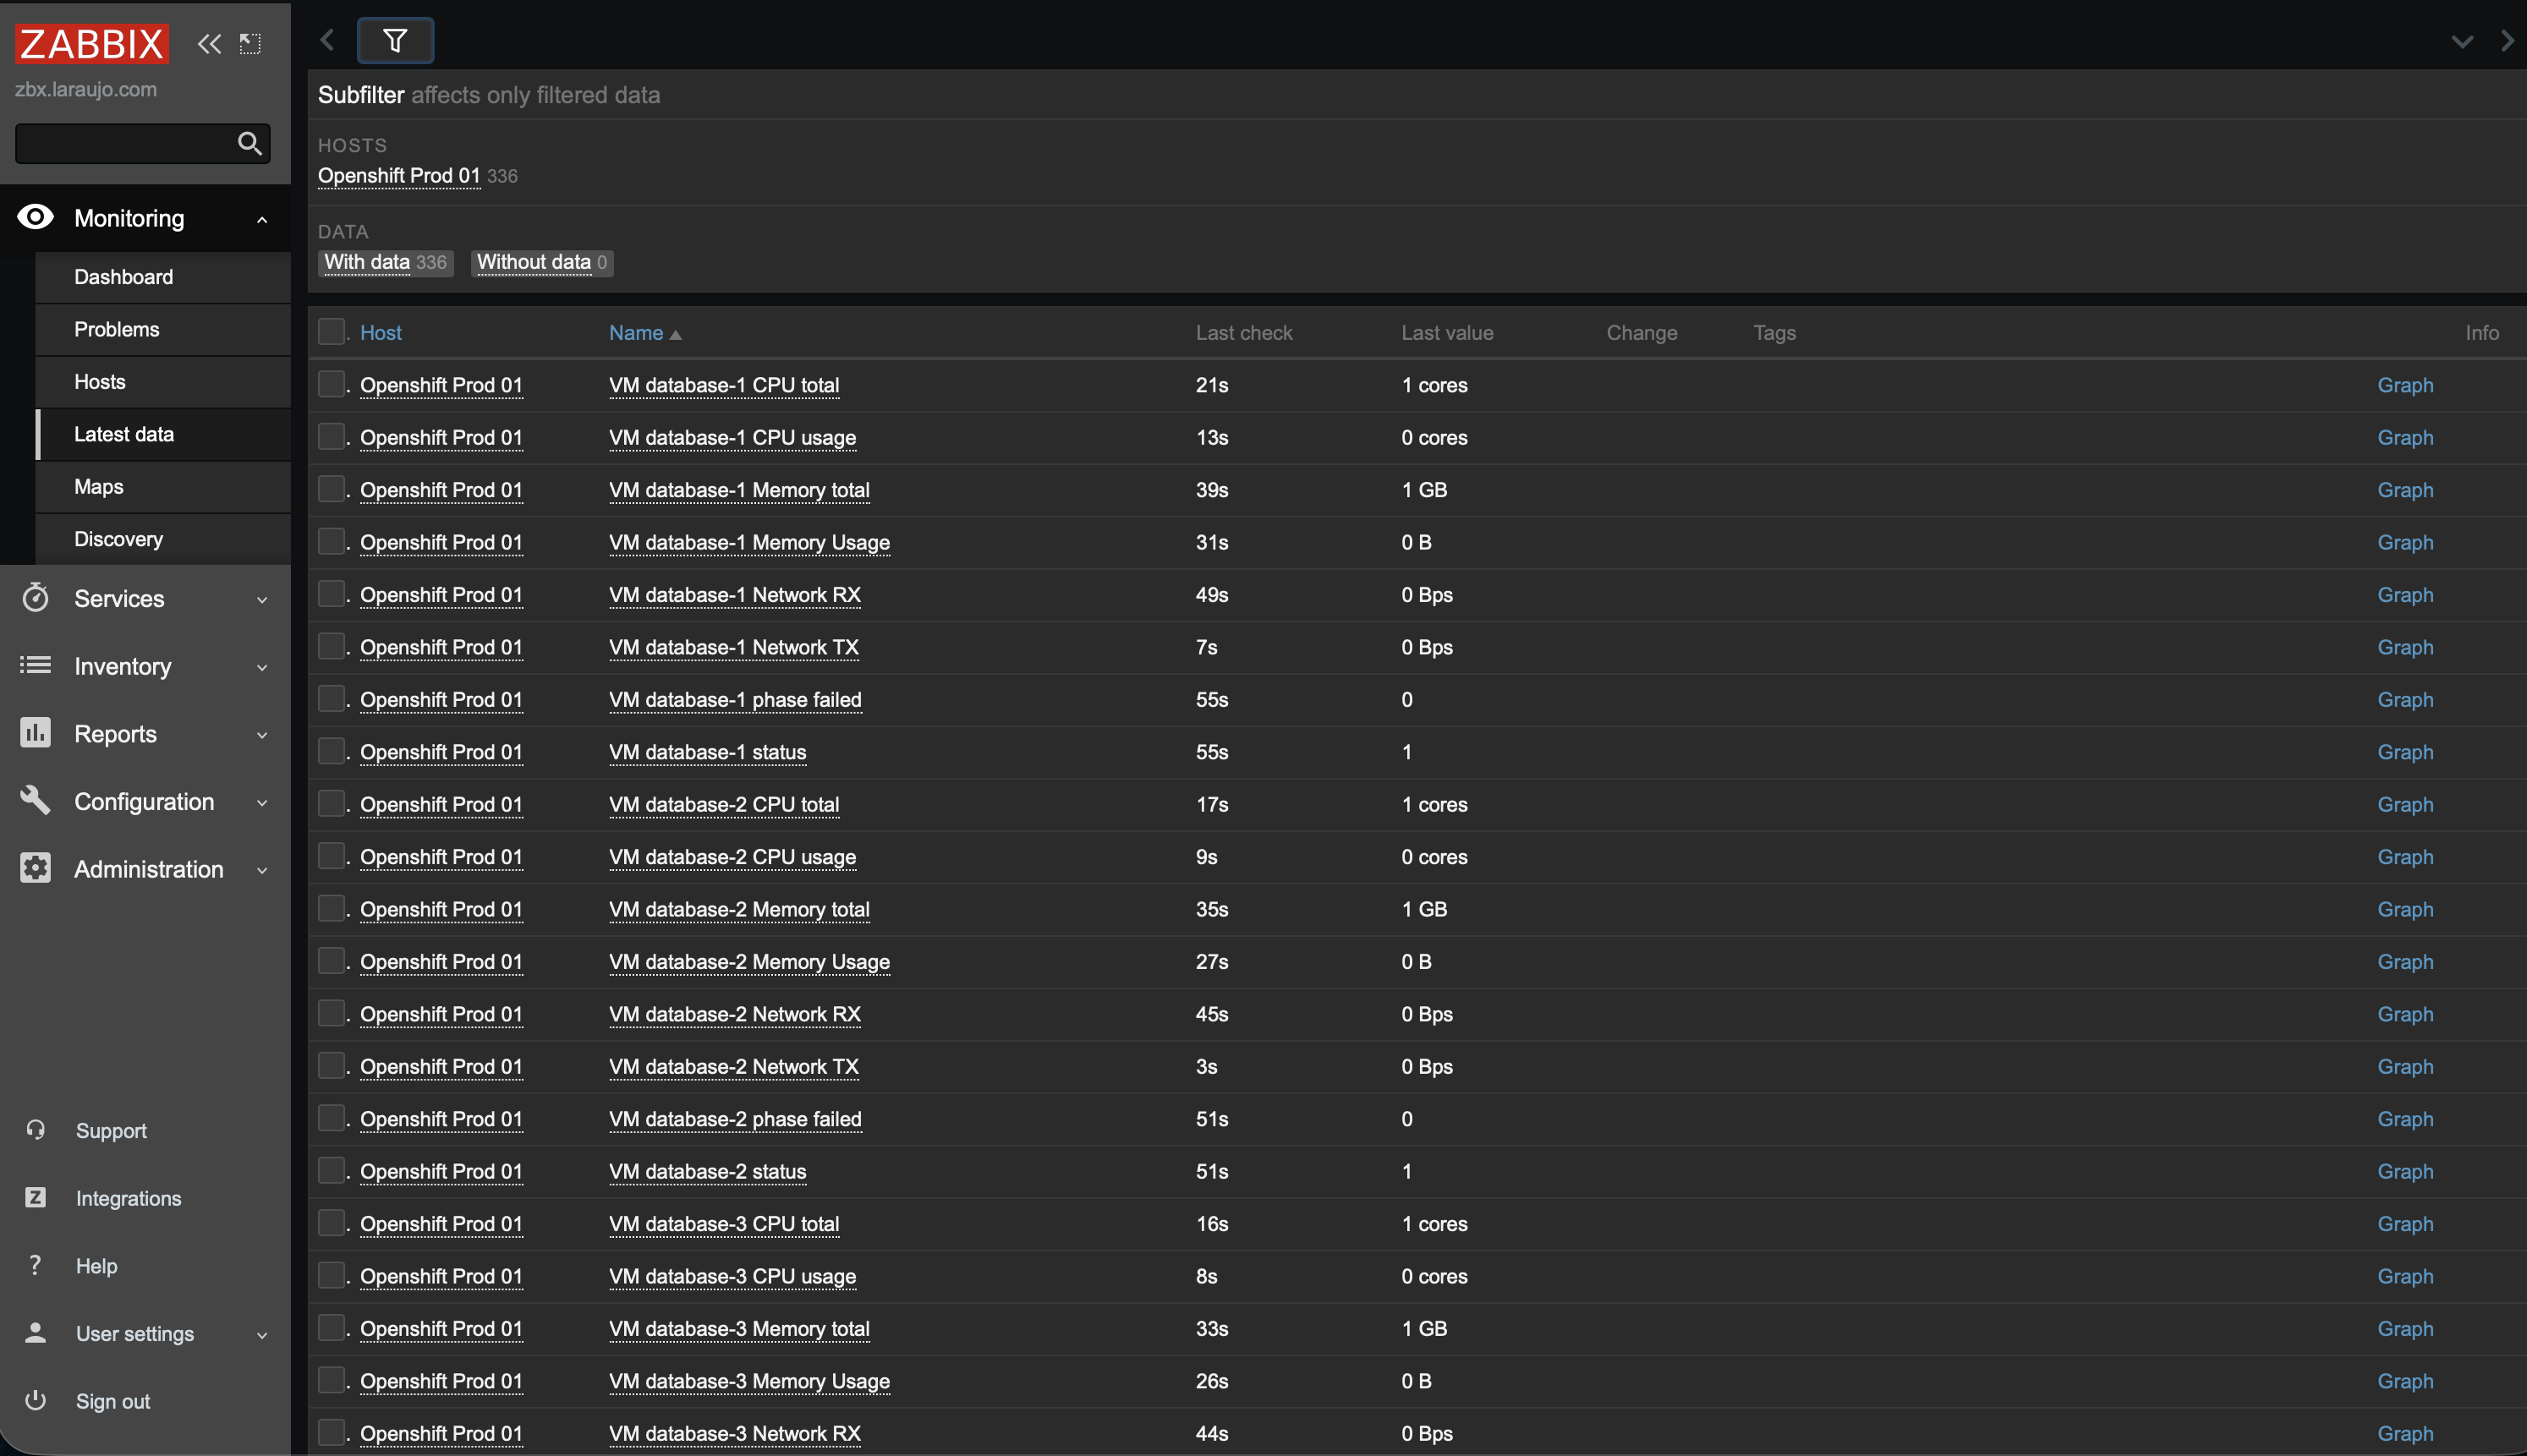
Figure 8 shows the items collected by LLD OpenShift - Node discovery.

Note
It's important to note that the "Without data" filter is set to 0, meaning all items are being collected correctly.
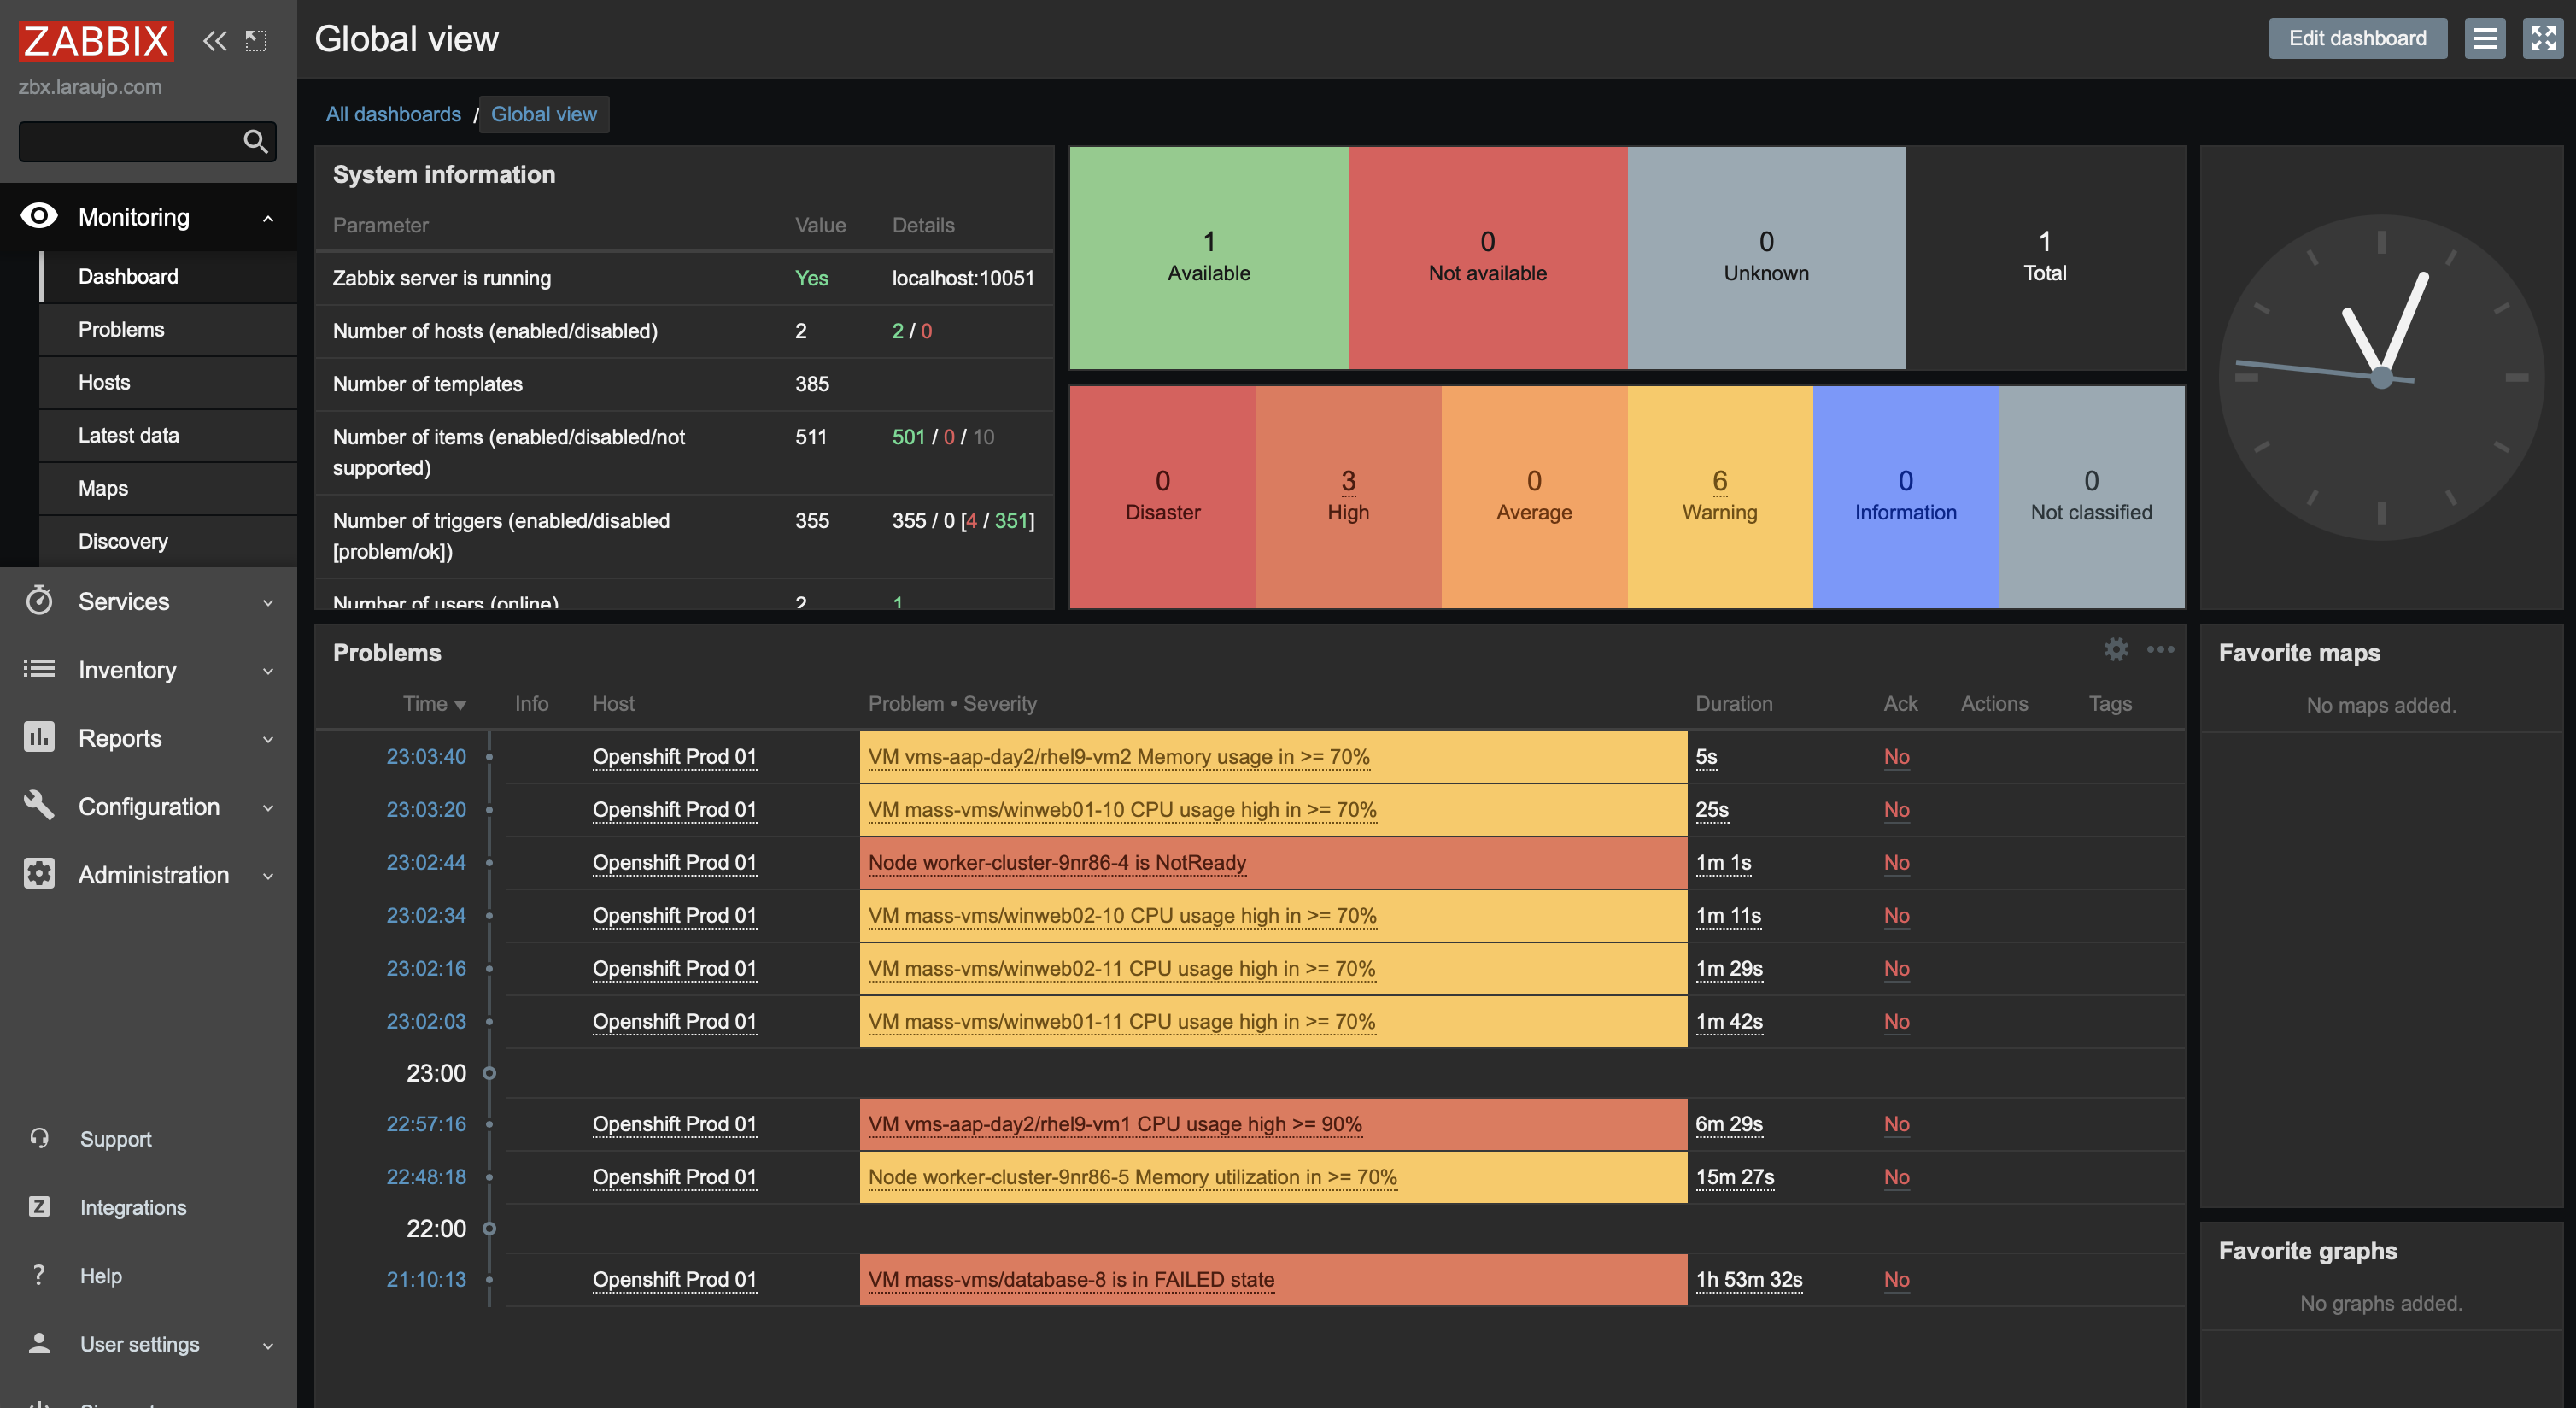
With all our items collected correctly, we can view our dashboard and identify if there are any active alerts (Figure 9).
Wrap up
Monitoring OpenShift Virtualization with Zabbix demonstrates how easily external tools can integrate with the platform's native observability stack. By using Prometheus and Thanos, OpenShift Virtualization exposes comprehensive metrics that can be consumed by Zabbix through simple HTTP queries.
This enables effective monitoring of virtual machines and infrastructure without additional agents, using features such as LLD for dynamic discovery and automation. Ultimately, this approach combines the flexibility of Zabbix with the power of OpenShift Virtualization's integrated monitoring, providing a scalable and efficient solution for modern environments.
For more details and other configurations, start with these reference documents: