If your team has fully embraced CI/CD on Red Hat OpenShift, you already know the capability of Red Hat OpenShift Pipelines. Built on the open source Tekton framework, it allows developers to create cloud-native, execution-ready pipelines that run in isolated, ephemeral containers. But there’s a catch. When you scale up, you inevitably run into the reality of high-churn build clusters.
In high-churn environments, thousands of pods spin up, execute a task, and terminate within minutes. While this is great for resource efficiency, it is an absolute nightmare for observability and compliance. Ephemeral pods mean ephemeral logs. If a build fails, or worse, if an auditor asks for the pipeline results from six months ago, those logs and event traces are long gone. OpenShift Pipelines added Tekton results to mitigate the situation within OpenShift Pipelines.
The high churn dilemma
You can use the Red Hat build of OpenTelemetry to capture, enhance, and route your pipeline logs for local troubleshooting and long-term, compliance-grade remote storage keeping OpenShift Pipeline results effective.
As illustrated in Figure 1, the Red Hat build of OpenTelemetry pipeline captures and routes essential telemetry data to Splunk-HEC for compliance-grade storage.
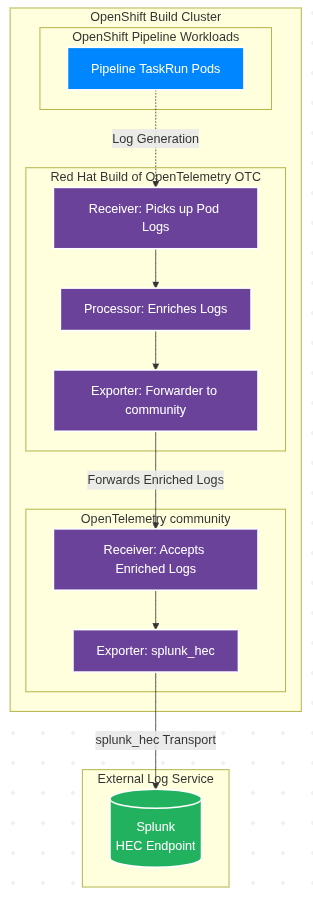
In a standard OpenShift Pipelines architecture, every PipelineRun triggers a series of TaskRuns, which spin up pods.
In a high-churn cluster, the following happens:
- Pods vanish quickly: Once a task is complete, the pod terminates.
- Node rotation is frequent: Autoscalers frequently spin up and tear down worker nodes to handle build spikes, taking local log files with them.
- Context is lost: Raw container logs often lack the necessary metadata (e.g., Git commit SHAs, pipeline trigger IDs, or specific pipeline results) to make them easily searchable.
The compliance mandate is that many regulated industries require you to keep all software build logs and deployment events in immutable, long-term storage for years. Relying on default OpenShift log rotation simply won't cut it.
The solution: Red Hat build of OpenTelemetry
The Red Hat build of OpenTelemetry provides a vendor-neutral, standardized way to collect, process, and export telemetry data (e.g., metrics, traces, and logs). By deploying the OpenTelemetry collector in your OpenShift cluster, you can intercept pipeline telemetry before the pods disappear.
Enhance logs with pipeline events
Simply capturing standard output (stdout) from a build pod is not enough. To make logs useful for long-term auditing, they need context. You can configure the OpenTelemetry collector to enrich raw logs with specific OpenShift and Tekton events.
The enrichment process works in a pipeline context as follows:
- Kubernetes attributes processor: The OpenTelemetry collector uses this processor to automatically append pod metadata (e.g., namespace, pod name, and node name) to the log stream.
- Tekton event integration: By capturing Kubernetes events tied to
PipelineRunandTaskRunstate changes, you can weave lifecycle events (e.g., started, failed, and succeeded) directly into the log stream. - Custom annotations: Developers can add annotations to their pipeline tasks. The OpenTelemetry collector can extract these annotations (e.g., application version, target environment, or security scan results) and attach them as key-value pairs to the exported log payload.
The storage strategy: Local vs. remote
One of the major strengths of the OpenTelemetry collector is the ability to fork telemetry data to multiple backends simultaneously using exporters. This allows you to satisfy the engineering team's need for fast, local troubleshooting and the security team's need for long-term compliance.
Local storage for fast troubleshooting
Developers need immediate access to pipeline results to fix broken builds.
- The workflow: The OpenTelemetry collector exports the enriched logs to your local OpenShift logging stack.
- The benefit: Developers can seamlessly query logs in the OpenShift Web Console. With logs enriched with Tekton metadata, a developer can simply search for
tekton_pipelinerun="release-build-123"to see all logs and events associated with that specific execution, regardless of how many pods were spun up and destroyed. - Retention: Short-term retention (7 to 14 days) to save on local expensive storage.
Remote storage for compliance and auditing
To meet regulatory requirements, you must securely preserve the same data stream off-cluster.
- The workflow: Concurrently, the OpenTelemetry collector forwards the enriched logs and pipeline results to a remote, enterprise-grade storage backend. This could be a SIEM (e.g., Splunk or Elastic) or highly durable object storage (e.g., AWS S3 or Azure Blob Storage).
- The benefit: You will get logs shipped to immutable, write-once-read-many (WORM) storage. Because the OpenTelemetry collector already enriched the data with OpenShift Pipeline events, auditors can easily reconstruct the exact sequence of events that led to a specific software release.
- Retention: Long-term retention (1 to 7+ years) dictated by your organizational compliance policies.
Implement the components to satisfy the requirements
Now we will discuss implementing the components to satisfy the requirements for OpenShift logging and OpenTelemetry.
NOTE: Red Hat does not support the OpenTelemetryCollector contrib image. The community supports it.
We need an OpenTelemetryCollector (OTC) to grab the pod logs and enrich the logs with values from the Kubernetes API. First, create a separate serviceAccount since we need to give some cluster-wide permissions to it in the Kubernetes API.
apiVersion: v1
kind: ServiceAccount
metadata:
  name: tekton
  namespace: openshift-logging
---
apiVersion: v1
kind: ServiceAccount
metadata:
  name: splunk-hec
  namespace: openshift-logging
Adjust the serviceAccount name if you choose a different one throughout all of the following resources.
Define the OpenTelemetryCollector and adjust as follows:
spec.exporters: otlphttp/lokistack/application: endpointspec.receivers: filelog/pipelines: include:To match only the namespace you want to collect- Adjust your ClusterLogForwarder’s to exclude the OTC included namespace to avoid duplication
Spec.receivers: k8s_events: namespaces:To match only the namespace you want to collectspec.env: CLUSTERIDspec.env: CLUSTERNAME
apiVersion: opentelemetry.io/v1beta1
kind: OpenTelemetryCollector
metadata:
  labels:
    mode: daemonset
  name: tekton
  namespace: openshift-logging
spec:
  additionalContainers:
    - image: docker.io/otel/opentelemetry-collector-contrib
      name: splunkhec
      resources: {}
      volumeMounts:
        - mountPath: /etc/otelcol-contrib/config.yaml
          name: splunkhec
          subPath: config.yaml
  config:
    exporters:
      debug:
        verbosity: detailed
      otlp/splunkhec:
        endpoint: http://localhost:14317
        tls:
          insecure: true
      otlphttp/lokistack/application:
        auth:
          authenticator: bearertokenauth
        endpoint: https://lokistack-gateway-http.openshift-logging.svc.cluster.local:8080/api/logs/v1/application/otlp # adjust the address to your LokiStack deployment
        retry_on_failure:
          enabled: true
          initial_interval: 60s
          max_elapsed_time: 600s
          max_interval: 120s
        sending_queue:
          block_on_overflow: false
          num_consumers: 20
          queue_size: 100000
        tls:
          ca_file: /var/run/secrets/kubernetes.io/serviceaccount/service-ca.crt
    extensions:
      bearertokenauth:
        filename: /var/run/secrets/kubernetes.io/serviceaccount/token
    processors:
      batch:
        send_batch_size: 1024
        timeout: 5s
      filter/pipelineruns_finished:
        error_mode: ignore
        logs:
          log_record:
            - log.body["type"] == "DELETED" or log.body["object"]["status"]["completionTime"]
              == nil or log.body["object"]["metadata"]["annotations"]["chains.tekton.dev/signed"]
              == nil
      k8sattributes:
        auth_type: serviceAccount
        extract:
          annotations:
            - from: pod
              key: tekton.dev/tags
              tag_name: tekton_tags
            - from: pod
              key: pipeline.openshift.io/started-by
              tag_name: tekton_started-by
            - from: pod
              key: tekton.dev/displayName
              tag_name: tekton_displayname
            - from: pod
              key: results.tekton.dev/record
              tag_name: tekton_results_record
            - from: pod
              key: results.tekton.dev/result
              tag_name: tekton_results_result
            - from: pod
              key: tekton.dev/categories
              tag_name: tekton_categories
            - from: pod
              key: pipeline.tekton.dev/affinity-assistant
              tag_name: tekton_affinity-assistant
          labels:
            - from: pod
              key: tekton.dev/pipeline
              tag_name: tekton_pipeline
            - from: pod
              key: tekton.dev/pipelineRun
              tag_name: tekton_pipelinerun
            - from: pod
              key: tekton.dev/task
              tag_name: tekton_task
            - from: pod
              key: tekton.dev/pipelineTask
              tag_name: tekton_pipelinetask
            - from: pod
              key: tekton.dev/taskRun
              tag_name: tekton_taskrun
            - from: pod
              key: tekton.dev/pipelineRunUID
              tag_name: tekton_pipelinerunuid
            - from: pod
              key: tekton.dev/taskRunUID
              tag_name: tekton_taskrunuid
          metadata:
            - k8s.pod.name
            - k8s.pod.uid
            - k8s.deployment.name
            - k8s.namespace.name
            - k8s.node.name
            - k8s.pod.start_time
            - service.namespace
            - service.name
            - service.version
            - service.instance.id
          otel_annotations: true
        filter:
          node_from_env_var: KUBE_NODE_NAME
        passthrough: false
        pod_association:
          - sources:
              - from: resource_attribute
                name: k8s.pod.uid
          - sources:
              - from: resource_attribute
                name: k8s.pod.name
              - from: resource_attribute
                name: k8s.namespace.name
          - sources:
              - from: resource_attribute
                name: k8s.object.name
              - from: resource_attribute
                name: k8s.namespace.name
      k8sattributes/events:
        auth_type: serviceAccount
        extract:
          annotations:
            - from: pod
              key: tekton.dev/tags
              tag_name: tekton_tags
            - from: pod
              key: pipeline.openshift.io/started-by
              tag_name: tekton_started-by
            - from: pod
              key: tekton.dev/displayName
              tag_name: tekton_displayname
            - from: pod
              key: results.tekton.dev/record
              tag_name: tekton_results_record
            - from: pod
              key: results.tekton.dev/result
              tag_name: tekton_results_result
            - from: pod
              key: tekton.dev/categories
              tag_name: tekton_categories
            - from: pod
              key: pipeline.tekton.dev/affinity-assistant
              tag_name: tekton_affinity-assistant
          labels:
            - from: pod
              key: tekton.dev/pipeline
              tag_name: tekton_pipeline
            - from: pod
              key: tekton.dev/pipelineRun
              tag_name: tekton_pipelinerun
            - from: pod
              key: tekton.dev/task
              tag_name: tekton_task
            - from: pod
              key: tekton.dev/pipelineTask
              tag_name: tekton_pipelinetask
            - from: pod
              key: tekton.dev/taskRun
              tag_name: tekton_taskrun
            - from: pod
              key: tekton.dev/pipelineRunUID
              tag_name: tekton_pipelinerunuid
        passthrough: false
        pod_association:
          - sources:
              - from: resource_attribute
                name: k8s.pod.uid
          - sources:
              - from: resource_attribute
                name: k8s.pod.name
              - from: resource_attribute
                name: k8s.namespace.name
      memory_limiter:
        check_interval: 1s
        limit_mib: 1500
      transform/clf:
        error_mode: ignore
        log_statements:
          - context: log
            statements:
              - set(log.attributes["openshift.log.type"], "application")
              - set(resource.attributes["openshift.log.type"], "application")
              - set(log.attributes["openshift.log.source"], "tekton")
              - set(resource.attributes["openshift.log.source"], "tekton")
              - set(log.attributes["kubernetes.namespace_name"], log.attributes["k8s.namespace.name"])
              - set(resource.attributes["kubernetes.namespace_name"], log.attributes["k8s.namespace.name"])
              - set(log.attributes["log.type"], log.attributes["application"])
              - set(resource.attributes["log.type"], log.attributes["application"])
              - set(log.attributes["log.source"], log.attributes["tekton"])
              - set(resource.attributes["log.source"], log.attributes["tekton"])
              - set(log.attributes["openshift.cluster.name"], "${CLUSTERNAME}")
              - set(resource.attributes["openshift.cluster.name"], "${CLUSTERNAME}")
      transform/k8sattributes:
        error_mode: ignore
        log_statements:
          - merge_maps(log.attributes, resource.attributes, "upsert")
      transform/pipelinerun_status:
        error_mode: ignore
        log_statements:
          - context: log
            statements:
              - set(log.attributes["k8s.namespace.name"], log.body["object"]["metadata"]["namespace"])
              - set(log.attributes["k8s.object.name"], log.body["object"]["metadata"]["name"])
              - set(log.attributes["k8s.object.uid"], log.body["object"]["metadata"]["uid"])
              - set(log.attributes["k8s.object.kind"], "PipelineRun")
              - set(log.attributes["tekton_pipelinerun"], log.body["object"]["metadata"]["name"])
              - set(log.attributes["tekton_pipelinerunuid"], log.body["object"]["metadata"]["uid"])
              - set(log.attributes["tekton_pipeline"], log.body["object"]["metadata"]["labels"]["tekton.dev/pipeline"])
              - set(log.attributes["tekton_tags"], log.body["object"]["metadata"]["annotations"]["tekton.dev/tags"])
              - set(log.attributes["tekton_started-by"], log.body["object"]["metadata"]["annotations"]["pipeline.openshift.io/started-by"])
              - set(log.attributes["tekton_displayname"], log.body["object"]["metadata"]["annotations"]["tekton.dev/displayName"])
              - set(log.attributes["tekton_results_record"], log.body["object"]["metadata"]["annotations"]["results.tekton.dev/record"])
              - set(log.attributes["tekton_results_result"], log.body["object"]["metadata"]["annotations"]["results.tekton.dev/result"])
              - set(log.attributes["tekton_categories"], log.body["object"]["metadata"]["annotations"]["tekton.dev/categories"])
              - set(log.attributes["tekton_affinity-assistant"], log.body["object"]["metadata"]["annotations"]["pipeline.tekton.dev/affinity-assistant"])
              - set(log.body, log.body["object"]["status"])
              - set(log.attributes["otc.node_name"], "${KUBE_NODE_NAME}")
      transform/tekton_assistant:
        error_mode: ignore
        log_statements:
          - set(log.attributes["tekton_task"], "affinity-assistant") where log.attributes["tekton_pipelinerun"]
            != nil and log.attributes["tekton_task"] == nil
          - set(log.attributes["tekton_pipelinetask"], "affinity-assistant") where
            log.attributes["tekton_pipelinerun"] != nil and log.attributes["tekton_pipelinetask"]
            == nil
      transform/tekton_pod_lookup:
        error_mode: ignore
        log_statements:
          - conditions:
              - resource.attributes["k8s.object.kind"] == "Pod"
            context: resource
            statements:
              - set(resource.attributes["k8s.pod.uid"], resource.attributes["k8s.object.uid"])
              - set(resource.attributes["k8s.pod.name"], resource.attributes["k8s.object.name"])
          - conditions:
              - resource.attributes["k8s.object.kind"] == "TaskRun"
            context: resource
            statements:
              - set(resource.attributes["k8s.pod.name"], Concat([resource.attributes["k8s.object.name"],
                "-pod"], ""))
      transform/tekton_splunk_lookup:
        error_mode: ignore
        log_statements:
          - context: log
            statements:
              - set(resource.attributes["kubernetes.labels.tekton_dev_taskRunUID"],
                log.attributes["tekton_taskrunuid"]) where log.attributes["tekton_taskrunuid"]
                != nil
              - set(log.attributes["kubernetes.labels.tekton_dev_taskRunUID"], log.attributes["tekton_taskrunuid"])
                where log.attributes["tekton_taskrunuid"] != nil
              - set(resource.attributes["kubernetes.labels.tekton_dev_piplelineRunUID"],
                log.attributes["tekton_pipelinerunuid"]) where log.attributes["tekton_pipelinerunuid"]
                != nil
              - set(log.attributes["kubernetes.labels.tekton_dev_piplelineRunUID"],
                log.attributes["tekton_pipelinerunuid"]) where log.attributes["tekton_pipelinerunuid"]
                != nil
              - set(log.attributes["kubernetes_namespace_name"], log.attributes["k8s.namespace.name"])
                where log.attributes["k8s.namespace.name"] != nil
              - set(log.attributes["kubernetes.container_name"], log.attributes["k8s.container.name"])
              - set(log.attributes["message"], log.attributes["msg"]) where log.attributes["message"]
                == nil
              - set(log.attributes["message"], log.body) where log.attributes["message"]
                == nil
    receivers:
      filelog/pipelines:
        exclude:
          - /var/log/pods/*/otel-collector/*.log
          - /var/log/pods/*/otc-container/*.log
        include:
          - /var/log/pods/*/*/*.log # adjust the list to match your build namespaces
        include_file_name: false
        include_file_path: true
        operators:
          - type: container
          - from: attributes["k8s.pod.name"]
            if: attributes["k8s.pod.name"] != nil
            to: resource["k8s.pod.name"]
            type: move
          - from: attributes["k8s.namespace.name"]
            if: attributes["k8s.namespace.name"] != nil
            to: resource["k8s.namespace.name"]
            type: move
          - from: attributes["k8s.pod.uid"]
            if: attributes["k8s.pod.uid"] != nil
            to: resource["k8s.pod.uid"]
            type: move
        start_at: end
      k8s_events:
        auth_type: serviceAccount
        namespaces:
          - ... # adjust the list to match your build namespaces
      k8sobjects/pipelineruns:
        auth_type: serviceAccount
        objects:
          - group: tekton.dev
            mode: watch
            name: pipelineruns
    service:
      extensions:
        - bearertokenauth
      pipelines:
        logs:
          exporters:
            - otlphttp/lokistack/application
            - otlp/splunkhec
          processors:
            - memory_limiter
            - k8sattributes
            - transform/k8sattributes
            - transform/clf
            - transform/tekton_splunk_lookup
            - transform/tekton_assistant
            - batch
          receivers:
            - filelog/pipelines
        logs/events:
          exporters:
            - otlphttp/lokistack/application
            - otlp/splunkhec
          processors:
            - memory_limiter
            - transform/tekton_pod_lookup
            - k8sattributes/events
            - transform/k8sattributes
            - transform/clf
            - transform/tekton_splunk_lookup
            - transform/tekton_assistant
            - batch
          receivers:
            - k8s_events
        logs/pipelineruns:
          exporters:
            - otlp/splunkhec
            - otlphttp/lokistack/application
          processors:
            - memory_limiter
            - transform/pipelinerun_status
            - transform/k8sattributes
            - transform/clf
            - transform/tekton_splunk_lookup
            - transform/tekton_assistant
            - batch
          receivers:
            - k8sobjects/pipelineruns
      telemetry:
        metrics:
          readers:
            - pull:
                exporter:
                  prometheus:
                    host: 0.0.0.0
                    port: 8888
  configVersions: 3
  daemonSetUpdateStrategy: {}
  deploymentUpdateStrategy: {}
  env:
    - name: KUBE_NODE_NAME
      valueFrom:
        fieldRef:
          apiVersion: v1
          fieldPath: spec.nodeName
    - name: CLUSTERID
      value: ... # oc get ClusterVersion version -o jsonpath='{.spec.clusterID}'
    - name: CLUSTERNAME
      value: <human-friendly-name>
  mode: daemonset
  podAnnotations:
    kubectl.kubernetes.io/default-container: otc-container
    openshift.io/required-scc: otel-clusterlogs-collector-scc
  securityContext:
    allowPrivilegeEscalation: false
    capabilities:
      drop:
        - CHOWN
        - DAC_OVERRIDE
        - FOWNER
        - FSETID
        - KILL
        - NET_BIND_SERVICE
        - SETGID
        - SETPCAP
        - SETUID
    readOnlyRootFilesystem: true
    runAsGroup: 0
    runAsUser: 0
    seLinuxOptions:
      type: spc_t
    seccompProfile:
      type: RuntimeDefault
  serviceAccount: tekton
  volumeMounts:
    - mountPath: /var/log
      name: varlogpods
  volumes:
    - hostPath:
        path: /var/log
      name: varlogpods
    - configMap:
        name: splunkhec
      name: splunkhec
The security context constraint (SCC) will grant the collector the permissions to read the pod logs accordingly.
allowHostDirVolumePlugin: true
allowHostIPC: false
allowHostNetwork: false
allowHostPID: false
allowHostPorts: false
allowPrivilegeEscalation: false
allowPrivilegedContainer: false
allowedCapabilities: null
apiVersion: security.openshift.io/v1
defaultAddCapabilities: null
defaultAllowPrivilegeEscalation: false
forbiddenSysctls:
  - '*'
fsGroup:
  type: RunAsAny
groups: []
kind: SecurityContextConstraints
metadata:
  name: otel-clusterlogs-collector-scc
priority: null
readOnlyRootFilesystem: true
requiredDropCapabilities:
  - ALL
runAsUser:
  type: RunAsAny
seLinuxContext:
  type: RunAsAny
seccompProfiles:
  - runtime/default
supplementalGroups:
  type: RunAsAny
users: []
volumes:
  - configMap
  - emptyDir
  - hostPath
  - projected
  - secret
We also require an additional ClusterRole and RoleBinding to grant our collector access to the KubeAPI to enrich the logs with pod resources.
apiVersion: rbac.authorization.k8s.io/v1
kind: ClusterRole
metadata:
  creationTimestamp: null
  name: system:openshift:scc:otel-clusterlogs-collector-scc
rules:
- apiGroups:
  - security.openshift.io
  resourceNames:
  - otel-clusterlogs-collector-scc
  resources:
  - securitycontextconstraints
  verbs:
  - use
---
apiVersion: rbac.authorization.k8s.io/v1
kind: RoleBinding
metadata:
  creationTimestamp: null
  name: system:openshift:scc:otel-clusterlogs-collector-scc
  namespace: openshift-logging
roleRef:
  apiGroup: rbac.authorization.k8s.io
  kind: ClusterRole
  name: system:openshift:scc:otel-clusterlogs-collector-scc
subjects:
- kind: ServiceAccount
  name: tekton
  namespace: openshift-logging
---
apiVersion: rbac.authorization.k8s.io/v1
kind: ClusterRole
metadata:
  name: tekton-collector
rules:
  - apiGroups:
      - ''
    resources:
      - pods
      - namespaces
      - nodes
      - events
    verbs:
      - get
      - watch
      - list
  - apiGroups:
      - apps
    resources:
      - replicasets
      - deployments
      - statefulsets
      - daemonsets
    verbs:
      - get
      - list
      - watch
  - apiGroups:
      - batch
    resources:
      - jobs
    verbs:
      - get
      - list
      - watch
  - apiGroups:
      - tekton.dev
    resources:
      - pipelineruns
    verbs:
      - get
      - list
      - watch
  - apiGroups:
      - extensions
    resources:
      - replicasets
    verbs:
      - get
      - list
      - watch
---
apiVersion: rbac.authorization.k8s.io/v1
kind: ClusterRoleBinding
metadata:
  name: tekton-collector
roleRef:
  apiGroup: rbac.authorization.k8s.io
  kind: ClusterRole
  name: tekton-collector
subjects:
  - kind: ServiceAccount
    name: tekton
    namespace: openshift-logging
---
apiVersion: rbac.authorization.k8s.io/v1
kind: RoleBinding
metadata:
  creationTimestamp: null
  name: system:openshift:scc:anyuid
  namespace: openshift-logging
roleRef:
  apiGroup: rbac.authorization.k8s.io
  kind: ClusterRole
  name: system:openshift:scc:anyuid
subjects:
- kind: ServiceAccount
  name: splunk-hec
  namespace: openshift-logging
That ClusterRoles should give us access to:
- Pod, namespace, node, replicaset, daemonset, statefulset, job, pipeline and
TaskRunlabels and annotations - Running Splunk-HEC, which requires anyuid separated in deployment for that reason
The additionalContainer is using the community version of the OpenTelemetryContrib Collector for using the Splunk-HEC exporter since Splunk-HEC lacks an OTLP API that grants looking up the attributes without heavy modification of the Splunk-HEC configuration.
We will explain the Splunk-HEC example deployment in the following steps.
Note: The OTC will not start properly without the required Splunk-HEC configMap, which mounts and blocks startup if missing.
Restart the OTC daemonset with the following command:
oc -n openshift-logging rollout restart daemonset tekton-collectorConfigure Splunk-HEC as PoC for long-term storage
Configure the configMap that holds the community collector configuration and adjust:
data.config.yaml.exporters.splunk_hec: tokendata.config.yaml.exporters.splunk_hec: endpoint
apiVersion: v1
data:
  config.yaml: |
    exporters:
      debug:
        sampling_initial: 5
        sampling_thereafter: 200
        verbosity: detailed
      splunk_hec:
        token: 11111111-2222-3333-4444-555555555555
        endpoint: https://splunk-hec:8088/services/collector
        tls:
          insecure_skip_verify: true
        splunk_app_name: Tekton
        splunk_app_version: v0.0.1
        heartbeat:
          interval: 30s
        telemetry:
          enabled: false
          override_metrics_names:
            otelcol_exporter_splunkhec_heartbeats_sent: app_heartbeats_success_total
            otelcol_exporter_splunkhec_heartbeats_failed: app_heartbeats_failed_total
          extra_attributes:
            dataset_name: SplunkCloudBeaverStack
            custom_key: custom_value
    receivers:
      otlp:
        protocols:
          grpc:
            endpoint: 127.0.0.1:14317
    service:
      pipelines:
        logs:
          exporters:
            - splunk_hec
          receivers:
            - otlp
      telemetry:
        metrics:
          level: none
kind: ConfigMap
metadata:
  name: splunkhec
  namespace: openshift-logging
NOTE: The Splunk-HEC example does not carry a FQDN in the certificate, making the configuration in the exporter necessary to skip TLS verification.
The following is a Splunk-Hec deployment example. Be sure to adjust:
spec.template.spec.containers.env: SPLUNK_HEC_TOKEN- Expose the Splunk-HEC API Port which is by default not accessible
apiVersion: apps/v1
kind: Deployment
metadata:
  labels:
    app: splunk-hec
    app.kubernetes.io/component: splunk-hec
  name: splunk-hec
  namespace: openshift-logging
spec:
  progressDeadlineSeconds: 600
  replicas: 1
  revisionHistoryLimit: 0
  selector:
    matchLabels:
      app: splunk-hec
  strategy:
    rollingUpdate:
      maxSurge: 25%
      maxUnavailable: 25%
    type: RollingUpdate
  template:
    metadata:
      annotations:
        openshift.io/required-scc: anyuid
      creationTimestamp: null
      labels:
        app: splunk-hec
    spec:
      containers:
        - env:
            - name: SPLUNK_GENERAL_TERMS
              value: --accept-sgt-current-at-splunk-com
            - name: SPLUNK_START_ARGS
              value: --accept-license
            - name: SPLUNK_PASSWORD
              value: changeme
            - name: SPLUNK_HEC_TOKEN
              value: 11111111-2222-3333-4444-555555555555
            - name: SPLUNK_HEC_PORT
              value: '8088'
          image: docker.io/splunk/splunk:latest
          imagePullPolicy: IfNotPresent
          name: splunk-hec
          ports:
            - containerPort: 8000
              protocol: TCP
            - containerPort: 8088
              protocol: TCP
            - containerPort: 8089
              protocol: TCP
          resources:
            limits:
              cpu: '2'
              memory: 10Gi
            requests:
              cpu: 10m
              memory: 256Mi
          terminationMessagePath: /dev/termination-log
          terminationMessagePolicy: File
          volumeMounts:
            - mountPath: /opt/container_artifact
              name: splunk
            - mountPath: /.ansible
              name: ansible
            - mountPath: /opt/splunk/var
              name: spool
      dnsPolicy: ClusterFirst
      restartPolicy: Always
      schedulerName: default-scheduler
      securityContext:
        runAsGroup: 0
        runAsUser: 0
      serviceAccount: splunk-hec
      serviceAccountName: splunk-hec
      terminationGracePeriodSeconds: 3
      volumes:
        - configMap:
            defaultMode: 420
            name: consumer
            optional: true
          name: consumer
        - emptyDir: {}
          name: splunk
        - emptyDir: {}
          name: ansible
        - emptyDir: {}
          name: spool
Create the service for the Splunk-Hec deployment.
apiVersion: v1
kind: Service
metadata:
  name: splunk-hec
  namespace: openshift-logging
spec:
  internalTrafficPolicy: Cluster
  ipFamilies:
    - IPv4
  ipFamilyPolicy: SingleStack
  ports:
    - appProtocol: https
      name: admin
      port: 8000
      protocol: TCP
      targetPort: 8000
    - appProtocol: https
      name: hec
      port: 8088
      protocol: TCP
      targetPort: 8088
    - appProtocol: https
      name: api
      port: 8089
      protocol: TCP
      targetPort: 8089
  selector:
    app: splunk-hec
  sessionAffinity: None
  type: ClusterIP
We should now have a complete set of collectors and processors deployed to:
- Read the logs from the file system and enhance the logs with Kubernetes and pipeline attributes
- Forward the logs to the community collector on the loopback interface
- Use the community collector to receive the logs and transport them with the
splunk_hecexporter to the Splunk-HEC service deployed.
Configure OpenShift Pipelines
With the OpenTelemetry collector and Splunk-HEC service deployed, we can now configure the OpenShift Pipeline result to utilize the Splunk-HEC API endpoint to retrieve long-term stored logs for the builds in the cluster.
We need a reader bearer token from Splunk-HEC to access the Admin API.
NOTE: This is not the HEC token used for injecting logs.
To do so, you need to expose the Splunk-HEC HTTP endpoint, log in, and create a token as follows:
- Use the deployment configured credentials from the env section (admin/changeme).
- Click on Settings and Tokens in the User and Authentication section.
- Fill in the audience and click Create.
- Copy the token for the OpenShift Pipeline result configuration.
Apply the subsection to the TektonConfig CR in the cluster and adjust:
SPLUNK_SEARCH_TOKENLOGGING_PLUGIN_API_URLto match your Splunk-HEC deployment
spec:
  result:
    disabled: false
    is_external_db: false
    options:
      deployments:
        tekton-results-api:
          metadata:
            creationTimestamp: null
          spec:
            selector: null
            strategy: {}
            template:
              metadata:
                creationTimestamp: null
              spec:
                containers:
                  - env:
                      - name: LOGGING_PLUGIN_API_URL
                        value: https://splunk-hec.openshift-logging.svc.cluster.local:8089/
                      - name: LOGGING_PLUGIN_QUERY_PARAMS
                        value: index=main
                      - name: SPLUNK_SEARCH_TOKEN
                        value: <read-token-from-splunk-hec>
                      - name: LOGGING_PLUGIN_TLS_VERIFICATION_DISABLE
                        value: 'true'
                      #- name: LOGGING_PLUGIN_CA_CERT
                      #  value: "/etc/custom/certs/ca.crt"
                      - name: LOGS_API
                        value: 'true'
                      - name: LOGS_TYPE
                        value: Splunk
                      - name: SQL_LOG_LEVEL
                        value: debug
                    #volumeMounts:
                    #- name: customcerts
                    #  mountPath: /etc/custom/certs/ca.crt
                    #  subPath: ca.crt
                    name: api
                    resources: {}
                #volumes:
                #- configMap:
                #    name: customcertsca
                #  name: customcerts
          status: {}
    performance:
      disable-ha: false
    route_enabled: true
    route_tls_termination: edge
If you are running a full configured Splunk-HEC deployment with a custom Certificate Authority (CA), you can enable LOGGING_PLUGIN_TLS_VERIFICATION_DISABLE to false and enable the volumes and volumeMounts to get a full trusted TLS communication between the OpenShift Pipelines result and your long-term log storage system.
After applying the changes, the OpenShift Pipelines operator will reconcile the result pods accordingly.
Run the pipelines
Let’s deploy a quick and simple pipeline.
apiVersion: tekton.dev/v1
kind: Pipeline
metadata:
name: testing
spec:
tasks:
- name: echo
params:
- name: SCRIPT
value: echo "I am comming from an Results"
- name: VERSION
value: latest
taskRef:
kind: Task
name: openshift-client
workspaces:
- name: workspace
- name: dockerconfig
- name: git
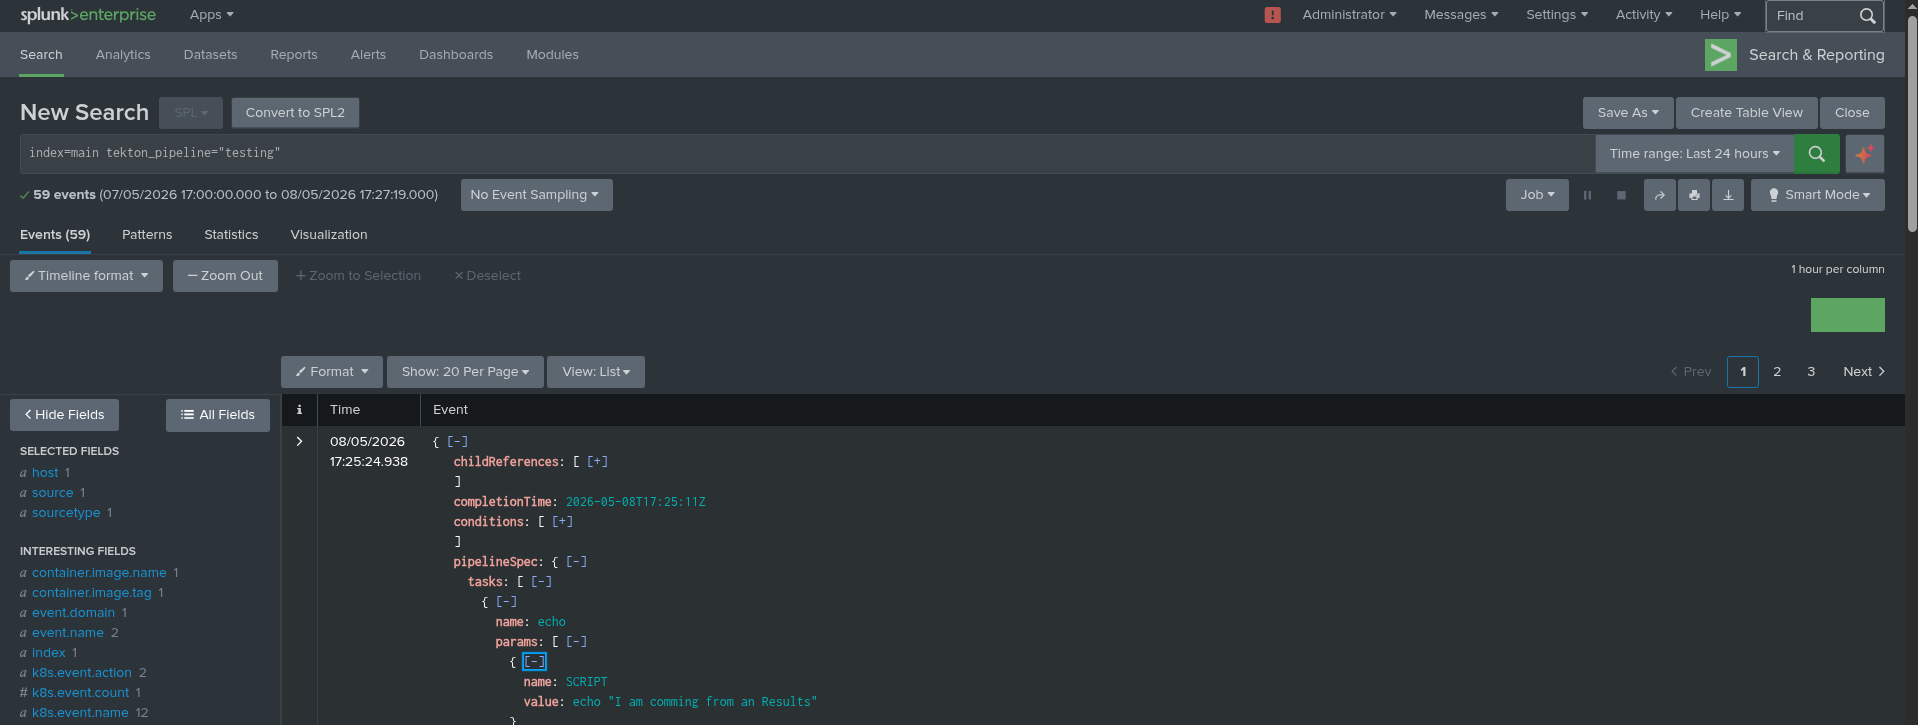
- name: ca-trustPut the OpenShift-client task in your namespace to run the pipeline properly. Once finished, open up your Splunk-HEC Web UI and enter this query into the search field: index=main tekton_pipeline=”testing”.
As demonstrated in Figure 2, you can verify your configuration by entering the specific query within the Splunk-HEC Web UI search field.
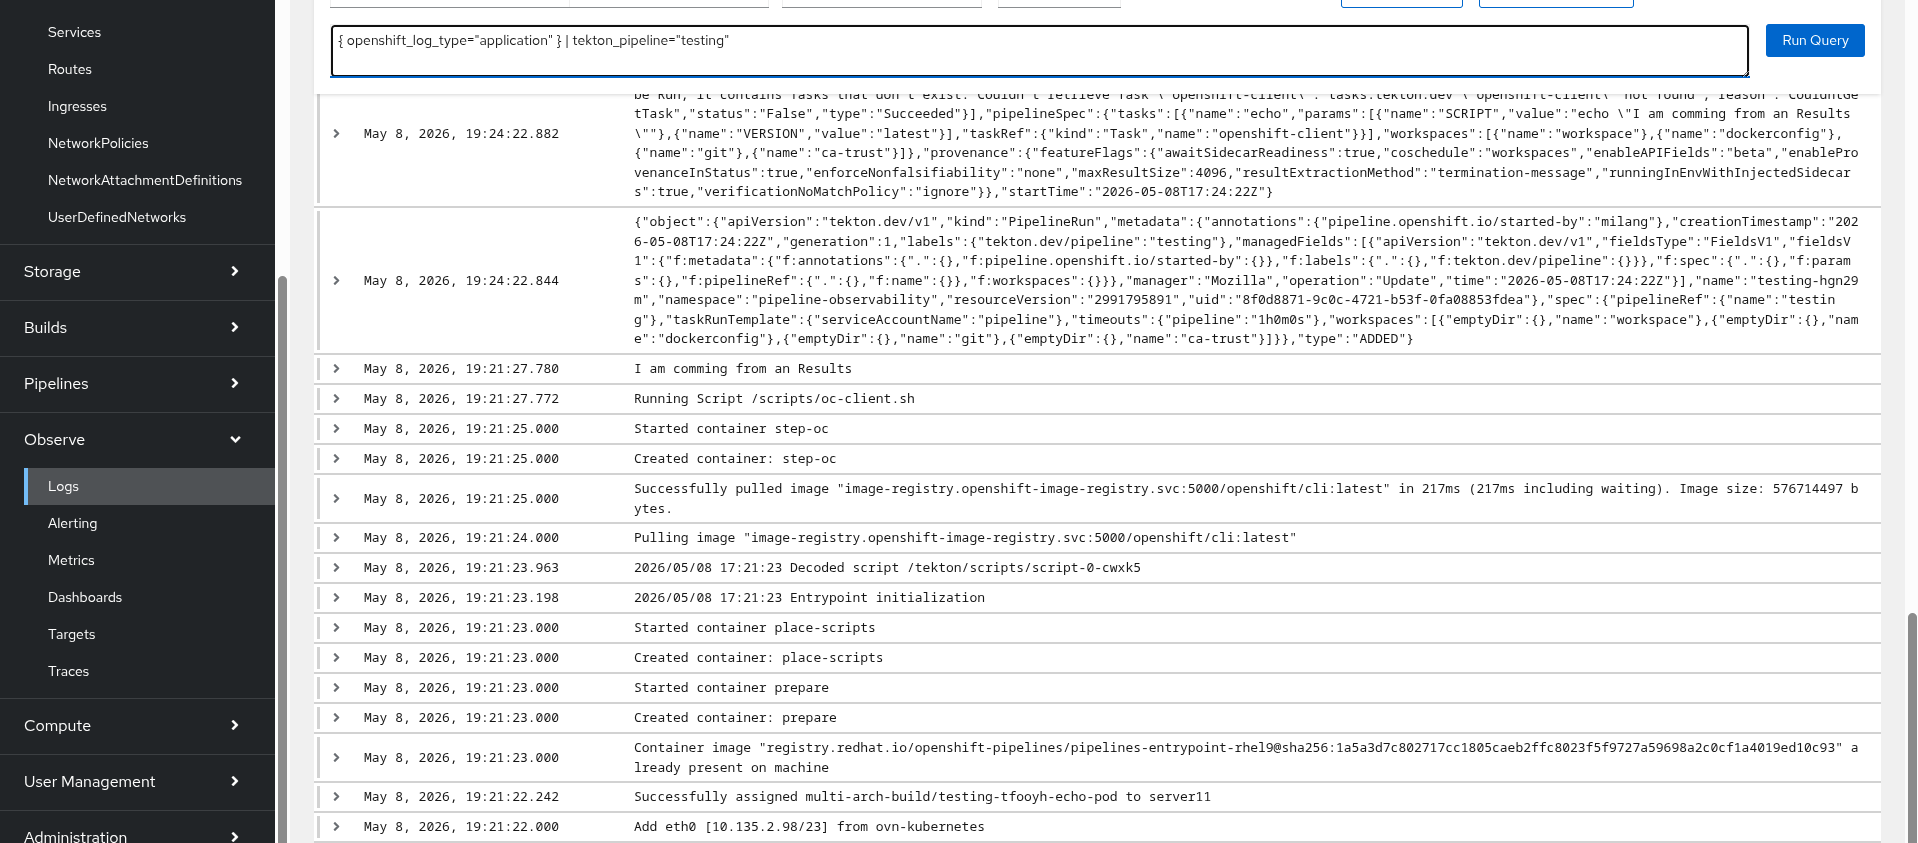
Open the OpenShift UI Observe Log tab and click on show Query.
Enter the following into the search bar:
{ openshift_log_type="application" } | tekton_pipeline="testing" Figure 3 illustrates the process of executing the log query within the OpenShift logging UI to locate specific pipeline runs.
Clean up the pipeline pods by clicking delete Pipelinerun on the three dots next to the pipeline run. The entry will update with the pipelines archived in the Tekton results icon.
After deleting the pipeline run, the entry automatically updates to reflect the archived status under the Tekton results, as shown in Figure 4.

Double check the removal of all pods in the namespace with the delete/archive action.
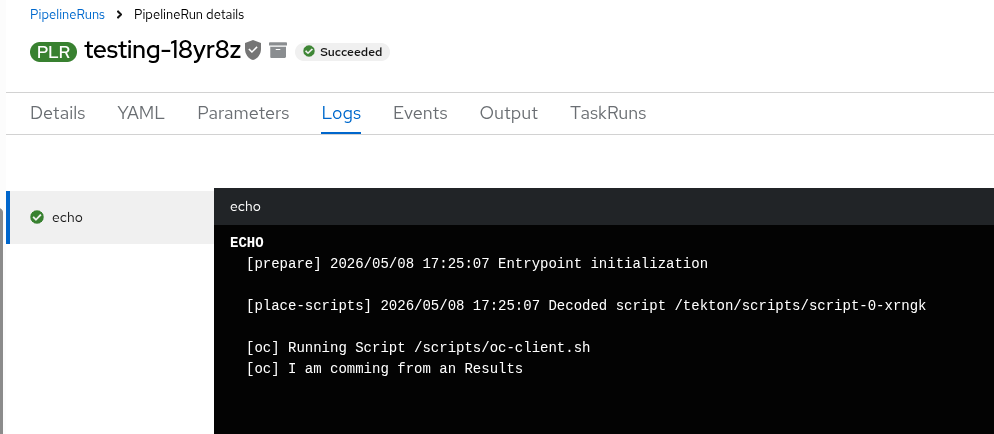
oc get pod Now click on the archived PipelineRun and open the Logs tab. We will receive the logs from our Splunk-HEC fetched through the OpenShift Pipelines result API.
Figure 5 displays the fetched pipeline logs directly within the OpenShift interface, retrieved from Splunk-HEC via the results API.
Wrapping up
High churn in OpenShift build clusters is a sign of fast and heavily utilized CI/CD processes. However, speed should never come at the cost of visibility or compliance.
By integrating the Red Hat build of OpenTelemetry into your OpenShift Pipelines architecture, you transform scattered, ephemeral build logs into highly structured, context-rich audit trails. Your developers will get the local data they need to iterate quickly, and your compliance team will have the long-term peace of mind they require.
Learn more: