EvalHub ships with a default provider set that covers most general-purpose evaluation needs: lm-evaluation-harness for capability benchmarks, Garak for safety probes, GuideLLM for infrastructure profiling, LightEval for fast capability checks, and MTEB for embedding quality. For many teams, that is enough.
For many others, it is not.
The problem with "supported frameworks only"
Your organization might have a proprietary evaluation harness built on years of domain-specific test cases. You can use an academic framework not yet in the default set. You might also have a fine-tuned judge model that scores outputs against internal rubrics. Whatever the case, if your evaluation logic is not in EvalHub's provider list, you cannot use the platform's orchestration, experiment tracking, OCI artifact persistence, or collection-based scoring—and you are back to running evaluations outside the system.
The bring-your-own-framework (BYOF) pattern closes that gap. You implement one Python method, package it in a container image, and EvalHub treats your framework as a first-class provider: it schedules runs, tracks experiments in MLflow, persists results to OCI, and includes your scores in collection aggregates.
Series note
This is the fifth post in a series covering how to build a scalable, reproducible AI evaluation infrastructure using the EvalHub project and Red Hat AI. Catch up on the other parts in the series:
- Part 1: How EvalHub manages two-layer Kubernetes control planes
- Part 2: EvalHub: Because "looks good to me" isn't a benchmark
- Part 3: Evaluation-driven development with EvalHub
- Part 4: Understanding evaluation collections in EvalHub
- Part 5: Bring your own evaluation framework to EvalHub
- Part 6: Add automated AI evaluations to your CI/CD pipeline
- Part 7: Store immutable AI evaluation records with EvalHub and OCI
- Part 8: Manage LLM evaluation workloads at scale with EvalHub and Kueue
- Part 9: Connect EvalHub to protected production model servers
The contract: Build an adapter with one method
The entire BYOF adapter surface is one abstract method in one base class:
from evalhub.adapter import FrameworkAdapter, JobCallbacks, JobResults, JobSpec
class MyEvalAdapter(FrameworkAdapter):
    def run_benchmark_job(
        self,
        config: JobSpec,
        callbacks: JobCallbacks,
    ) -> JobResults:
        ...
Everything else—loading the job specification, authenticating with the EvalHub service, communicating with the Kubernetes sidecar, pushing OCI artifacts, writing to MLflow—is handled by the SDK. Your implementation focus is entirely inside run_benchmark_job.
The three interfaces
To build your adapter, you must interact with three distinct data structures that handle job inputs, real-time status updates, and final evaluation metrics.
JobSpec: What comes in
JobSpec is the complete job description EvalHub passes to your adapter at runtime. It is automatically loaded by the base class from /meta/job.json (Kubernetes mode) or from ./meta/job.json (local development mode).
class JobSpec(BaseModel):
    id: str                          # Unique job ID from the service
    provider_id: str                 # Your registered provider identifier
    benchmark_id: str                # Which benchmark to run
    benchmark_index: int             # Index in provider's benchmark list
    model: ModelConfig               # model.url + model.name (+ optional auth)
    parameters: dict                 # Benchmark-specific config (arbitrary)
    callback_url: str                # EvalHub endpoint for status/result callbacks
    num_examples: int | None         # Limit evaluation scope; None = run all
    experiment_name: str | None      # MLflow experiment name
    tags: dict[str, str] | None      # Labels propagated to MLflow
    exports: dict | None             # OCI export coordinates
    timeout_seconds: int             # Hard execution deadline
The parameters dict is where benchmark-specific configuration lives, such as few-shot count, batch size, random seed, dataset split, and anything else your framework needs. EvalHub passes it through opaquely; your adapter interprets it.
Side effects of JobCallbacks
JobCallbacks is the interface for reporting progress and persisting artifacts. It has three methods:
class JobCallbacks(ABC):
    def report_status(self, update: JobStatusUpdate) -> None:
        """Send a progress update to EvalHub (or log locally in dev mode)."""
    def create_oci_artifact(self, spec: OCIArtifactSpec) -> OCIArtifactResult:
        """Push a directory of result files to an OCI registry.
        Returns the digest and full artifact reference URI."""
    def report_results(self, results: JobResults) -> None:
        """Report completion. In K8s mode, also signals the sidecar to terminate."""
In production, DefaultCallbacks implements all three against a real EvalHub instance: HTTP status callbacks, OCI registry push with the sidecar handling authentication, and MLflow integration. In local development, DefaultCallbacks logs to stdout and skips network calls. Same code path, different runtime behavior, no changes to your adapter.
Status updates use structured phases:
from evalhub.adapter import JobPhase, JobStatus, JobStatusUpdate
callbacks.report_status(JobStatusUpdate(
    status=JobStatus.RUNNING,
    phase=JobPhase.LOADING_DATA,
    progress=0.1,
    message=MessageInfo(message="Loading dataset", message_code="loading"),
    current_step=1,
    total_steps=4,
))
Phases:
INITIALIZINGLOADING_DATARUNNING_EVALUATIONPOST_PROCESSINGPERSISTING_ARTIFACTSCOMPLETED
JobResults: What goes out
JobResults is the structured completion payload. You must populate every field except oci_artifact and mlflow_run_id:
class JobResults(BaseModel):
    id: str                              # Echo config.id
    benchmark_id: str                    # Echo config.benchmark_id
    benchmark_index: int                 # Echo config.benchmark_index
    model_name: str                      # Echo config.model.name
    results: list[EvaluationResult]      # One entry per metric
    overall_score: float | None          # Aggregate score (0–100)
    num_examples_evaluated: int          # Count of samples processed
    duration_seconds: float              # Wall-clock execution time
    completed_at: datetime               # UTC completion timestamp
    evaluation_metadata: dict[str, Any]  # Framework version, params, etc.
    oci_artifact: OCIArtifactResult | None  # Filled by callbacks.create_oci_artifact
    mlflow_run_id: str | None            # Filled by the SDK automatically
Use EvaluationResult to define each individual metric:
class EvaluationResult(BaseModel):
    metric_name: str                          # e.g., "accuracy", "f1", "bleu"
    metric_value: float | int | str | bool    # The measured value
    metric_type: str = "float"                # Type classification
    confidence_interval: tuple[float, float] | None = None
    num_samples: int | None = None
    metadata: dict[str, Any] = {}
A complete minimal adapter
This is the full pattern for a working adapter. Replace the _run_my_framework call with your actual evaluation logic:
import time
from datetime import UTC, datetime
from pathlib import Path
from evalhub.adapter import (
    FrameworkAdapter,
    JobCallbacks,
    JobPhase,
    JobResults,
    JobSpec,
    JobStatusUpdate,
    MessageInfo,
    OCIArtifactSpec,
    OCICoordinates
)
from evalhub.adapter.callbacks import DefaultCallbacks
from evalhub.models import EvaluationResult, JobStatus
class MyEvalAdapter(FrameworkAdapter):
    def run_benchmark_job(self, config: JobSpec, callbacks: JobCallbacks) -> JobResults:
        start = time.monotonic()
        # --- Phase 1: Initialize ---
        callbacks.report_status(JobStatusUpdate(
            status=JobStatus.RUNNING,
            phase=JobPhase.INITIALIZING,
            progress=0.0,
            message=MessageInfo(message="Initializing", message_code="init"),
        ))
        # --- Phase 2: Load data ---
        callbacks.report_status(JobStatusUpdate(
            status=JobStatus.RUNNING,
            phase=JobPhase.LOADING_DATA,
            progress=0.2,
            message=MessageInfo(message="Loading dataset", message_code="loading"),
        ))
        # config.parameters holds your benchmark-specific config
        num_examples = config.num_examples or 500
        dataset = load_my_dataset(config.benchmark_id, num_examples)
        # --- Phase 3: Run evaluation ---
        callbacks.report_status(JobStatusUpdate(
            status=JobStatus.RUNNING,
            phase=JobPhase.RUNNING_EVALUATION,
            progress=0.4,
            message=MessageInfo(message="Running evaluation", message_code="running"),
        ))
        raw_results = _run_my_framework(
            model_url=config.model.url,
            model_name=config.model.name,
            dataset=dataset,
            params=config.parameters,
        )
        # --- Phase 4: Post-process ---
        callbacks.report_status(JobStatusUpdate(
            status=JobStatus.RUNNING,
            phase=JobPhase.POST_PROCESSING,
            progress=0.8,
            message=MessageInfo(message="Computing metrics", message_code="postproc"),
        ))
        metrics = [
            EvaluationResult(metric_name="accuracy", metric_value=raw_results["acc"]),
            EvaluationResult(metric_name="f1",       metric_value=raw_results["f1"]),
        ]
        overall = raw_results["acc"] * 100
        # --- Phase 5: Persist artifacts ---
        callbacks.report_status(JobStatusUpdate(
            status=JobStatus.RUNNING,
            phase=JobPhase.PERSISTING_ARTIFACTS,
            progress=0.9,
            message=MessageInfo(message="Persisting artifacts", message_code="oci"),
        ))
        artifacts_dir = self.local_jobs_base_path or Path("/tmp/results")
        artifacts_dir.mkdir(parents=True, exist_ok=True)
        (artifacts_dir / "results.json").write_text(str(raw_results))
        oci_result = callbacks.create_oci_artifact(OCIArtifactSpec(
            files_path=artifacts_dir,
            coordinates=OCICoordinates(
        		oci_host="quay.io",
oci_repository="my-org/my-framework-results",
    	),
        ))
        return JobResults(
            id=config.id,
            benchmark_id=config.benchmark_id,
            benchmark_index=config.benchmark_index,
            model_name=config.model.name,
            results=metrics,
            overall_score=overall,
            num_examples_evaluated=len(dataset),
            duration_seconds=time.monotonic() - start,
            completed_at=datetime.now(UTC),
            evaluation_metadata={"framework": "my-framework", "version": "1.0"},
            oci_artifact=oci_result,
        )
def main():
    adapter = MyEvalAdapter()
    callbacks = DefaultCallbacks.from_adapter(adapter)
    results = adapter.run_benchmark_job(adapter.job_spec, callbacks)
    callbacks.report_results(results)
if __name__ == "__main__":
    main()
self.local_jobs_base_path returns a run-scoped directory in local mode (preventing result collisions across concurrent local runs) and None in Kubernetes mode—in which case your adapter should write to a stable path like /tmp/results that the sidecar can access.
Packaging as a container
EvalHub executes BYOF adapters as Kubernetes jobs. The container pattern from the community adapters in eval-hub-contrib is:
FROM registry.access.redhat.com/ubi9/python-311:latest
WORKDIR /app
COPY requirements.txt .
RUN pip install --no-cache-dir -r requirements.txt
COPY main.py .
# Non-root user required for OpenShift
RUN mkdir -p /tmp/.cache && chmod -R 777 /tmp && chmod -R g+w /app /opt/app-root
USER 1001
ENV PYTHONUNBUFFERED=1
ENV EVALHUB_MODE=k8s
ENV HOME=/tmp
ENTRYPOINT ["python", "main.py"]
Two environment variables matter:
EVALHUB_MODE=k8s: Tells the SDK to loadJobSpecfrom/meta/job.json(mounted by EvalHub as a ConfigMap) and use the sidecar for callbacksEVALHUB_MODE=local(default): Loads from./meta/job.jsonand logs callbacks locally; used for development and testing.
Push the image to a registry accessible from your cluster:
podman build -t quay.io/my-org/my-eval-framework:latest .
podman push quay.io/my-org/my-eval-framework:latest
Community adapters follow the naming convention quay.io/evalhub/community-{framework}:latest. Your custom adapters can use any registry path your cluster can pull from.
The Kubernetes execution model
Understanding what EvalHub does when scheduling your adapter helps avoid surprises.
When EvalHub dispatches a job to your provider, it creates a Kubernetes Job with a two-container pod, as illustrated in Figure 1.
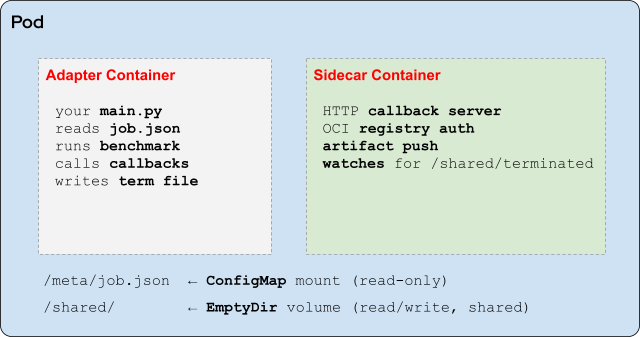
The JobSpec arrives via /meta/job.json. Status callbacks from callbacks.report_status() POST to the sidecar's local HTTP server, which forwards them to EvalHub. Artifact pushes from callbacks.create_oci_artifact() delegate registry authentication to the sidecar. The callbacks.report_results() method writes the termination file to /shared/terminated, signaling the sidecar to shut down. You do not need to manage any of this directly; DefaultCallbacks handles it.
In local development, none of this runs. DefaultCallbacks detects EVALHUB_MODE=local, logs all callbacks to stdout, and skips network calls. To test locally before building a container:
# Create the job spec in the expected location
mkdir -p meta
cat > meta/job.json << 'EOF'
{
  "id": "local-test-001",
  "provider_id": "my-framework",
  "benchmark_id": "my-benchmark",
  "benchmark_index": 0,
  "model": {
    "url": "http://localhost:8000/v1",
    "name": "my-model"
  },
  "parameters": {"batch_size": 4},
  "callback_url": "http://localhost:8080",
  "timeout_seconds": 3600
}
EOF
EVALHUB_MODE=local python main.py
Register your provider
Once you build and push your container image, register the provider with EvalHub using a ConfigMap entry in the server configuration. A provider registration declares the image to use, the benchmarks it supports, and the parameters each benchmark accepts.
After registration, your provider appears in evalhub providers list alongside the built-in providers. You can then include benchmark IDs from your adapter in evaluation collections exactly like any built-in benchmark.
# Collection referencing your custom provider
name: "My Domain Eval Suite v1"
category: "domain-specific"
pass_criteria:
  threshold: 70.0
benchmarks:
  - id: my-benchmark
    provider_id: my-framework      # Your registered provider ID
    metric: accuracy
    threshold: 75.0
    weight: 2.0
    lower_is_better: false
  - id: leaderboard_ifeval         # Mix with built-in benchmarks
    provider_id: lm_evaluation_harness
    metric: inst_level_strict_acc
    threshold: 65.0
    weight: 1.0
    lower_is_better: false
Each benchmark entry specifies which metric to use for scoring, the pass/fail threshold, and a weight for the collection's aggregate score. lower_is_better: false means higher values are better (the default).
Platform benefits included with your adapter
Implementing run_benchmark_job and packaging the container is the entirety of the BYOF integration work. In return, your adapter inherits everything the platform provides to built-in providers:
- MLflow experiment tracking: The platform automatically records every run with the job configuration, tags, model info, and your returned metrics.
- OCI artifact persistence: The platform pushes results to a registry with SHA256-derived tags, which lets you query the artifact reference alongside MLflow data.
- Collection scoring: Your benchmark score participates in weighted collection aggregation, and a single
pass_criteria.thresholdgates deployment. - Kubernetes orchestration: The platform handles Kueue-managed resource quotas, pod scheduling, and status tracking using custom resources.
- SDK client access:
evalhub eval run,the Python client, and the MCP server all work with your provider without changes. - Local-to-cluster continuity: The same
main.pyruns locally withEVALHUB_MODE=localand on OpenShift withEVALHUB_MODE=k8s.
The community adapters in eval-hub-contrib—such as LightEval, MTEB, and GuideLLM—are working reference implementations for every pattern covered here.
Next steps to build your adapter
To build your custom adapter or explore existing community implementations, use the following project resources:
- EvalHub website
- EvalHub SDK (
FrameworkAdapter,JobSpec,DefaultCallbacks) - eval-hub-contrib (LightEval, MTEB, GuideLLM reference adapters)
- EvalHub server (provider registration, Collections API)