This article describes an automated CI framework that measures etcd benchmark performance periodically, and tracks results using Horreum, an open source performance repository with automated anomaly detection. We use Red Hat Ansible Automation Platform for orchestration and Podman for containerized isolation. For illustration purposes, we choose etcd because it serves as the primary data store for Red Hat OpenShift cluster state and configuration.
Written entirely in Go, etcd is not a synthetic benchmark but a production-critical component. Its performance directly impacts cluster control plane responsiveness, API server latency, and overall cluster stability. Any regression in Go compiler optimizations (garbage collection, concurrency primitives, or code generation) manifests immediately in etcd's latency and throughput metrics, making it a sensitive and realistic indicator of compiler health. Furthermore, etcd exercises a broad spectrum of Go language features including goroutines, channels, network I/O, serialization (protobuf), and concurrent data structures, providing comprehensive coverage of the Go runtime and standard library.
Red Hat maintains its own Go toolchain builds with FIPS compliance and other patches. Continuous etcd benchmarking provides early detection of performance impacts from both upstream Go releases and Red Hat-specific modifications, ensuring that you receive optimized, reliable builds that meet your performance and compliance requirements. This framework can be modified to measure performance of any other benchmark easily.
Building blocks: Ansible, Podman, and Horreum
Ansible: Playbooks provide declarative, version-controlled test definitions that work seamlessly over SSH and can be easily shared across teams. Ansible orchestrates the overall workflow by spawning containers, running benchmarks, collecting metrics, and uploading to Horreum.
Podman: Isolates benchmark environments within containers, ensuring reproducibility and preventing interference between concurrent runs in shared CI environments. In the current workflow, the tests run in a podman created container environment.
Horreum: Stores benchmark results in JSON format, provides graphical visualization, and performs automated anomaly detection based on user-defined thresholds. Results can be configured to trigger alerts to communication channels of your choice. The main interface for passing Ansible benchmark results to Horreum is a "test". Data upload also requires an API key, which a Horreum user can create. This is the final step in the workflow that transfers the data from the virtual machine (VM), where the run finished, to the Horreum database.
The workflow
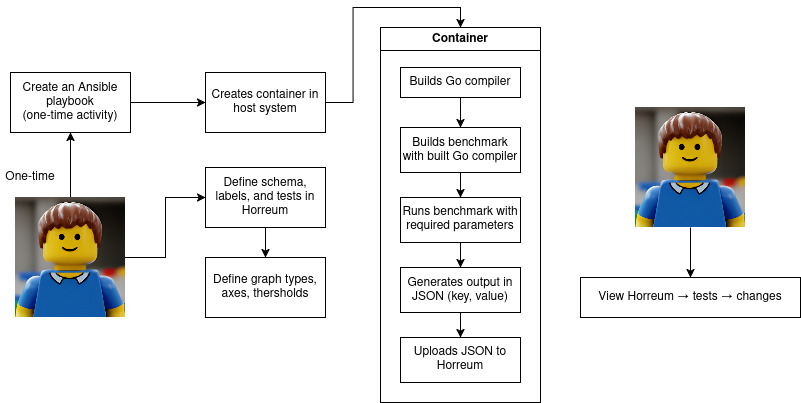
The framework requires three one-time setup tasks when initially configured. Each Ansible execution automatically uploads data to Horreum and refreshes plots. The complete process is illustrated in the flowchart in Figure 1.
Structure of the Ansible playbook
The Ansible playbook orchestrates a complete etcd benchmark workflow and consists of the following phases:
- Setup phase
- Pull Arcaflow PCP monitoring container to collect system metrics
- Deploy and build custom etcd test container from Containerfile
- Execution phase
- Launch PCP monitoring (0.5s sampling interval) in background
- Run etcd benchmarks in isolated container:
- PUT operations: 5 runs, 500K sequential writes (8B keys, 256B values, 1000 clients)
- STM operations: 5 runs, 1000 keys, 2 keys/txn
- Capture timestamps and system metrics such as average usage of CPU, memory, IO, network over time
- Data collection phase
- Extract metrics as shown in the table below from benchmark output:
- Stop monitoring and convert PCP data to JSON
- Merge benchmark and monitoring data into
output.json
- Extract metrics as shown in the table below from benchmark output:
- Upload phase
- POST results to Horreum over REST API with test metadata
At the end of a successful run, you have two JSON files generated in the VM: output.json contains values of the run, and monitoring.json contains system stats measured during the run.
Summary of key metrics extracted
- Throughput
- PUT operations: requests per second (rps)
- STP operations: requests per second (rps_stm)
- Latency
- PUT operations: fastest, slowest, average, standard deviation (stddev), 99.9th percentile
- STP operations: fastest_stm, slowest_stm, average_stm, standard deviation (stddev_stm), 99.9th percentile
The playbook can be executed by running:
$ ansible-playbook -vvvv -i ci_inventory.ini \
masterplaybook-etcd.yaml
In this example, ci_inventory.ini contains the target VM address. This can be automated as a cronjob or a systemd timer for periodic runs. The key sections of the Ansible playbook are shown below for reference:
  - name: "Run the tests"
      shell: |
        set -xeu
       …
        podman run --rm -ti etcdmaster bash -c "export GOPATH=/opt/app-root/src/go/bin; export PATH=/opt/app-root/src/go/bin:/opt/app-root/src/etcd/bin:$PATH; cat /opt/app-root/src/saveversion.txt; etcd & sleep 3; for i in {1..5}; do echo \"=== PUT RUN \$i ===\"; benchmark --target-leader --conns=100 --clients=1000 put --key-size=8 --sequential-keys --total=500000 --val-size=256; done; for i in {1..5}; do echo \"=== STM RUN \$i ===\"; benchmark --precise --conns=100 --clients=1000 stm --keys=1000  --keys-per-txn=2 --val-size=8; done" &>/tmp/etcdmaster.log


        jq ".ended = \"$( date --utc -Ins )\"" output.json >/tmp/$$.json && mv /tmp/$$.json output.json
        jq ".commithash = \"$( cat /tmp/etcdmaster.log | awk '/go version/ {print $3;}' )\""  output.json >/tmp/$$.json && mv /tmp/$$.json output.json

        kill -INT $monitoring_pid
        while ps $monitoring_pid; do
          sleep 0.1
        done
        python -c "import yaml; import json; open('monitoring.json', 'w').write(json.dumps(yaml.safe_load(open('monitoring.yaml').read())))"
        cat monitoring.json | jq .output_data.pcp_output | less
        jq '.measurements.pcp_data = input.output_data.pcp_output' ~/output.json monitoring.json >/tmp/$$.json && mv /tmp/$$.json ~/output.json

    - name: "Extract Put RPS from test output"
      shell: |
        rps="$( grep '\s*Requests/sec:' /tmp/etcdmaster.log | head -5 | awk '{sum += $2; count++} END {printf "%.2f", sum/count}' )"
        jq ".results.rps = $rps" output.json >/tmp/$$.json && mv /tmp/$$.json output.json

    - name: "Extract STM RPS from test output"
      shell: |
        rps_stm="$( grep '\s*Requests/sec:' /tmp/etcdmaster.log | tail -5 | awk '{sum += $2; count++} END {printf "%.2f", sum/count}' )"
        jq ".results.rps_stm = $rps_stm" output.json >/tmp/$$.json && mv /tmp/$$.json output.json
…
  - name: "Upload to Horreum"
      shell: |
        started="$( date --utc -d $( jq --raw-output .started output.json ) -Iseconds | sed "s/+00:00/Z/" )"
        ended="$( date --utc -d $( jq --raw-output .ended output.json ) -Iseconds | sed "s/+00:00/Z/" )"
        curl nvvv --insecure -X POST -H 'Content-Type: application/json' -H "XXXXXXXXXXX" -vvv "https://horreum.corp.redhat.com/api/run/data?test=Golang-perf-etcd-test&start=$started&stop=$ended&owner=go-compiler-team&access=PUBLIC" -d @output.json
Podman container configuration
The Containerfile performs three steps:
- Builds a specified version of Go from source
- Builds etcd 3.6 using the compiled Go toolchain
- Verifies etcd functionality
When testing the Go master branch, version formatting must be adjusted from go1.xx-devel_hash to 1.xx for etcd toolchain compatibility. Production releases require no modification.
FROM registry.access.redhat.com/ubi9/go-toolset:latest

# Download Go master and build Go
RUN git clone --depth=1 --single-branch --branch=master https://go.googlesource.com/go gotest/ \
    && cd /opt/app-root/src/gotest/src \
    && ./make.bash \
    && export PATH=/opt/app-root/src/gotest/bin:$PATH \
    && go version > /opt/app-root/src/saveversion.txt \
    && echo "go1.27.0" > VERSION \
    && cp VERSION ../ \
    && ./make.bash \
    && cd /opt/app-root/src

### export PATH=/opt/app-root/src/etcdhome/src/etcd/bin:$PATH

# Install etcd
RUN git clone -b release-3.6 \
    https://github.com/etcd-io/etcd.git \
    && cd etcd \
    && sed -i go.mod -e 's/go 1.24/go 1.27/g' \
    && sed -i go.mod -e '/toolchain/d' \
    && export PATH=/opt/app-root/src/gotest/bin:$PATH \
    && export GOTOOLCHAIN=local \
    && go mod tidy \
    && make \
    && go install -v ./tools/benchmark

# Verify etcd works
RUN bash -c "cd etcd; export GOPATH=/opt/app-root/src/gotest/bin; export PATH=/opt/app-root/src/gotest/bin:/opt/app-root/src/etcd/bin:$PATH; etcd & sleep 1; etcdctl put mykey 'this is awesome'; etcdctl get mykey | grep '^this is awesome$';"
Configure Horreum
To store and display test runs performed over time, you must configure Horreum as a one-time operation:
1. Schema creation
Define a schema (for example, urn:golang-perf-test-etcd:1.0) that specifies the JSON structure for uploaded data.
2. Label definition
Create two types of labels:
- Filter labels: Enable data filtering in UI (commit hash, Go version, hostname)
- Metric labels: Parameters to plot and track (rps, average latency, 99.9% latency)
The JSON Path field must exactly match the key names used in the Ansible-generated output.json.
3. Change detection configuration
To flag significant regressions or improvements, configure the following parameters for the test under change detection. For this article, we chose the threshold as 10% variance to reduce the possibility of false positives based on the trends observed over a period of 1-2 months worth of runs.
- Parameter: Timeline function
- Description: The source for the X-axis timestamp data
- Example value: Start time of the execution run
- Parameter: Model
- Description: The algorithm employed for threshold calculation
- Example value: Relative difference between the means
- Parameter: Threshold
- Description: The maximum permissible deviation
- Example value: 10% variance
- Parameter: Window size
- Description: The quantity of datapoints to be aggregated
- Example value: The most recent five execution runs
- Parameter: Minimum preceding points
- Description: The requisite historical data for comparative analysis
- Example value: Ten preceding execution runs
- Parameter: Aggregation function
- Description: The methodology utilized for window computation
- Example value: Mean value
Horreum flags data points exceeding thresholds, which show up on the graph as red dots, as shown in Figure 2. You can hover over flagged points to retrieve run IDs and investigate anomalies.
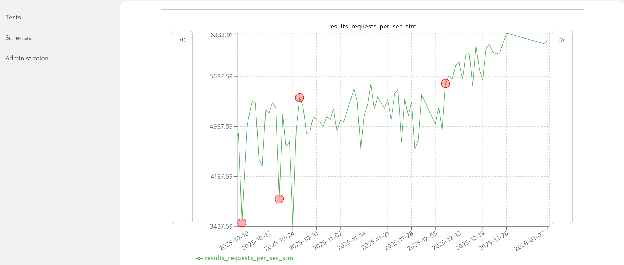
allow for further investigation.
It's time to benefit from early warnings
The process of setting up this end-to-end performance tracking pipeline with Podman, Ansible, and Horreum requires minimal effort but the impact can be significant. For our team, this framework is now an essential early-warning system that's prepared to catch subtle performance regressions—like those from Go toolchain updates — that would otherwise be missed. This modular approach is not limited to etcd. It can easily be adapted for any benchmark, ensuring infrastructure performance and proactively preventing regressions.