I recently had the opportunity to speak at Red Hat Summit 2019. In my session, titled "Vert.x application development with Jaeger distributed tracing," I discussed how scalable event-driven applications could be built with Eclipse Vert.x, a Java Virtual Machine toolkit for building reactive applications.
Thanks to many developer tools, creating these applications is no longer the most effort-consuming task in IT. Instead, we now have to understand how parts oJaeger,f our application function together to deliver a service, (across dev, test and production environments). This can be difficult because, with distributed architectures, external monitoring only tells you the overall response time and the number of invocations, providing no insight into the individual operations. Additionally, log entries for a request are scattered across numerous logs. This article discusses the use of Eclipse Vert.x, distributed tracing, and Jaeger in the context of this problem.
As defined by the Reactive Manifesto, reactive systems are elastic, resilient, responsive, and based on a message-driven design.
Eclipse Vert.x is an open source toolkit for building reactive systems and streams on the Java Virtual Machine. Vert.x is unopinionated and polyglot, which gives developers the freedom to use the toolkit as they see fit. The core components of Vert.x include its actors, which are called Verticles, a message bus, called an Event Bus, and event dispatchers, known as Eventloops.
Eclipse Vert.x basics
Eclipse Vert.x implements a multi-reactor pattern supported by eventloops. In a reactor pattern, there exists a stream of events delegated to handlers by a thread called an eventloop. Because the eventloop observes the stream of events and calls the handlers to handle the event, it is important to never block the eventloop. If handlers are not available to the eventloop, then the eventloop has to wait; so, we effectively call the eventloop blocked.
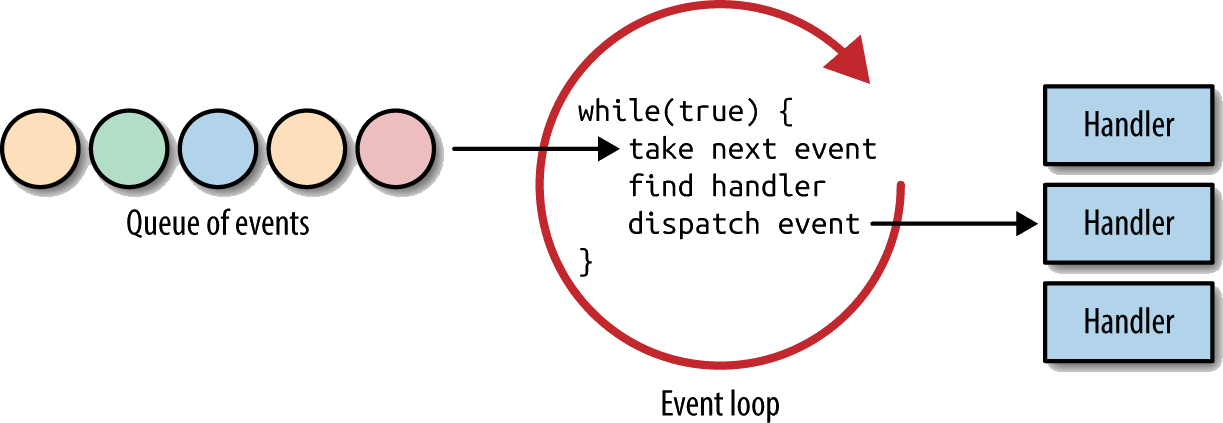
In this pattern, a single eventloop on a multi-core machine has drawbacks, because a single thread cannot run on more than one CPU core at a time. For developers using technologies implementing the reactor pattern, this means having to manage and start up more processes with an eventloop in order to improve performance.
Eclipse Vert.x implements a multi-reactor pattern where, by default, each CPU core has two eventloops. This gives applications using Vert.x the responsiveness needed when the number of events increases.
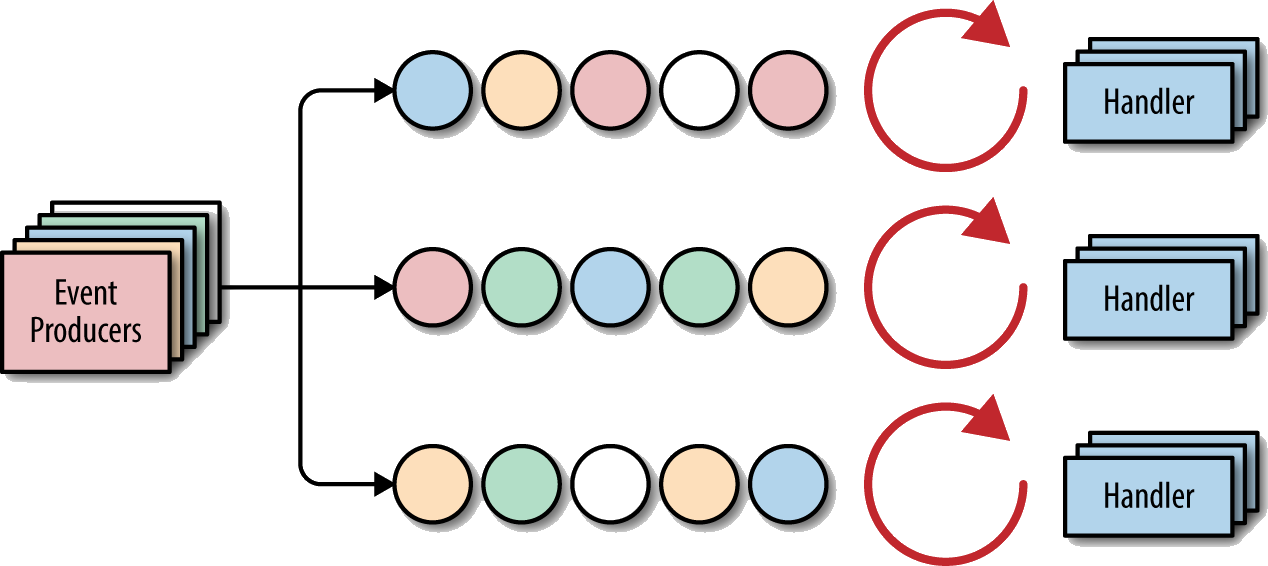
In the figure above, the handlers are verticles, which are the main actors in Vert.x. Verticles get assigned to a random eventloop at deploy time.
Another important concept is the event bus, which is how verticles can communicate with each other in a publish-subscribe manner. Verticles are registered to the event bus and given an address to listen on. The event bus allows verticles to be scaled, as we only need to specify what address a verticle listens for events on and where it should publish those events to.
Observability
Vert.x aids development of reactive microservices, but what about application observability? It is important in distributed landscapes that we can still observe requests being handled by the application. Consider an e-commerce application, for example. A single checkout request may be passed to tens or hundreds of services before the application is finished handling that process; whether in development or production environments, developer and support teams need tools to understand and debug issues that may arise within their services.
Tracing can provide the context surrounding the failure. Distributed tracing involves code instrumentation such that:
- Each request has a unique external request id.
- The external request id is passed to all services that are involved in handling the request.
- The external request id is included in log messages.
- Information (e.g., start time, end time) about the requests and operations performed are recorded when handling an external request in a centralized service.
This code instrumentation is provided by the OpenTracing specification. Using the core concepts of distributed tracing we can use OpenTracing libraries to instrument our applications.
Application Performance Management (APM) tools, such as Cloud Native Computing Foundation's Jaeger, use OpenTracing to provide additional features such as a user interface for users to interact with, below is an architecture diagram for using Jaeger.
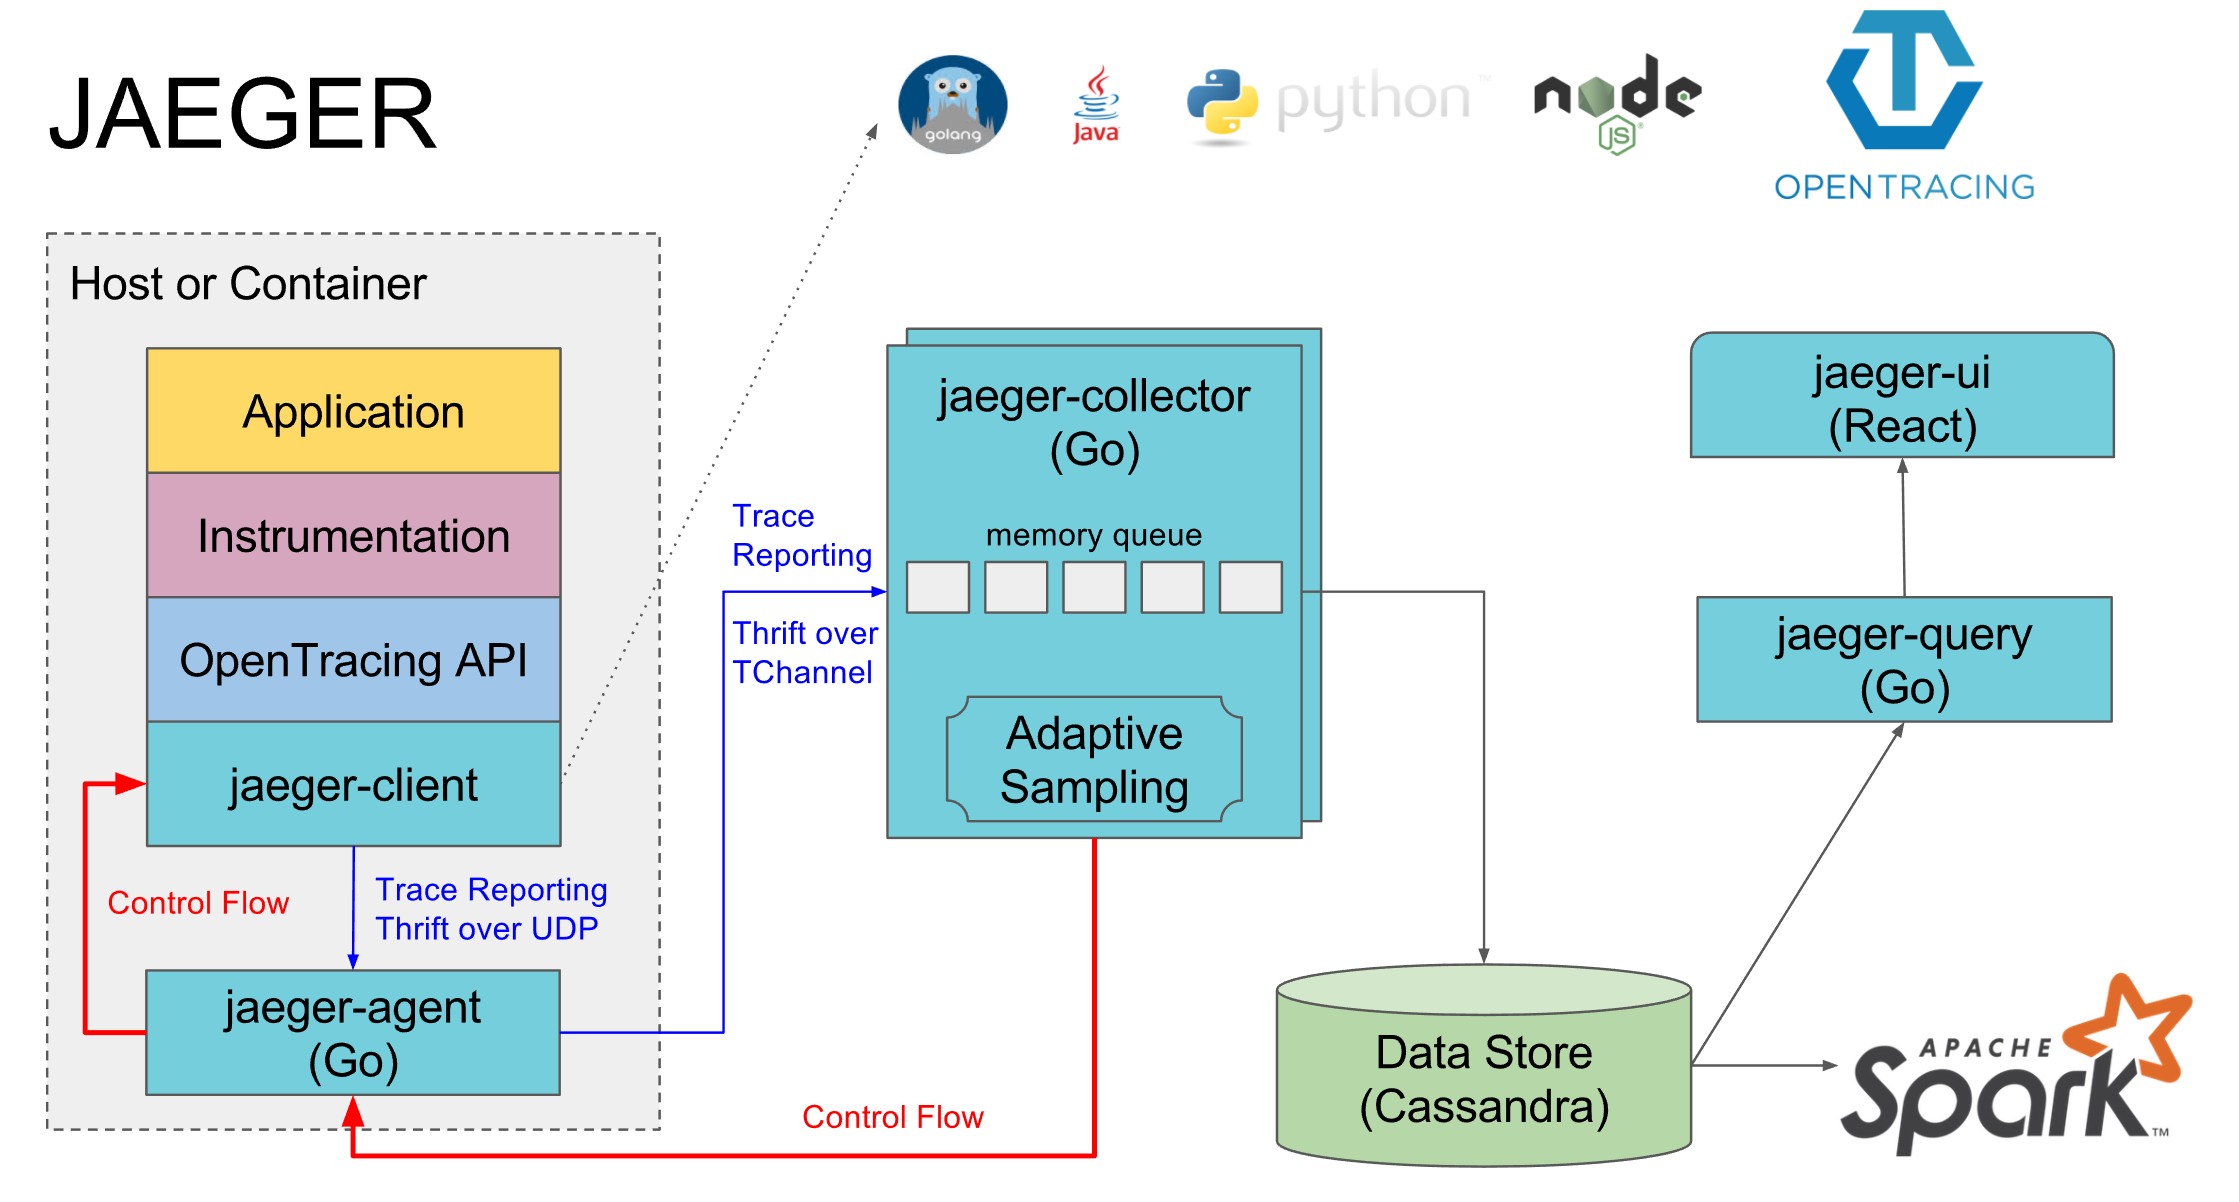
The application's node contains the application and jaeger-client library. Once spans are finished, they are reported to the jaeger-agent, and the jaeger-collector interacts with database backends to store the reported traces to be queried when the user views the jaeger-ui. You can find more details about each Jaeger component here.
Reactive event-driven architectures provide the advantages of responsiveness, resiliency, elasticity, and message passing. Yet as our applications expand and grow, it can become difficult to understand or even debug applications. The purpose of this article (and my presentation) was to share how Vert.x can be used to create reactive microservice applications and how distributed tracing can provide the ability to better work with such applications.
This article is based on the "Vert.x application development with Jaeger distributed tracing" session presented by Tiffany Jachja at Red Hat Summit 2019.
Last updated: February 11, 2024