In the world of distributed computing, containers, and microservices, a lot of the interactions and communication between services is done via RESTful APIs. While developing these APIs and interactions between services, I often have the need to debug the communication between services, especially when things don't seem to work as expected.
Before the world of containers, I would simply deploy my services on my local machine, start up Wireshark, execute my tests, and analyze the HTTP communication between my services. This for me has always been an easy and effective way to quickly analyze communication problems in my software. However, this method of debugging does not work well in a containerized world.
First of all, the containers most likely run on an internal container platform network that is not directly accessible by your machine. A second problem is that, in compliance with container design best practices, containers contain only the minimal set of applications and libraries needed to execute their task. This means that a tool like tcpdump is usually not available in a container. This makes debugging and analyzing network traffic between containers and, thus, debugging of inter-microservice communication a bit harder than in the non-containerized world. This article shows one solution.
Sidecars to the rescue
In the last couple of months, I've tried various approaches to overcome this problem, which resulted in the approach that I'll outline in this article. It's an easy way to capture network traffic data between Kubernetes/OpenShift pods, allowing developers to better analyze and debug communication problems in containerized applications and to solve issues quicker and more effectively.
We will be using tcpdump to capture a so-called, PCAP (packet capture) file that will contain the pod's network traffic. This PCAP file can then be loaded in a tool like Wireshark to analyze the traffic and, in this case, the RESTful communication of a service running in a pod. In this article, I'll be using the KIE Server (execution server) of the Red Hat Process Automation Manager product as an example, but this approach should work with any kind of containerized application.
The first problem to overcome is the availability of the tcpdump command in the Kubernetes pod. The KIE Server container image does not have tcpdump installed. Second, the container does not provide the utilities to install tcpdump from the Red Hat repositories. To overcome this problem, we use the concept of a "sidecar container."
A sidecar container is a container that is running in the same pod as the actual service/application and is able to provide additional functionality to the service/application. An example of a sidecar container is Istio's Envoy sidecar, which enables a pod to become part of a service mesh. In this example, we will be deploying a sidecar container that provides the tcpdump utility. Because multiple containers in a pod share the same network layer, we can use the sidecar to capture network traffic to and from the KIE Server.
Deploying the sidecar
In this example, I've deployed the Red Hat Process Automation Manager 7 Mortgage Demo, which will create two pods in my OpenShift namespace. One pod runs the Business Central workbench, and the other pod is the pod for the execution server. Communication between the two components is done via REST, which is the traffic we're going to capture.
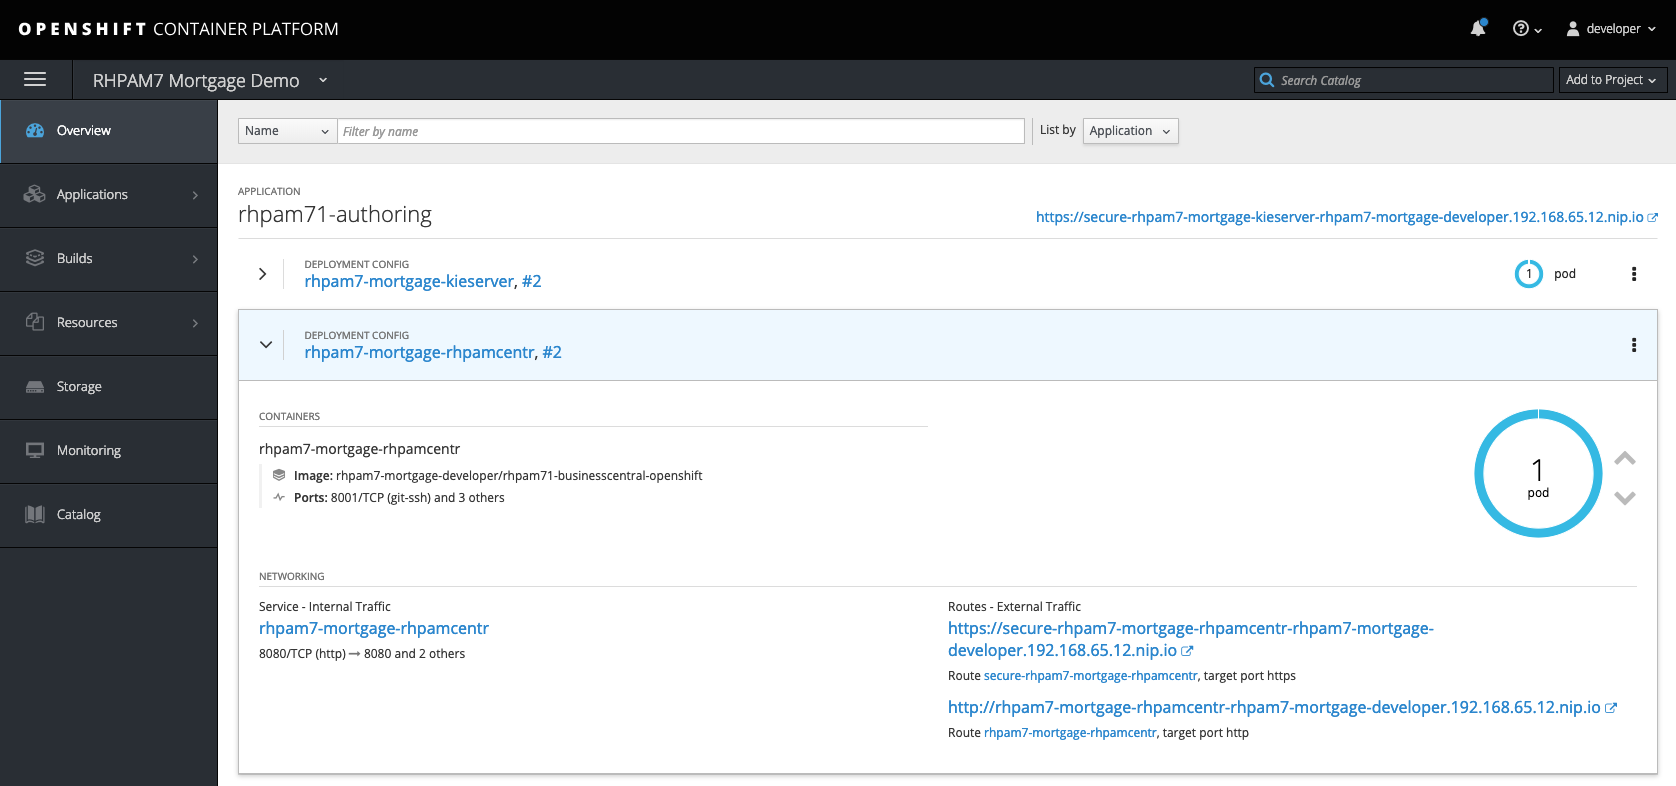
Our aim is to capture the network traffic on the KIE Server pod, so we can analyze the RESTful commands sent by the Business Central workbench to the KIE Server. To do this, we first need to attach a sidecar to the KIE Server pod:
- In the Overview screen, click the name of the pod that you want to analyze. This will open the Deployment Config (DC) screen.
- In the Deployment Config screen, in the upper right corner, click "Actions -> Edit YAML." This will open the DC's YAML configuration.
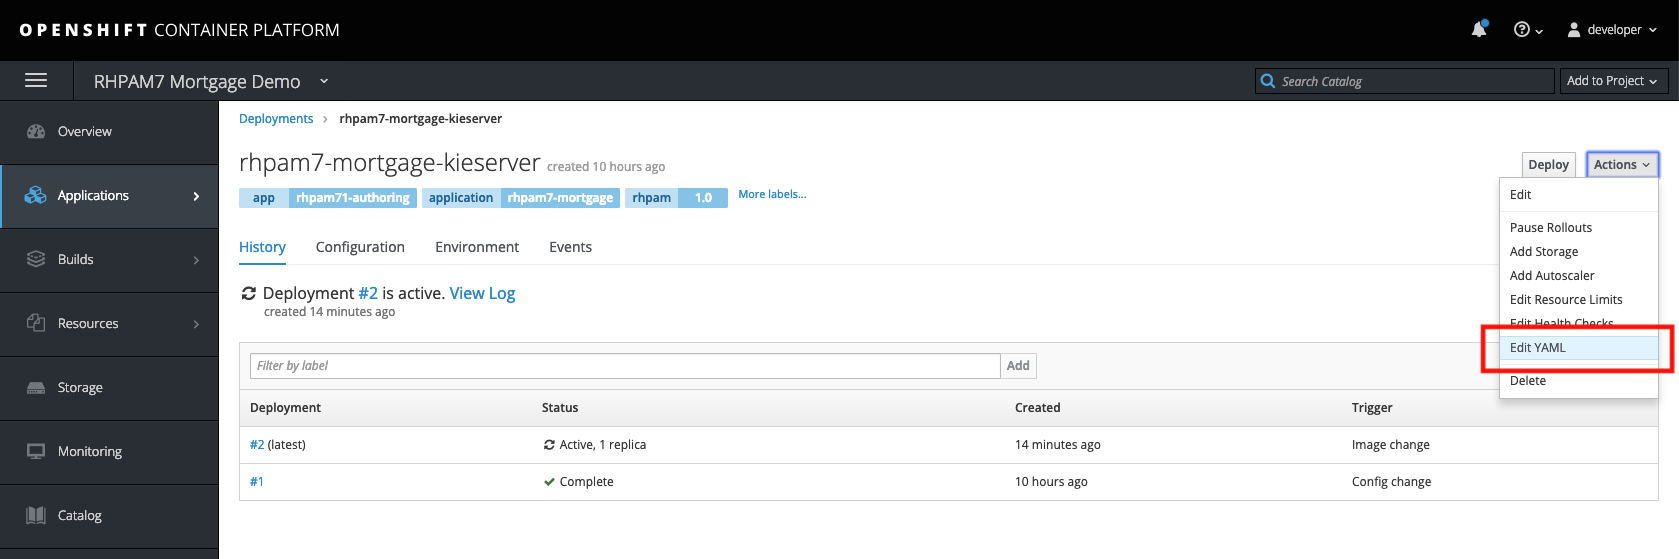
- Scroll down until you see the word "containers." We're going to add an additional container, our sidecar with
tcpdumpinstalled, to our pod. Add the following YAML snippet directly under the "containers" definition:
- name: tcpdump
   image: corfr/tcpdump
   command:
     - /bin/sleep
     - infinity
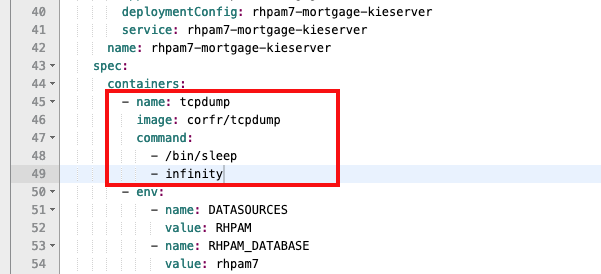
- Save the configuration. This will deploy a new pod that will now consist of two containers: one container with the KIE Server and the other container that contains our
tcpdumptool and which will keep running indefinitely.
Note that running a "sleep" command inside a container to keep it running is a bit of a "hack" and definitely not a good practice for containers running in production. However, after several failed approaches, which included running tcpdump as the container command, this approach made me achieve my goal in a controllable way.
Capturing and analyzing traffic
With the sidecar deployed and running, we can now start capturing data. One of the approaches I tried was to use the oc rsh command to remotely execute the tcpdump command inside the sidecar, stream the output to a FIFO file, and pipe the data directly into Wireshark. This approach failed for various reasons. One of the problems was that tcpdump sends info messages to stderr, but these messages will be received over SSH in the same stream as stdout, corrupting the data going into Wireshark.
The approach I ended up using is to log in to the sidecar container and, within the sidecar, run the tcpdump command to create a PCAP file. When you've captured enough data, you can stop the capturing process and copy the PCAP file to the machine on which you want to do the network traffic analysis with Wireshark. This is done as follows:
- On your development machine, with your
occlient connected to your OpenShift instance and with the correct project (namespace) active, run theoc get podscommand to list your pods:
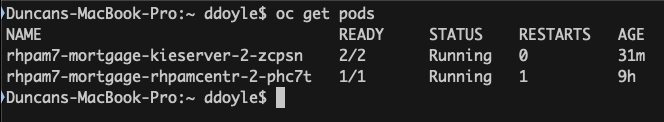
- Log in to the
tcpdumpcontainer of our KIE Server pod with the following command:oc rsh -c tcpdump rhpam7-mortgage-kieserver-2-zcpsn. - In the
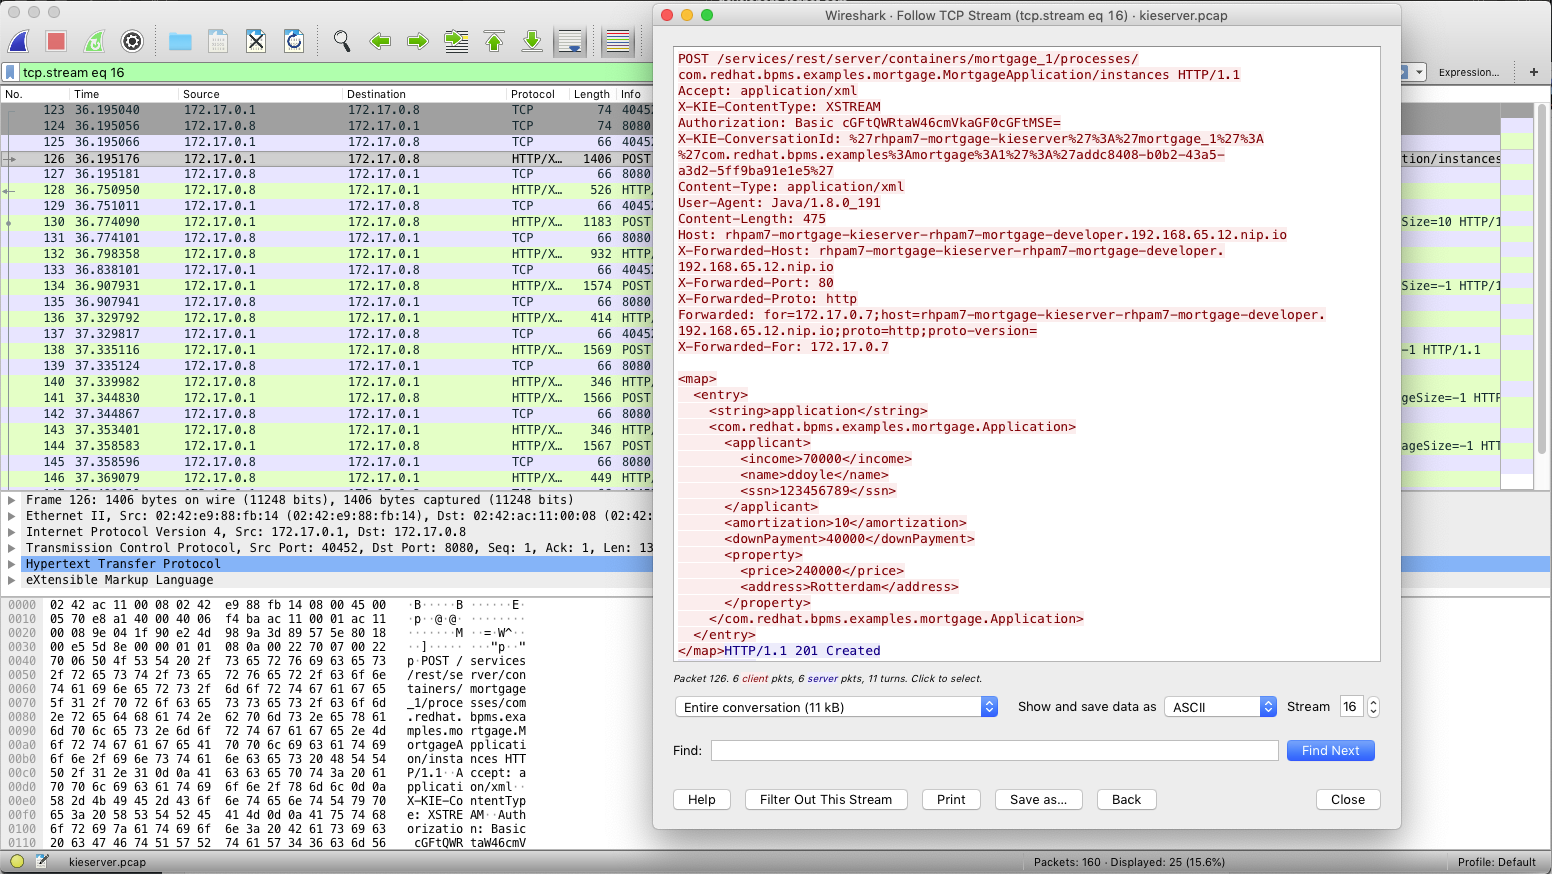
tcpdumpcontainer, run this command to start the network traffic capturing process:tcpdump -s 0 -n -w /tmp/kieserver.pcap. - Run the tests that create the network traffic you want to analyze. In this example, I'll be starting a Business Process from the Business Central workbench, which will send a RESTful request to the KIE Server.
- When you've captured enough data, finish the capturing process by using Ctrl+C in the
tcpdumpcontainer. - Go back to your local machine. Copy the PCAP file from the pod to your local machine:
oc cp -c tcpdump rhpam7-mortgage-kieserver-2-zcpsn:tmp/kieserver.pcap kieserver.pcap. - Open the PCAP file with Wireshark and analyze your network traffic. In this example, I'm analyzing my HTTP POST method that creates a new instance of our Mortgage process:
Conclusion
Analyzing network traffic between pods in a container environment like Kubernetes and/or OpenShift can be a bit harder than in non-container environments. However, the concept of sidecar containers gives developers an easy tool to attach containers, with the needed development tools and utilities, to a microservice pod. This prevents developers from having to install these kinds of debugging tools in the application container image itself, keeping the container light and clean. Using OpenShift tools like oc rsh and oc cp, I have shown how you can easily capture network traffic data from a pod and bring the data to a development machine for analysis.
If you're interested in learning more about using Istio Egress when your microservice needs to talk to another service that is outside of your OpenShift/Kubernetes/pods environment, see Istio Egress: Exit Through the Gift Shop.

About the author
Duncan Doyle is the Technical Marketing Manager for the Red Hat Decision Manager and Red Hat Process Automation Manager platforms. With a background in Red Hat Consulting and Services, Duncan has worked extensively with large Red Hat customers to build advanced, open-source business rules and business process management solutions.
He has a strong background in technologies and concepts like Service Oriented Architecture, Continuous Integration and Continuous Delivery, rules engines, and BPM platforms, and he is a subject matter expert (SME) on multiple Red Hat Middleware technologies, including, but not limited to, Red Hat JBoss Enterprise Application Platform, HornetQ, Red Hat Fuse, Red Hat Data Grid, Red Hat Decision Manager, and Red Hat Process Automation Manager. When he’s not working on open-source solutions and technology, he is building Lego with his son and daughter or jamming some 90’s rock music on his Fender Stratocaster.
